Abstract
Objective
Measurement of liver iron concentration is a key parameter for the management of patients with primary and secondary haemochromatosis. Magnetic resonance imaging (MRI) has already demonstrated high accuracy to quantify liver iron content. To be able to improve the current management of patients that are found to have iron overload, we need a reproducible, standardised method that is, or can easily be made, widely available.
Methods
This article discusses the different MRI techniques and models to quantify liver iron concentration that are currently available and envisaged for the near future from a realistic perspective.
Results
T2 relaxometry methods are more accurate than signal intensity ratio (SIR) methods and they are reproducible but are not yet standardised or widely available. SIR methods, on the other hand, are very specific for all levels of iron overload and, what is more, they are also reproducible, standardised and already widely available.
Conclusions
For these reasons, today, both methods remain necessary while progress is made towards universal standardisation of the relaxometry technique.
Keywords: Liver iron, Quantification, MRI, Relaxometry, Signal intensity ratio, Haemochromatosis, Iron overload
Introduction
Haemochromatosis is the most common cause of iron overload. In the primary or genetic form, there is excessive absorption of iron in the intestine, which cannot be eliminated by the body and accumulates in various organs, causing irreversible damage. In the secondary form, the surplus iron comes from multiple blood transfusions or blood disorders, such as haemolytic anemia or ineffective erythropoiesis, and again there is progressive accumulation in various organs. In both forms, the liver and the heart are the most damaged organs. The process can be reversed through treatment, by phlebotomies in primary haemochromatosis cases and using iron-chelating agents in patients with the secondary form [1, 2].
Indirect markers have been identified, such as serum ferritin and transferrin saturation, and these are sensitive but are not specific [3]. Further, the diagnosis of primary haemochromatosis has improved since various associated genetic mutations were discovered some years ago. Nevertheless, the key indicator is the measurement of liver iron concentration (LIC). Haemochromatosis is the only condition known to be able to cause the LIC to rise to above 80 μmol Fe/g or to twice the age of the patient. In its secondary form, it generally involves LIC values even higher than those seen in the primary one.
This is currently an important field: in the case of primary haemochromatosis because it is being confirmed that genetic mutations, widely studied in recent years, are not conclusive for the definitive diagnosis of the disease; and in the secondary form due to the emergence of new iron chelating agents, which are changing the clinical management of the disease.
Chemical analysis of a liver biopsy is the “gold standard” for the measurement of LIC, but patients are resistant to this approach as it is invasive and, moreover, results vary widely: the coefficient of variation in the quantification obtained by liver biopsy is from 19% in a healthy liver up to 40% in the case of cirrhosis [4–7]. In this context, the possibility of having at our disposal, a non-invasive tool such as magnetic resonance imaging (MRI), to accurately measure the LIC and thereby assess the need to treat a patient, as well as monitor their response to any treatment, represents a great step forward.
MRI-based techniques for assessing LIC can be classified into signal intensity ratio (SIR) and relaxometry methods. Various different techniques have been described, including: (1) relaxometry methods measuring absolute T2; (2) relaxometry methods measuring T2*, which is also an absolute value but measured with gradient echo (GRE) sequences; (3) methods measuring SIR between the liver and other tissues in which iron is not generally deposited, usually paraspinal muscles.
For MRI to be able to respond to the current challenges in clinical practice, it is necessary for there to be a universally accepted MRI method that is accurate, reproducible, standardised and widely available.
T2 relaxometry methods
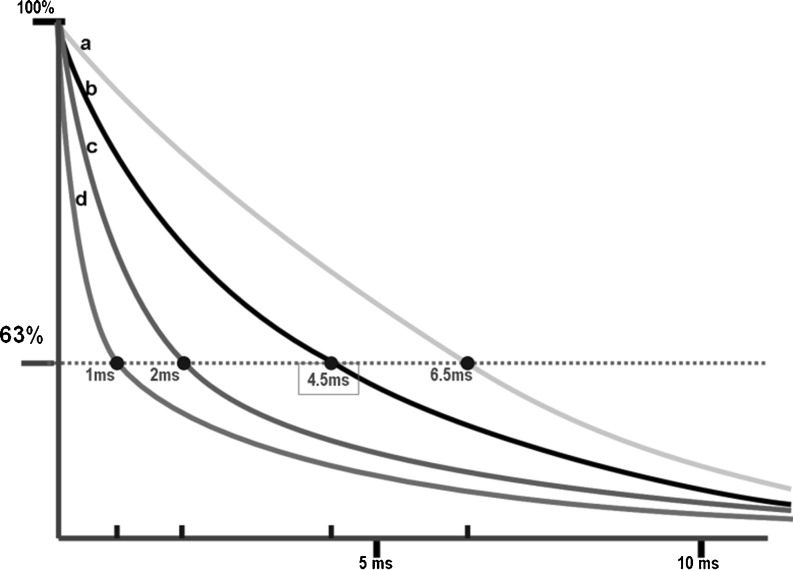
Assessment of iron overload is based on decreases in the T2 relaxation times induced in the liver due to the paramagnetic properties of iron. This acceleration of the T2 relaxation is proportional to the quantity of iron and leads to a decrease in the MRI signal intensity (SI) from the liver (Fig. 1).
Fig. 1.
T2* transverse relaxation decay curves of signals from the liver in four theoretical examples with different LIC values. a Liver without iron overload, at the lower limit of the normal range (T2* = 6.7 ms). b Liver with slight iron overload (T2* = 4.5 ms). c Liver with high iron overload (T2* = 2 ms). d Liver with very high iron overload (T2* = 1 ms)
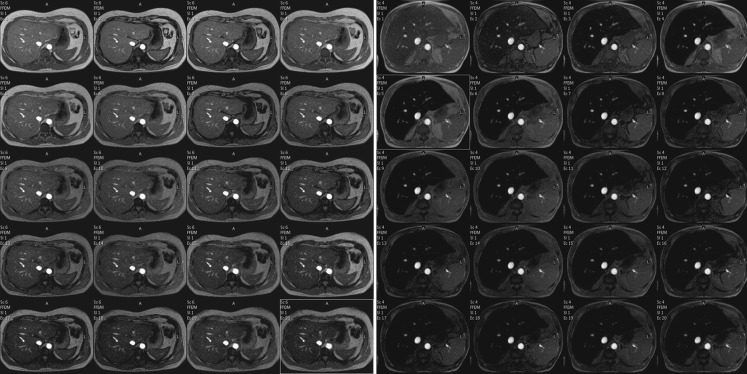
Relaxometry methods calculate T2 [8, 9] or T2* [10–13] by fitting a decay models to the average signal intensity at various echo times (TEs). These values may also be expressed as relaxation rates R2 (1/T2) or R2* (1/T2*). To obtain reliable measurements of T2 at different levels of iron overload, acquisition sequences with many different TEs are necessary (Fig. 2). SI is plotted as a function of echo time and a T2 parametric map is automatically obtained.
Fig. 2.
Multi-echo sequence of two patients with different LICs (TR 21 ms, flip angle 35° (TE first = 1.22 ms, TE interval = 1 ms, 20 echoes). Acquisition time: 14.5 s; matrix 244/145). a Patient without iron overload; isointensity of the liver for all the echoes; T2* =17.4 ms. b Patient with iron overload with loss of the signal from the first echoes; T2* = 2.1 ms
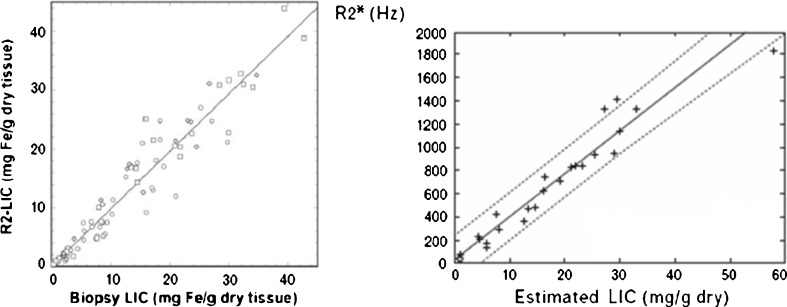
Many studies have shown a high correlation of T2 and T2* values with LIC measured in liver biopsies for the assessment of all levels of LIC [12, 13] (Fig. 3). Furthermore, it has been confirmed that the technique is reproducible with different machines. Some mathematical models have also been developed to transform T2 and T2* values into LIC values in mg Fe/g [11, 14]. In addition, they allow the measurement of the iron content in the myocardium, which is a very important parameter for the management of patients with secondary haemochromatosis.
Fig. 3.
R2 and R2* versus LIC measured in liver biopsies. a R2-LIC versus biopsy LIC in 105 patients. “R2 LIC” corresponds to values of LIC estimated from a calibration equation with R2 values (see [8]). b R2* versus biopsy LIC in 21 patients (r = 0.97) (see [11])
However, T2 and T2* relaxometry methods still have notable limitations. Measurements depend on both the MRI sequence parameters and the image analysis procedure, and there is still no consensus concerning which is the most appropriate MRI technique. Accordingly, to have a reproducibility of measurements it is important that universally accepted MRI protocols are established.
In particular, there is no general consensus on which index (R2, R2*) is best for the measurement of LIC [14–16]. For T2* calculations, GRE sequences are more sensitive to low iron content but they suffer from inaccuracies at high iron overload [17]. Christoforidis et al [18] compared two different MRI models that calculate R2 and R2* respectively, in a group of 98 patients with thalassemia, and found a lack of correlation between the two methods.
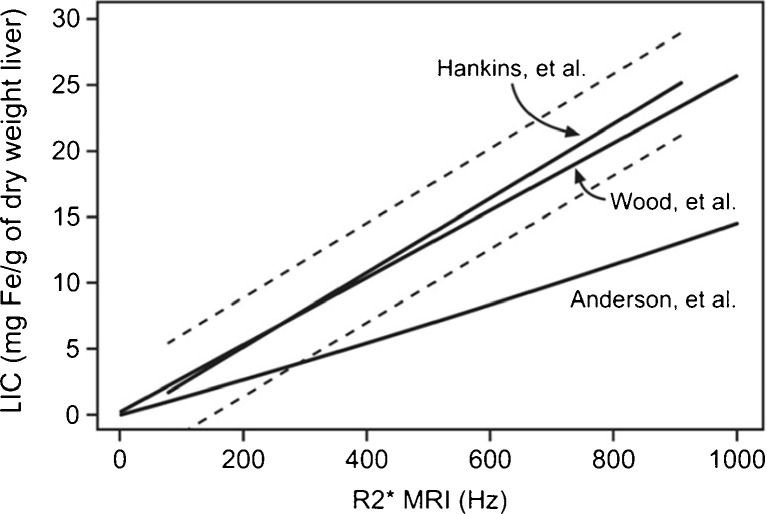
To minimise the uncertainty in the measured T2, a relatively large number of echoes is required in order to sample the entire exponential decay of the transverse magnetisation. Further, the first TE is key and should be as short as possible: 5 ms or less for T2 measurements [9, 14] and 1 ms or less for T2* methods [13, 18]. Hankins et al [13] compared R2* values to the LIC measured by liver biopsy using three different MRI methods, finding that the estimations obtained with the shortest first TE were the most closely correlated with the directly measured values (Fig. 4). T2 measurements are also influenced by echo spacing [9].
Fig. 4.
R2* values calculated with three different MRI methods with respect to the LIC measured in liver biopsies for the same group of patients. The models of Hankins et al and Wood et al have a better correlation than the model of Anderson et al The first echo is 2.3 ms in the Anderson et al model and 1 ms in the other two (see [13])
In the image analysis procedure, a critical aspect is the choice of the decay model to be used for fitting the SI-time curve. The single-exponential models used in earliest studies [10] had some limitations and various other data-fitting models have been proposed: single exponentials with truncation or with progressively less weight is given to weaker echoes, single-exponentials with a constant offset or with subtraction of measured image noise, or bi-exponentials [9, 11, 14, 19, 20]. Each model has advantages and disadvantages, and consensus has not yet been reached on which should be used. Further research is needed to identify the most accurate model.
Another serious limitation of T2 and T2* relaxometry methods is the limited access to the technique [15, 21–23]. New pulse sequences and software capable of generating T2* images are not compatible with older hardware [22]. The number of machines capable of performing these calculations automatically remains small. For example, the MIOT (Myocardial Iron Overload in Thalassemia) network in Italy, has grown since 2006 to reach 49 hematological or pediatric centers specialised in thalassemia, but has only six radiological centers with standardised MRI acquisition and image processing protocols. These groups point out that “MRI multi-echo T2* sequences able to quantify iron overload are still non-commercial and their installation requires the special involvement of the MRI scanner vendor”. Moreover, they state that other MRI centers need to be set up in the near future in order to “satisfy the requests from thalassemia centers”; currently, in the existing network, the average distance between the clinical centers and their corresponding radiological center is over 238 km [23].
There are now various types of post-processing solutions on offer. In particular, St Pierre et al [8, 14] have developed a service for calculating T2 (www.ferriscan.com) and the method has been approved by the Food and Drug Administration (FDA) in the USA. It requires previous external validation with a phantom and the data analysis is centralised. This involves an economic cost and takes two working days. Commercial post-processing software, approved by the FDA, is also available (CMR Tools, London, UK), but annual licensing fees may be prohibitive for some institutions [22].
In summary, in 2011, T2 relaxometry methods are already accurate and reproducible but are not yet standardised, nor are they widely available.
SIR methods
In this method, an indication of LIC is obtained by calculating the ratio between the SI of the liver and the SI in paraspinal muscle that does not accumulate iron. The SI measurements are performed in the same slice using large regions of interest (ROIs), and GRE sequences are used due to their greater sensitivity to the paramagnetic effect of iron. In order to be able to quantify all levels of iron overload more than one sequence are necessary [24–28].
The estimation of LIC by an SIR method is easier to perform than T2 relaxometry. The most widely recognised method is that developed by Gandon et al [24, 29] at the University of Rennes, France. They have designed a set of five breath-hold GRE sequences with fixed TR and different TE and flip angles, optimised for 0.5, 1.0 and 1.5 Tesla (T) magnetic fields. The method can easily be implemented by virtually all machines in the world (Table 1). On each sequence, the liver the SI is measured at three ROIs in the right lobe, while muscle SI is measured at ROIs in the right and left paraspinal muscles.
Table 1.
Different GRE sequences with fixed TR and variable TE and flip angle, for MRI with fields of 0.5, 1, and 1.5 Tesla, used in the method of Gandon et al from the University of Rennes, France (see [24, 29])
| 0.5 T | 1.0 T | 1.5 T | ||||||
|---|---|---|---|---|---|---|---|---|
| TR | TE | Flip | TR | TE | Flip | TR | TE | Flip |
| 120 | 14 | 90° | 120 | 7 | 90° | 120 | 4 | 90° |
| 120 | 14 | 20° | 120 | 7 | 20° | 120 | 4 | 20° |
| 120 | 28 | 20° | 120 | 14 | 20° | 120 | 9 | 20° |
| 120 | 21 | 20° | 120 | 14 | 20° | |||
| 120 | 21 | 20° | ||||||
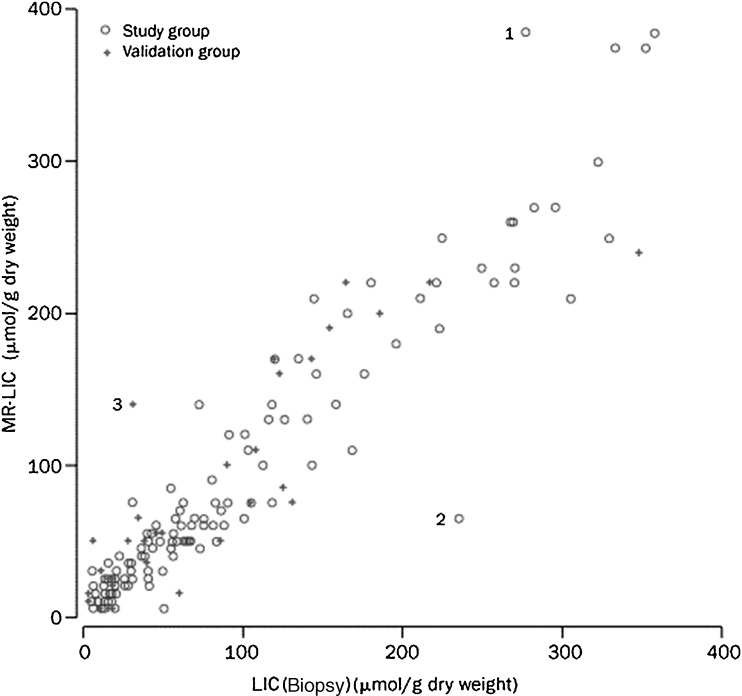
Gandon et al [24] published a description of this method in the Lancet in 2004. In a group of 139 patients, they estimated the LIC with high accuracy, ranging from 3 to 375 μmol Fe/g (mean difference of 0.8 μmol Fe/g; 95% confidence interval of 6.3–7.9). They validated the results in a validation group of 35 patients (Fig. 5). The University of Rennes has now provided a free online worksheet for calculating LIC using this method [29]. By combining liver and muscle (L/M) SIRs from the set of five sequences, it automatically calculates an LIC value in μmol Fe/g.
Fig. 5.
MRI-estimated LIC versus biopsy-measured LIC in 174 patients by the method of Gandon et al (see [24])
This recommended protocol is in general use across the world and many studies take the results obtained with it as the reference value for LIC. Christoforidis et al [18], compared the R2, R2* and values from the University of Rennes model in a group of 94 patients with thalassemia. The correlation between R2 and the Rennes values was better than that between R2 and R2*.
The method does, however, have some limitations. It saturates with very high iron overload and does not give a value of LIC higher than 350 μmol Fe/g. It always identifies these cases as very high iron overload (>350 μmol Fe/g). Such patients always have a sufficiently high iron overload to require treatment; nevertheless, not recognising all the range of LIC values with clinical significance is a limitation of the model. Specifically, many patients with secondary haemochromatosis have LIC levels in this range.
Responding to this issue, a research group led by Rose et al [30] from the University of Lille, France, has designed an algorithm with two T1-weighted sequences for cases which saturate at 350 μmol in the University of Rennes model, significantly improving the correlation with the true LIC (R = 0.81). They designed a computer-based algorithm to obtain the corresponding LIC automatically and have made it available free of charge online (from: http://oernst.f51vg.free.fr/liver/iron.html).
The protocol of the University of Rennes is now widely used in clinical practice, despite the fact that there has been relatively little research comparing the results of this model to the “gold standard”, the LIC measured by biochemical analysis of a liver biopsy. One recently published study did compare the LIC quantified by the University of Rennes model with the “gold standard” in a group of 171 patients [31]. It was found that the model correctly classified 105 (61%) of the patients according to the various levels of iron overload (normal <36 μmol Fe/g, moderate 37–79 μmol Fe/g and high >79 μmol Fe/g) (Table 2) (r = 0.87). A moderate tendency to overestimate LIC was observed: 43% of normal patients being classified as having iron overload and 45% of the patients with moderate iron overload being diagnosed with high iron overload; while very few patients were underestimated. Cut-off points with high predictive value (PV) for high iron overload diagnosis were calculated: (1) >170 μmol Fe/g revealed a positive PV of 100% (sensitivity 69%) and (2) <60 μmol Fe/g, a negative PV of 100% (specificity 75%). With these cut-off points, the model was reliable for ruling out or for supporting high iron overload diagnosis in 127 (74%) patients. For intermediate values, however, those between 60 and 170 μmol Fe/g, the diagnosis remained uncertain, 44 (26%) patients were in this group: 12 of these had normal iron levels and eight high iron overload [31].
Table 2.
Correlation between LIC values estimated by MRI using the method of Gandon et al [24] and true LIC measured in biopsies for three groups of patients with different levels of LIC (normal <36 μmolFe/g; moderate iron overload :37–80 μmolFe/g; high iron overload: >80 μmolFe/g) (see [24])
| MRI | Biopsy | |||
|---|---|---|---|---|
| Normal | Moderate | High | ||
| Normal | 61 | 1 | 0 | 62 |
| Moderate | 42 | 20 | 2 | 64 |
| High | 4 | 17 | 24 | 45 |
| 107 | 38 | 26 | 171 | |
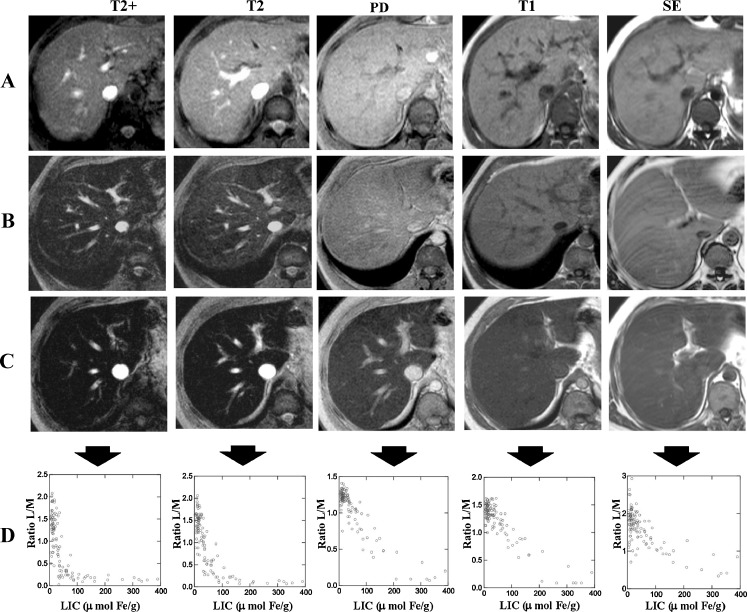
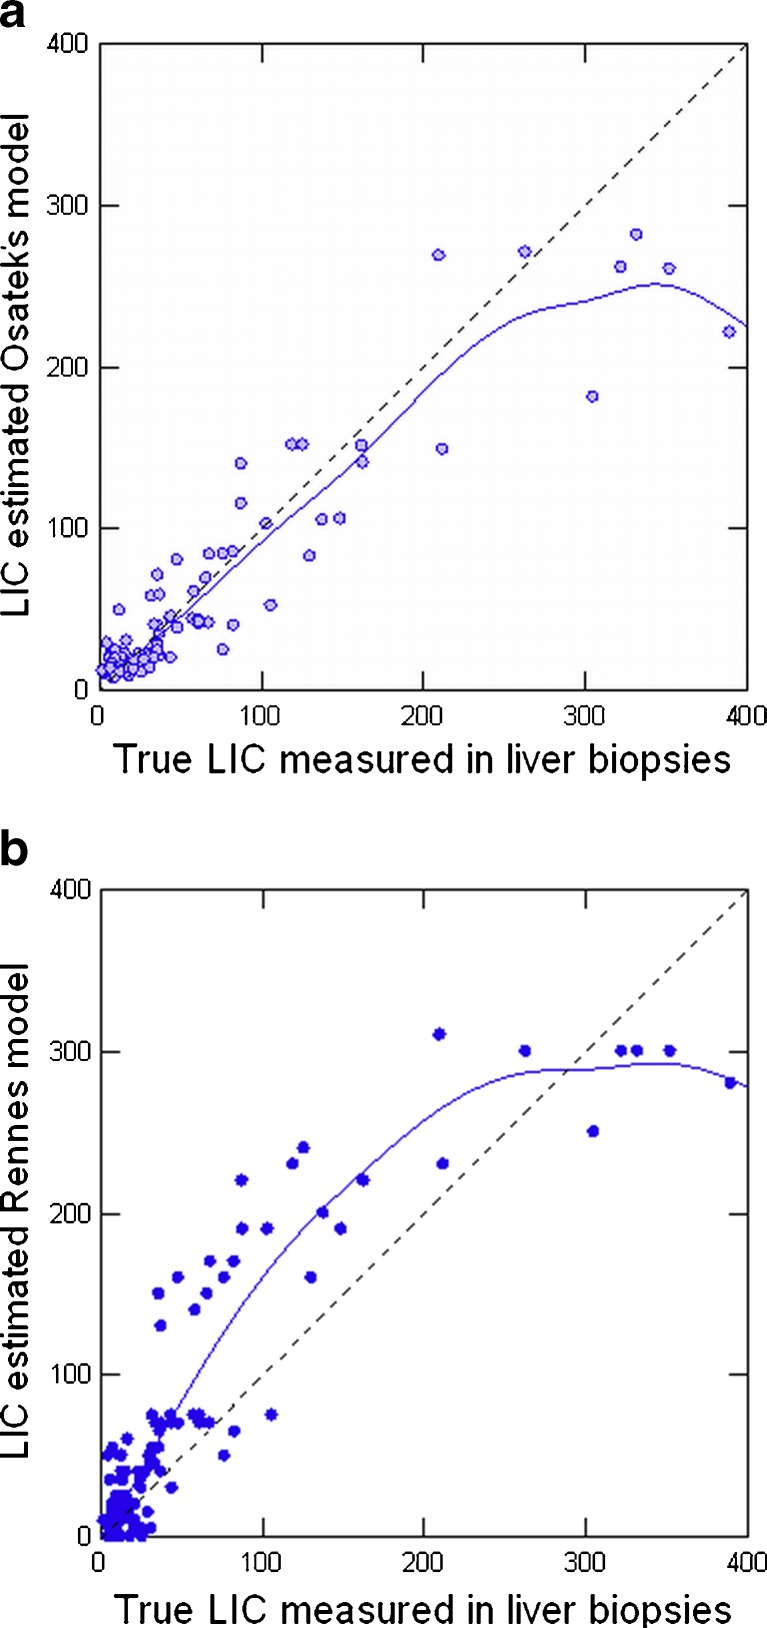
In addition, our working group, from 1999 to 2001, compared the L/M ratio of all sequences of the method from the University of Rennes to the LIC measured in liver biopsies in 112 patients (Fig. 6). When linear regression was performed between LIC and L/M ratios, we observed that the T2 and proton density (PD) sequences provided the best correlation. We created a model to estimate LIC: LIC = e[5.808 - (0.877 × T2) - (1.518PD)] where T2 and PD are the L/M ratios of these two sequences respectively [PD 120 ms/4 ms/20° (TR/TE/flip angle) and T2 120 ms/14 ms/20°] [25]. The correlation with the true LIC for this model was very high (r = 0.937) (Fig. 7a), while in the same group of patients the correlation with the model of the University of Rennes was less strong (r = 0.887) (Fig. 7b). We also calculated cut-off points with high predictive value for high iron overload. These were closer to true LIC values: 100% positive PV for estimated LIC > 85 μmol Fe/g (sensitivity 86%) and 100% negative PV for estimated value <40 μmol Fe/g (specificity 75%) [25].
Fig. 6.
MRI sequences of the method of Gandon et al in three patients with different levels of LIC. a Patient without iron overload. b Patient with moderate iron overload. c Patient with high iron overload. d Scatterplots of L/M ratio and LIC for each MRI sequence. There is a maximal decrease in liver SI with most T2-weighted sequences. SE spin echo T1 sequence, PD proton density sequence (see [25])
Fig. 7.
MRI-estimated LIC versus biopsy-measured LIC in 112 patients. a By Osatek’s model (r = 0.937). b By the model of Gandon et al (r = 0.887) (see [18])
Our hospital is a referral center for a population of 400,000 and since 2002 we have processed more than 900 patients with alterations in iron metabolism. It requires a straightforward test, with patients having to lie in the machine for only 10 min. Then, with a simple Excel worksheet, we automatically obtain the iron concentration in micromoles [32].
Since 2007, we have had a multi-echo sequence to calculate R2* (20 different echoes with TE ranging between 1.1 and 19.1 s) (TR/TE/ΔTE/flip angle, 188 ms/1.14 ms/0.9 ms/35°) (Fig. 2). We compared the LIC estimated by the aforementioned SIR model and by R2* in a group of patients, obtaining a good correlation between the two values (r2 = 0.86). Currently, we are carrying out studies using the SIR method, which has demonstrated a high level of precision in clinical practice and provides us with a meaningful LIC value in μmol Fe/g to include in clinical reports. In parallel, we continue to use the multi-echo sequence to measure T2* to assess iron concentration in the myocardium.
In, summary, SIR methods are sufficiently accurate for many cases in clinical practice and, what is more, they are also reproducible, standardised and already widely available.
Conclusion
T2 relaxometry is the best method to quantify LIC using MRI. It is accurate and reproducible at all levels of iron overload, and also allows myocardial iron concentration to be measured. However, T2 relaxometry models are not yet standardised and, in our opinion, there are considerable barriers to them becoming widely available in the near future. On the other hand, SIR methods, although they are less accurate with values of LIC > 350 μmol Fe/g, should continue to be used since they have high specificity at all levels of iron overload, they have been standardised, and are reproducible and, moreover, they are already widely available.
References
- 1.Brittenham GM, Badman DG. Non invasive measurement of iron: report of an NIDDK workshop. Blood. 2003;101:15–19. doi: 10.1182/blood-2002-06-1723. [DOI] [PubMed] [Google Scholar]
- 2.Pietrangelo A, Deugnier Y, Dooley J, et al. EASL clinical practice guidelines for HFE haemochromatosis. European Association for the Study of the Liver. J Hepatol. 2010;53:3–22. doi: 10.1016/j.jhep.2010.03.001. [DOI] [PubMed] [Google Scholar]
- 3.Allen KJ, Gurrin LC, Constantine CC, et al. Iron-overload-related disease in HFE hereditary haemochromatosis. N Engl J Med. 2008;358:221–230. doi: 10.1056/NEJMoa073286. [DOI] [PubMed] [Google Scholar]
- 4.Villeneuve JP, Bilofdeau M, Lepage R, et al. Variability in hepatic iron concentration measurement from needle-biopsy specimens. J Hepatol. 1996;25:172–177. doi: 10.1016/S0168-8278(96)80070-5. [DOI] [PubMed] [Google Scholar]
- 5.Ambu R, Crisponi G, Sciot R, et al. Uneven hepatic iron and phosphorus distribution in beta-thalassemia. J Hepatol. 1995;23:544–549. doi: 10.1016/0168-8278(95)80060-3. [DOI] [PubMed] [Google Scholar]
- 6.Crisponi G, Ambu R, Cristiani F, et al. Does iron concentration in a liver needle biopsy accurately reflect hepatic iron burden in beta-thalassemia? Clin Chem. 2000;46:1185–1188. [PubMed] [Google Scholar]
- 7.Emond MJ, Bronner MP, Carlson TH, et al. Quantitative study of the variability of hepatic iron concentrations. Clin Chem. 1999;45:340–346. [PubMed] [Google Scholar]
- 8.St Pierre TG, Clark PR, Chua-anusorn W, et al. Noninvasive measurement and imaging of liver iron concentrations using proton magnetic resonance. Blood. 2005;105:855–861. doi: 10.1182/blood-2004-01-0177. [DOI] [PubMed] [Google Scholar]
- 9.Alexopoulou E, Stripeli F, Baras P, et al. R2 relaxometry with MRI for the quantification of tissue iron overload in beta-thalassemic patients. J Magn Reson Imaging. 2006;23:163–170. doi: 10.1002/jmri.20489. [DOI] [PubMed] [Google Scholar]
- 10.Anderson LJ, Holden S, Davis B, et al. Cardiovascular T2-star (T2*) magnetic resonance for the early diagnosis of myocardial iron overload. Eur Heart J. 2001;22:2171–2179. doi: 10.1053/euhj.2001.2822. [DOI] [PubMed] [Google Scholar]
- 11.Wood JC, Enriquez C, Ghugre N, et al. MRI R2 and R2* mapping accurately estimates hepatic iron concentration in transfusion-dependent thalassemia and sickle cell disease patients. Blood. 2005;106:1460–1465. doi: 10.1182/blood-2004-10-3982. [DOI] [PMC free article] [PubMed] [Google Scholar]
- 12.Westwood MA, Anderson LJ, Firmin DN, et al. A single breath-hold multiecho T2* cardiovascular magnetic resonance technique for diagnosis of myocardial iron overload. J Magn Reson Imaging. 2003;18:33–39. doi: 10.1002/jmri.10332. [DOI] [PubMed] [Google Scholar]
- 13.Hankins JS, McCarville MB, Loeffler RB, et al. R2* magnetic resonance imaging of the liver in patients with iron overload. Blood. 2009;113:4853–4855. doi: 10.1182/blood-2008-12-191643. [DOI] [PMC free article] [PubMed] [Google Scholar]
- 14.St Pierre TG, Clark PR, Chua-Anusorn W. Single spin-echo proton transverse relaxometry of iron loaded-liver. NMR Biomed. 2004;17:446–448. doi: 10.1002/nbm.905. [DOI] [PubMed] [Google Scholar]
- 15.Wood JC. Magnetic resonance imaging measurement of iron overload. Curr Opin Hematol. 2007;14:183–190. doi: 10.1097/MOH.0b013e3280d2b76b. [DOI] [PMC free article] [PubMed] [Google Scholar]
- 16.Argyropoulou MI, Astrakas L. MRI evaluation of tissue iron burden in patients with beta-thalassaemia major. Pediatr Radiol. 2007;37:1191–1200. doi: 10.1007/s00247-007-0567-1. [DOI] [PMC free article] [PubMed] [Google Scholar]
- 17.Papakonstantinou O, Kostaridou S, Man's T. Quantification of liver iron overload by T2 quantitative magnetic resonance imaging in thalassemia: impact of chronic hepatitis C on measurements. J Pediatr Hematol Oncol. 1999;21:142–148. doi: 10.1097/00043426-199903000-00011. [DOI] [PubMed] [Google Scholar]
- 18.Christoforidis A, Perifanis V, Spanos G, et al. MRI assessment of liver iron content in thalassamic patients with three different protocols: comparisons and correlations. Eur J Haematol. 2009;82:388–392. doi: 10.1111/j.1600-0609.2009.01223.x. [DOI] [PubMed] [Google Scholar]
- 19.Positano V, Salani B, Pepe A, et al. Improved T2* assessment in liver iron overload by magnetic resonance imaging. Magn Reson Imaging. 2009;27:188–197. doi: 10.1016/j.mri.2008.06.004. [DOI] [PubMed] [Google Scholar]
- 20.Sirlin CB, Reeder SB. Magnetic resonance imaging quantification of liver iron. Magn Reson Imaging Clin N Am. 2010;18:359–381. doi: 10.1016/j.mric.2010.08.014. [DOI] [PMC free article] [PubMed] [Google Scholar]
- 21.Taouli B, Ehman RL, Reeder SB. MRI methods for assessment of chronic liver disease. AJR Am J Roentgenol. 2009;193:14–27. doi: 10.2214/AJR.09.2601. [DOI] [PMC free article] [PubMed] [Google Scholar]
- 22.Wood JC. History and current impact of cardiac magnetic resonance imaging on the management of iron overload. Circulation. 2009;120:1937–1939. doi: 10.1161/CIRCULATIONAHA.109.907196. [DOI] [PMC free article] [PubMed] [Google Scholar]
- 23.Meloni A, Ramazzotti A, Positano V, et al. Evaluation of a web-based network for reproducible T2* MRI assessment of iron overload in thalassemia. Int J Med Inform. 2009;78:503–512. doi: 10.1016/j.ijmedinf.2009.02.011. [DOI] [PubMed] [Google Scholar]
- 24.Gandon Y, Olivié D, Guyader D, et al. Non-invasive assessment of hepatic iron stores by MRI. Lancet. 2004;363:357–362. doi: 10.1016/S0140-6736(04)15436-6. [DOI] [PubMed] [Google Scholar]
- 25.Alústiza JM, Artetxe J, Castiella A, et al. MR quantification of hepatic iron concentration. Radiology. 2004;230:479–484. doi: 10.1148/radiol.2302020820. [DOI] [PubMed] [Google Scholar]
- 26.Ernst O, Sergent G, Bonvarlet P, et al. Hepatic iron overload: diagnosis and quantification with MR imaging. AJR Am J Roentgenol. 1997;168:1205–1208. doi: 10.2214/ajr.168.5.9129412. [DOI] [PubMed] [Google Scholar]
- 27.Ernst O, Rose C, Sergent G, et al. Hepatic iron overload: quantification with MR imaging at 1.5 T. AJR Am J Roentgenol. 1999;172:1141–1142. doi: 10.2214/ajr.172.4.10587170. [DOI] [PubMed] [Google Scholar]
- 28.Bonkovsky HL, Rubin RB, Cable EE, et al. Hepatic iron concentration: non-invasive estimation by means of MR imaging techniques. Radiology. 1999;212:227–232. doi: 10.1148/radiology.212.1.r99jl35227. [DOI] [PubMed] [Google Scholar]
- 29.Gandon Y. Iron and liver. Available at: www.radio.univ-rennes1.fr
- 30.Rose C, Vandevenne P, Bourgeois E, et al. Liver iron content assessment by routine and simple magnetic resonance imaging procedure in highly transfused patients. Eur J Haematol. 2006;77:145–149. doi: 10.1111/j.0902-4441.2006.t01-1-EJH2571.x. [DOI] [PubMed] [Google Scholar]
- 31.Castiella A, Alústiza JM, Emparanza JI, et al. Liver iron concentration quantification by MRI. Are recommended protocols accurate enough for clinical practice? Eur Radiol. 2011;21:137–141. doi: 10.1007/s00330-010-1899-z. [DOI] [PubMed] [Google Scholar]
- 32.Alústiza JM. Sedia investiga. Cálculo Hierro Hepático. Available at: www.sedia.es


