Abstract
Purpose
This study was performed to evaluate possible variations in maxillary and mandibular bone texture of normal population using the fractal analysis, particles count, and area fraction in intraoral radiographs.
Materials and Methods
Periapical radiographs of patients who had full mouth intraoral radiographs were collected. Regions of interest (100×100 pixels) were located between the teeth of the maxillary anterior, premolar, and molar area, as well as the mandibular anterior, premolar, and molar areas. The fractal dimension (FD) was calculated by using the box counting method. The particle count (PC) and area fraction (AF) analyses were also performed.
Results
There was no significant difference in the FD values among the different groups of age, gender, upper, and lower jaws. The mean FD value was 1.49±0.01. The mean PC ranged from 44 to 54, and the mean AF ranged from 10.92 to 11.85. The values of FD, PC, and AF were significantly correlated with each other except for the upper molar area.
Conclusion
According to the results, patients with normal trabecular pattern showed a FD of approximately 1.5. Based on these results, further investigation would be recommended if the FD value of patient significantly differenct from this number, since the alteration of this value indicates microstructural modification of trabecular pattern of the jaws. Additionally, with periapical radiographs, simple and cost-effective, PC and AF could be used to assess the deviation from the normal.
Keywords: Fractals; Image Processing, Computed-Assisted
Introduction
An understanding of normal anatomical structures on the radiographic image is fundamental for using the images as a diagnostic aid or in designing research. Therefore, an effort has been made to identify and understand most structures that appear on intra- and extra-oral radiographs. It may be somewhat surprising that a structure as ordinary as the alveolar bone has attracted researchers' attention, resulting in a variety of interpretations. Especially the interdental bony structure often described as an outline of compact bone (lamina dura) enclosing a trapezoidal wedge of trabecular bone between the roots. The internal aspect of alveolar bone has been given multiple names such as cancellous, medulary, spongy, and trabecular bone. These terms are freely interchangeable in the literature. Dental researchers and clinicians have historically assumed the lattice-like pattern observed on intra-oral radiographs as an accurate image of the internal bony medullary cavity. The radiographic appearance of normal (healthy) trabecular bone was described almost 80 years ago and that traditional description has not been changed since then.1
Because of its high surface area-to-volume ratio, the trabecular bone is believed to have an 8-fold higher turnover rate than cortical bone and to be highly responsive to metabolic stimuli.2 This is an important phenomenon since the maxilla and mandible are rich in trabecular bone, particularly in the anterior regions. It must be recognized, however, that it is unclear which structures give rise to the trabecular pattern seen on dental radiographs. Bender and Seltzer3 stated that removal of cancellous bone from the posterior region of cadaver mandibles showed no alteration of the radiographic appearance of the trabeculae. Bone trabecular pattern can be characterized by a number of measures including area of the bony plates, circumference of the trabeculae, number of bony and marrow regions, thickness of the trabeculae, trabecular spacing, and osseous fractal dimension.4
Bone mineral density (BMD) and trabecular bone microstructure are very important since they are defining osteoporosis proposed by the World Health Organization.5 One way of estimating the microstructure of the jaw bone tissue is to assess the trabecular pattern on intraoral radiographs.
To date, many methods have been established in order to investigate the quality of alveolar bone. Among these, fractal analysis of the bone tissue has been introduced as an accurate, economical and easily available method.6-9 In this method, morphometric analysis of bone texture and fractal analysis are mathematical processing methods using a radiographic image.10 Since the internal aspect of alveolar bone includes spicules, trabeculae, and lamellae, which form a spongy structure, it has been assumed that the latticelike pattern is an accurate expression for the internal bony medullary cavity as observed on intraoral radiographs.1,11
In fractal analysis, a box-counting algorithm is mainly used to quantify the trabecular pattern by counting the trabecular bone and bone marrow interface. The method also assesses the boundary of trabecular bone and marrow; a higher box counting value indicates a more complex structure.7,10,12,13
The aim of this study was to investigate the normal parameters and the result of alveolar bone fractal analysis, particles count and area fraction. Another purpose was to characterize how the morphological features of the cancellous bone of the maxilla and mandible differed in various areas and to show possible normal variations. Thus, it would help to detect the patients with bone diseases, osteoporosis, hyperparathyroidism, hemolytic anemia and so on. In addition, this study especially focused on examining the intrinsic morphologic features of the trabecular bone that were essentially independent of exposure and processing variables rather than direct optical density of bone on radiographs. Intrinsic morphological features assay would be more appropriate for use in general dental offices.
Materials and Methods
This was a retrospective study of intraoral radiographs collected from patients' files that were part of the database of the School of Dentistry at the University of Michigan. The research protocol was approved by the research ethic committee of the University of Michigan. The cases were selected to be free from medical diseases which could affect the bone structures. The periapical radiographs of six hundred patients (complete mouth surveys) were collected and the radiographs of diagnostic quality were digitized by scanning them at 600 dpi after coding process.
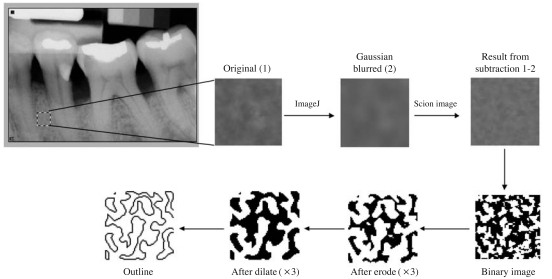
Using Adobe Photoshop (Adobe Systems Inc., San Jose, CA, USA) software, the digitized radiographs were opened and the regions of interest (ROIs) of 100×100 pixels were selected, from trabecular bone free from teeth or any super imposition. Then the image was cropped and saved in BMP format. The ROI was selected from each case including six regions (anterior, premolar, and molar areas in the upper and lower jaws) using ImageJ (ver. 1.38x, National Institute of Health, Bethesda, MD, USA). The selected area was processed using the method designed by White and Rudolph.14 In brief, the transferred cropped ROI was filtered using Gaussian blur, sigma=3 to remove the fine and medium scale variations in image brightness, and then saved again. Using Scion image, the original ROI and the blurred one were subtracted from each other and multiplied by one and added 128. Then the resultant image was converted to binary with threshold at grey level of 128. The binary image was eroded three times and dilated three times to reduce the noise. Finally, the image was outlined and used for fractal analysis and particles. On the outline binary image, the skeletal structure indicated the bone patter, whereas the bone outline represented the bone marrow (Fig. 1).
Fig. 1.
Image processing procedure to make the outline image from a periapical radiograph. The resultant image is used for the analyses of fractal dimension, particles count, and area fraction.
All digital manipulations and measurements were made within ROIs. Using ImageJ, the fractal dimensions (FDs) of the outlined image were calculated by the Box Counting function. Initially, the image was converted by square grid of equally sized tiles; the widths of the square boxes were 2, 3, 4, 6, 8, 12, 16, 32, and 64 pixels. Subsequently, the number of the counted tiles was plotted against the total number of tiles in a double logarithmic scale. Finally, FD was calculated from the slope of the line fitted on data points.
Using ImageJ, the particles counts (PCs) and the area fraction (AF) of the region were measured. The PC command counted and measured the objects in binary or threshold images. It worked by scanning the image or selection until it found the edge of an object. It then outlined the object using the wand tool, measured it using the Measure command, and filled to make it invisible. Then, the scanning was resumed until it reached the end of the image or selection. Here, AF means the percentage of pixels in the image.
Results
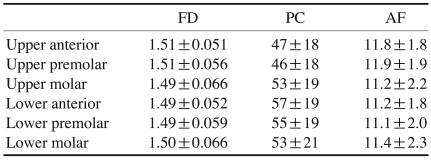
The cases in this study included 93.7% males, and 6.3% females. The results of this study showed no significant correlation between the different age groups, or gender. The mean age was 41.6 year. The mean FD was 1.49±0.01 in all ROIs in the different areas of the mouth, and the mean PC in each ROI ranged from 44 to 54. Moreover, the mean AF of the particles in each ROI ranged from 10.9 to 11.9 (Table 1).
Table 1.
Fractal dimension (FD), particles count (PC), area fraction (AF) according to the ROIs (mean±SD)
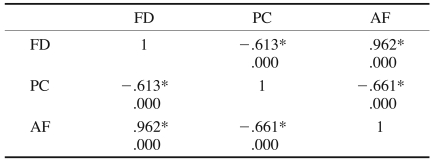
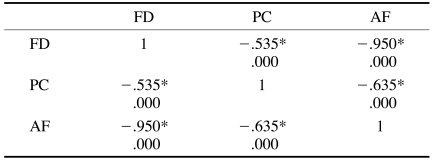
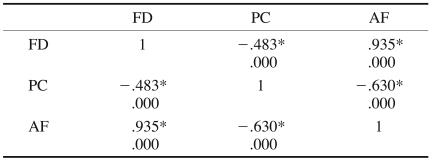
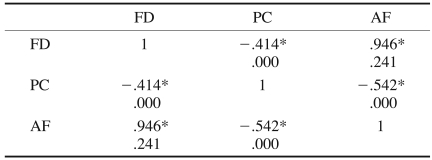
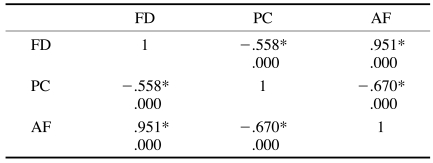
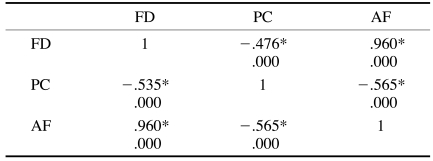
Tables 2-7 show the correlation of the FD, with the PC, and AF of the six areas of the mouth. The FD of the areas (upper anterior, premolars, molars, and lower anterior, premolars, and molar) showed a high significant correlation with the PC and AF of the same area. In addition, the PC revealed a significant correlation with AF (Tables 2-7).
Table 2.
Correlation between the fractal dimension (FD), particles count (PC), and area fraction (AF) at the upper anterior area
*Correlation is significant at level 0.01
Table 7.
Correlation of the fractal dimension (FD), particles count (PC), and area fraction (AF) to each other at the lower molar area
*Correlation is significant at level 0.01
Tables 8-10 show the correlation of the areas of the mouth in FD, PC, and AF, respectively. The correlation between the FDs in the different areas of the jaws (Table 8) revealed a significant correlation between the upper anterior area, upper molar area, and lower molar area, while the upper premolar area significantly correlated with the three lower sites. The FD of the upper molar area showed a significant correlation with those of the lower anterior and premolar areas. The lower anterior area showed a significant correlation with the upper premolar, molar, lower premolars, and molars areas. The lower premolar area showed a significant correlation with the upper premolar, upper molar, and lower anterior area.
Table 8.
Correlation of the fractal dimension at the various sites
*significant at 0.01
Table 10.
Correlation of the area fraction at the various sites
*significant at 0.01
Table 9 shows that the PC of the upper anterior area showed a significant correlation with those of all the sites (upper and lower). The PC of the upper premolar area showed a significant correlation with those of all the six sites. The PC of the upper molar revealed a significant correlation with those of all the six sites of the jaws. The PC of the lower anterior area revealed a significant correlation with those of all the six sites of the jaws. The PC of the lower premolar showed a significant correlation with those of all the sites of the jaws. The PC of the lower molar area revealed a significant correlation with those of all the sites of the jaws.
Table 9.
Correlation of the particles count at the various sites
*significant at 0.01
Table 10 shows that the AF of the upper anterior area revealed a significant correlation with those of the upper molar and lower molar area. The AF of the upper premolar area showed a significant correlation with those of the lower premolar and molar areas. The AF of the upper molar area showed a significant correlation with those of the lower anterior and premolar areas. The AF of the upper molar area revealed a significant correlation with those of the upper anterior, lower anterior, and lower premolar areas. The AF of the lower anterior area revealed a significant correlation with those of the upper molar and lower molar areas. The AF of the lower premolar area showed a significant correlation with those of the upper premolar molar and lower anterior areas. The AF of the lower molar area revealed a significant correlation with those of the upper anterior and premolar areas.
Discussion
The current study examined the trabecular architecture in intraoral radiographs. Intraoral radiographs are potentially suited for osteoporosis screening since they are taken on a large portion of the population annually.
One of the strengths of our study was the use of periapical radiographs which could be taken in general dental practice daily to diagnose common dental diseases. In addition, there was no special standardization technique. Therefore, the assessment of the trabecular pattern on these radiographs could be a cost-effective tool to identify individuals who are candidates for BMD testing. Furthermore, in the dental office, the information derived from the intraoral radiographs could be combined with a patient's medical and pathological history such as history of fracture to screen patients in need of further investigations.14,15
Of the several methods that have been developed to estimate the alveolar bone density from dental radiographs, fractal analysis appears to hold the greatest promise as an inexpensive and readily available method.6,7,9,16
The trabecular bone has a branching pattern that exhibits fractal properties such as self-similarity and lack of well-defined scale. Because of this phenomenon, the application of fractal geometry and the measurement of fractal dimensions can be used to determine trabecular complexity and bone structure.17 Fractal analysis is a technique for identifying scale-invariant structure that is not affected by exposure or minor alignment variations of radiographs.18-20 This makes it well suited for the analysis of trabecular bone patterns in radiographs. Fractal analysis is a noninvasive tool that can describe biological systems in clinical studies. Researchers have used this technique to analyze iliac crests,21 axial bones,22 and tumours.23 There are many approaches for estimating fractal dimension, but the box-counting method is the most widely used and is suited for binary image analysis. There is still an opportunity to further optimize the image for characterization of the trabecular and marrow components of the bone. In particular, the specific sequence of erosion and dilation used to smooth the image, as well as the brightness threshold value selected to make the image binary, has a substantive influence on the image appearance.14 In this study, the erosion and dilation were performed three times in an attempt to reduce noise and overcome all the variation derived from non standardization of the radiographs. In addition, instead of skeletonizing the image, the image was outlined. The mean FD of all the six different sites of the jaw was 1.49±0.01, and the mean PC and AF were as shown in Table 1. This proved that the normal FD of all the jaw sites was relatively similar, thus that any variation from this value indicated further investigation to rule out changes in BMD. However, it must be stressed that the clinician or the researcher would have to follow the same data processing protocol described in this study because any variation in this process might affect the results.
In 2006, Jolley and colleagues24 showed that the periapical radiographs could provide a reliable method for determining fractal dimension to analyze the changes in alveolar bone density of various bone diseases. Demirbas et al25 conducted a study of mandiblular bone changes in sickle cell anemia (SCA) by fractal analysis. It stated that the FD of the control group was 1.719, while that of SCA was 1.6855. The difference of the FD in control group (healthy) between their study and this study might be originated from several factors; first, the ROI size was 65×65 pixels in their study while 100×100 pixels in this study. Second, the data processing method was different from the one used in this study since we used a modification of the protocol used in the White and Rudolph's14 study.
Shrout et al26 used a caliper method of fractal analysis to compare the trabecular pattern differences between healthy and moderate periodontal patients. In this study, the FD showed a significant correlation with PC and AF in all of the six sites of the jaws. Regarding the FD of the different sites, the result showed that the FD of the upper anterior area showed a significant correlation with those of the upper molar area and lower molar areas. In the upper premolar area, it showed a significant correlation with all of the lower sites, while the upper molar area revealed a significant correlation with the upper anterior, lower anterior, and premolar areas. This suggests that each site has a different anisotropy which characterizes the degree of the directional organization of a material. The more preferential direction the structure has, the more important the degree of anisotropy. Anisotropy is influenced by the main direction of strengths applied to the bone.27
Trabecular shape and orientation are adaptive to changes in the mechanical environment, such as those induced by aging or osteoporosis. In these conditions some trabeculae disappear; indeed, trabeculae oriented in the direction of the main forces applied to the bone are not removed, or are removed last because of the adaptation phenomenon.
This is in agreement with Yasar and Akgunlu8 who investigated the differences of FDs of radiographical trabecular bone between dentate and edentulous regions of the mandible. They observed that the differences in the occlusal forces generated in the dentate and edentulous region during mastication caused some alterations in trabecular bone structure, which lead to lower FDs in the dentate regions. Southard et al28 stated that the radiographic FD of the alveolar process density was significantly related to the alveolar process density in healthy women, but was not related to the density of the spine, hip, or radius. Otis et al6 also used FD values to investigate the effects of the quality and quantity of the bone surrounding the teeth on the extent of apical root resorption.
This study showed that the PC of each site revealed a significant correlation with the other sites of the jaws. The PC represented the area of the trabeculae in the ROI, therefore it might not be related with its perimeter which was represented by FD. The AF, the ratio of the particles in ROI, of the anterior premolar area showed a significant correlation with those of the upper premolar and lower premolar areas, while the AF of premolar area showed a significant correlation with those of the upper anterior, lower premolar, and lower molar areas. The AF of the upper molar area showed a significant correlation with those of the upper anterior, the lower anterior, and lower premolar areas.
There were conflicting reports concerning FDs in the radiographic images. In contrast to the findings of Ruttimann et al,29 that the FD increased with decalcification, Southard et al30 calculated the decreasing values for the FD with decalcification. The disagreement of the results in their studies could be explained by anatomical variations, discrepancies in the methods used to obtain 2-dimensional bone images, in the techniques for measuring fractal dimension, and/or the differences in selecting the areas to be measured.27 The present study provided the differences between numerous anatomical sites in normal patients. In addition, it provided other methods such as PC and AF to support the FD.
In conclusion, our study showed that healthy patients with normal trabecular pattern have a FD of approximately 1.5 in all regions of the maxilla and mandible. Our results confirmed the results from previous studies which stated that FD analysis was a practical method to investigate trabecular bone architecture. Moreover, PC and AF can specify the information about the bone microstructure and BMD, and support the FD.
Table 3.
Correlation of the fractal dimension (FD), particles count (PC), and area fraction (AF) to each other at the upper premolar area
*Correlation is significant at level 0.01
Table 4.
Correlation of the fractal dimension (FD), particles count (PC), and area fraction (AF) to each other of at the upper molar area
*Correlation is significant at level 0.01
Table 5.
Correlation of the fractal dimension (FD), particles count (PC), and area fraction (AF) to each other of the lower anterior area
*Correlation is significant at level 0.01
Table 6.
Correlation of the fractal dimension (FD), particles count (PC), and area fraction (AF) to each other at the lower premolar area
*Correlation is significant at level 0.01
References
- 1.Jett S, Shrout MK, Mailhot JM, Potter BJ, Borke JL. An evaluation of the origin of trabecular bone patterns using visual and digital image analysis. Oral Surg Oral Med Oral Pathol Oral Radiol Endod. 2004;98:598–604. doi: 10.1016/S1079210404005244. [DOI] [PubMed] [Google Scholar]
- 2.Lang P, Steiger P, Faulkner K, Gluer C, Genant HK. Osteoporosis. Current techniques and recent developments in quantitative bone densitometry. Radiol Clin North Am. 1991;29:49–76. [PubMed] [Google Scholar]
- 3.Bender IB, Seltzer S. Roentgenographic and direct observation of experimental lesions in bone: I. 1961. J Endod. 2003;29:702–706. doi: 10.1097/00004770-200311000-00005. [DOI] [PubMed] [Google Scholar]
- 4.Parfitt AM. Trabecular bone architecture in the pathogenesis and prevention of fracture. Am J Med. 1987;82:68–72. doi: 10.1016/0002-9343(87)90274-9. [DOI] [PubMed] [Google Scholar]
- 5.Genant HK, Cooper C, Poor G, Reid I, Ehrlich G, Kanis J, et al. Interim report and recommendations of the World Health Organization Task-Force for Osteoporosis. Osteoporos Int. 1999;10:259–264. doi: 10.1007/s001980050224. [DOI] [PubMed] [Google Scholar]
- 6.Otis LL, Hong JS, Tuncay OC. Bone structure effect on root resorption. Orthod Craniofac Res. 2004;7:165–177. doi: 10.1111/j.1601-6343.2004.00282.x. [DOI] [PubMed] [Google Scholar]
- 7.Heo MS, Park KS, Lee SS, Choi SC, Koak JY, Heo SJ, et al. Fractal analysis of mandibular bony healing after orthognathic surgery. Oral Surg Oral Med Oral Pathol Oral Radiol Endod. 2002;94:763–767. doi: 10.1067/moe.2002.128972. [DOI] [PubMed] [Google Scholar]
- 8.Yaşar F, Akgünlü F. The differences in panoramic mandibular indices and fractal dimension between patients with and without spinal osteoporosis. Dentomaxillofac Radiol. 2006;35:1–9. doi: 10.1259/dmfr/97652136. [DOI] [PubMed] [Google Scholar]
- 9.Prouteau S, Ducher G, Nanyan P, Lemineur G, Benhamou L, Courteix D. Fractal analysis of bone texture: a screening tool for stress fracture risk? Eur J Clin Invest. 2004;34:137–142. doi: 10.1111/j.1365-2362.2004.01300.x. [DOI] [PubMed] [Google Scholar]
- 10.Chen SK, Oviir T, Lin CH, Leu LJ, Cho BH, Hollender L. Digital imaging analysis with mathematical morphology and fractal dimension for evaluation of periapical lesions following endodontic treatment. Oral Surg Oral Med Oral Pathol Oral Radiol Endod. 2005;100:467–472. doi: 10.1016/j.tripleo.2005.05.075. [DOI] [PubMed] [Google Scholar]
- 11.Shrout MK, Jett S, Mailhot JM, Potter BJ, Borke JL, Hildebolt CF. Digital image analysis of cadaver mandibular trabecular bone patterns. J Periodontol. 2003;74:1342–1347. doi: 10.1902/jop.2003.74.9.1342. [DOI] [PubMed] [Google Scholar]
- 12.Parkinson IH, Fazzalari NL. Methodological principles for fractal analysis of trabecular bone. J Microsc. 2000;198:134–142. doi: 10.1046/j.1365-2818.2000.00684.x. [DOI] [PubMed] [Google Scholar]
- 13.Ergun S, Saracoglu A, Guneri P, Ozpinar B. Application of fractal analysis in hyperparathyroidism. Dentomaxillofac Radiol. 2009;38:281–288. doi: 10.1259/dmfr/24986192. [DOI] [PubMed] [Google Scholar]
- 14.White SC, Rudolph DJ. Alterations of the trabecular pattern of the jaws in patients with osteoporosis. Oral Surg Oral Med Oral Pathol Oral Radiol Endod. 1999;88:628–635. doi: 10.1016/s1079-2104(99)70097-1. [DOI] [PubMed] [Google Scholar]
- 15.White SC, Rudolph DJ, Ma L. Influence of x-ray beam angulation and exposure on morphologic features of trabecular bone. Int J Oral Biol. 1999;24:17–23. [Google Scholar]
- 16.Yasar F, Akgünlü F. Fractal dimension and lacunarity analysis of dental radiographs. Dentomaxillofac Radiol. 2005;34:261–267. doi: 10.1259/dmfr/85149245. [DOI] [PubMed] [Google Scholar]
- 17.Haire TJ, Hodgskinson R, Ganney PS, Langton CM. A comparison of porosity, fabric and fractal dimension as predictors of the Young's modulus of equine cancellous bone. Med Eng Phys. 1998;20:588–593. doi: 10.1016/s1350-4533(98)00063-0. [DOI] [PubMed] [Google Scholar]
- 18.Buckland-Wright JC, Lynch JA, Rymer J, Fogelman I. Fractal signature analysis of macroradiographs measures trabecular organization in lumbar vertebrae of postmenopausal women. Calcif Tissue Int. 1994;54:106–112. doi: 10.1007/BF00296060. [DOI] [PubMed] [Google Scholar]
- 19.Lynch JA, Hawkes DJ, Buckland-Wright JC. Analysis of texture in macroradiographs of osteoarthritic knees using fractal signature. Phys Med Biol. 1991;36:709–722. doi: 10.1088/0031-9155/36/6/001. [DOI] [PubMed] [Google Scholar]
- 20.Lynch JA, Hawkes DJ, Buckland-Wright JC. A robust and accurate method for calculating fractal signature of texture in macroradiographs of osteoarthritic knees. Med Inform (Lond) 1991;16:241–251. doi: 10.3109/14639239109012130. [DOI] [PubMed] [Google Scholar]
- 21.Fazzalari NL, Parkinson IH. Fractal properties of cancellous bone of the iliac crest in vertebral crush fracture. Bone. 1998;23:53–57. doi: 10.1016/s8756-3282(98)00063-5. [DOI] [PubMed] [Google Scholar]
- 22.Haidekker MA, Andresen R, Evertsz CJ, Banzer D, Peitgen HO. Assessing the degree of osteoporosis in the axial skeleton using the dependence of the fractal dimension on the grey level threshold. Br J Radiol. 1997;70:586–593. doi: 10.1259/bjr.70.834.9227251. [DOI] [PubMed] [Google Scholar]
- 23.Dey P, Rajesh L. Fractal dimension in endometrial carcinoma. Anal Quant Cytol Histol. 2004;26:113–116. [PubMed] [Google Scholar]
- 24.Jolley L, Majumdar S, Kapila S. Technical factors in fractal analysis of periapical radiographs. Dentomaxillofac Radiol. 2006;35:393–397. doi: 10.1259/dmfr/30969642. [DOI] [PubMed] [Google Scholar]
- 25.Demirbas AK, Ergün S, Güneri P, Aktener OP, Boyacioğglu H. Mandibular bone changes in sickle cell anemia: fractal analysis. Oral Surg Oral Med Oral Pathol Oral Radiol Endod. 2008;106:e41–e48. doi: 10.1016/j.tripleo.2008.03.007. [DOI] [PubMed] [Google Scholar]
- 26.Shrout MK, Roberson B, Potter BJ, Mailhot JM, Hildebolt CF. A comparison of 2 patient populations using fractal analysis. J Periodontol. 1998;69:9–13. doi: 10.1902/jop.1998.69.1.9. [DOI] [PubMed] [Google Scholar]
- 27.Chappard C, Brunet-Imbault B, Lemineur G, Giraudeau B, Basillais A, Harba R, et al. Anisotropy changes in post-menopausal osteoporosis: characterization by a new index applied to trabecular bone radiographic images. Osteoporos Int. 2005;16:1193–1202. doi: 10.1007/s00198-004-1829-5. [DOI] [PubMed] [Google Scholar]
- 28.Southard TE, Southard KA, Lee A. Alveolar process fractal dimension and postcranial bone density. Oral Surg Oral Med Oral Pathol Oral Radiol Endod. 2001;91:486–491. doi: 10.1067/moe.2001.112598. [DOI] [PubMed] [Google Scholar]
- 29.Ruttimann UE, Webber RL, Hazelrig JB. Fractal dimension from radiographs of peridental alveolar bone. A possible diagnostic indicator of osteoporosis. Oral Surg Oral Med Oral Pathol. 1992;74:98–110. doi: 10.1016/0030-4220(92)90222-c. [DOI] [PubMed] [Google Scholar]
- 30.Southard TE, Southard KA, Jakobsen JR, Hillis SL, Najim CA. Fractal dimension in radiographic analysis of alveolar process bone. Oral Surg Oral Med Oral Pathol Oral Radiol Endod. 1996;82:569–576. doi: 10.1016/s1079-2104(96)80205-8. [DOI] [PubMed] [Google Scholar]


