

Abstract
Previous research has identified a “synchrony window” of several hundred milliseconds over which auditory-visual (AV) asynchronies are not reliably perceived. Individual variability in the size of this AV synchrony window has been linked with variability in AV speech perception measures, but it was not clear whether AV speech perception measures are related to synchrony detection for speech only or for both speech and nonspeech signals. An experiment was conducted to investigate the relationship between measures of AV speech perception and AV synchrony detection for speech and nonspeech signals. Variability in AV synchrony detection for both speech and nonspeech signals was found to be related to variability in measures of auditory-only (A-only) and AV speech perception, suggesting that temporal processing for both speech and nonspeech signals must be taken into account in explaining variability in A-only and multisensory speech perception.
I. INTRODUCTION
The temporal coordination of signals from multiple sensory modalities is a necessary condition for multisensory integration (Stein and Meredith, 1993). However, multisensory signals do not have to be precisely physically synchronous in order to be perceived as single temporal events. For example, previous research using detection, discrimination, syllable identification, and sentence intelligibility tasks has consistently identified an “intersensory synchrony window” (Lewkowicz, 1996) of several hundred milliseconds during which human observers perceive desynchronized auditory and visual signals as synchronous. Table I summarizes previous studies that have attempted to define the temporal limits of a window for auditory-visual (AV) synchrony perception in normal-hearing adults.
TABLE I.
Previous research on AV synchrony perception
| Study | N | Stimulus type | Visual stimulus | Auditory stimulus | Taska | Asynchrony levelsb | Window (ms) |
|---|---|---|---|---|---|---|---|
| Dixon and Spitz (1980) | 18 | Nonspeech | Hammer hitting nail | Hammering sound | D (MOA) | n/a | A75V-V188A |
| Dixon and Spitz (1980) | 18 | Speech | Passages | Passages | D (MOA) | n/a | A131V-V258A |
| Grant and Greenberg (2001) | 9 | Speech | Sentences | Sentences | Int | A400, 300, 200, 160, 120, 80, 40V, V40, 80, 120, 160, 200, 300, 400A |
A40-80V-V200A |
| Grant et al. (2003) | 26 | Speech | Sentences | Sentences | D (FCT) | n/a | A35V-V230A |
| Lewkowicz (1996) | 10 | Nonspeech | Bouncing green disk | Descending tone | D (MCS) | A50, 80, 110, 140V V110, 140, 170, 200A |
A65V-V112A |
| Massaro et al. (1996) | 28 | Speech/ speechlike |
Synthetic syllables |
Natural and synthetic syllables |
M Int | Exp. 1: A267, 167, 67V V67, 167, 267A Exp. 2: A533, 267, 133V V133, 267, 533A |
A250V-V250A |
| McGrath and Summerfield (1985) | 12 | Speechlike | Liplike Lissajous pattern |
Triangular wave approximating a CV syllable |
D (FCT) | n/a | A79V-V138A |
| Munhall et al. (1996) | 19 | Speech | Natural syllables | Natural syllables | M Int | A360, 300, 240, 180, 120, 60V, V60, 120, 180, 240, 300, 360A |
A60V-V240A |
| van Wassenhove et al. (2002) | 36 | Speech | Natural syllables | Natural syllables | M Int; D (MCS) |
A467V-V467A | ~A67V-~V167A |
D=synchrony detection; MCS=method of constant stimuli; MOA=method of adjustment; FCT=forced choice to threshold; Int=speech integration; M Int=McGurk syllable integration.
All numbers are in milliseconds. The synchronous condition was always tested. A#V indicates that the auditory signal preceded the visual signal by # ms, and V#A indicates that the visual signal led by # ms.
Three characteristics of the AV synchrony window are relatively consistent across studies, despite differences in the stimuli, tasks, and statistical procedures used by different investigators. First, the synchrony window is on the order of several hundred milliseconds wide. The width of the window may reflect general information processing constraints that link events perceptually when they occur within around 200 ms of each other (Munhall et al., 1996). A multisensory interaction window that is several hundred milliseconds wide is also consistent with the estimates of the temporal window for multisensory enhancement and depression reported in electrophysiological studies in animals (King and Palmer, 1985; Meredith, 2002; Meredith et al., 1987; Stein and Meredith, 1993). Second, the synchrony window is asymmetrical: Visual-leading asynchronies are more difficult to detect than auditory-leading asynchronies. Finally, the width of the synchrony window varies a great deal across individuals, although judgments of AV synchrony appear to be highly consistent within individuals (Stone et al., 2001).
The present study focused on the individual variability in the AV synchrony window. It has been proposed that greater attunement to AV synchrony in speech may be associated with better visual-only speech perception (“lipreading” or “speechreading”) skills (McGrath and Summerfield, 1985), or alternatively with greater multisensory benefit from having both auditory and visual speech signals available (Grant and Seitz, 1998). In particular, individuals who are better at utilizing visual-only or auditory-plus-visual information to understand speech may also be more attuned to detailed temporal relationships between auditory and visual speech signals.
Although previous studies suggest that the perception of AV synchrony in speech is related to AV speech perception abilities, it is possible that the variability in the synchrony window is also related to the perception of multisensory nonspeech signals. For instance, variability in sensory processing, perceptual learning, or cognitive abilities such as visual or auditory attention could all lead to individual differences in the size of the synchrony window for both speech and nonspeech signals. However, because most previous studies investigating AV synchrony perception have used either speech or nonspeech signals but not both, it is difficult to judge the extent to which the AV synchrony windows for speech and nonspeech signals are similar or related and also the extent to which each of these synchrony windows is related to measures of speech perception. Addressing these issues may lead to new insights about the relationship between general multisensory perception and multisensory perception of speech.
The primary aim of this study was to further examine the individual variability in the synchrony window for speech and nonspeech signals and the relationship of this variability to auditory-only, visual-only, and AV speech perception. A secondary aim was to characterize the relationship or lack of a relationship between speech and nonspeech synchrony windows within participants.1 We measured normal-hearing adults’ ability to detect AV synchrony in both speech and nonspeech signals. We also measured the performance of the same participants on a sentence intelligibility task using auditory-only (A-only), visual-only (V-only), and AV presentation formats. Based on previous empirical results (Grant and Seitz, 1998; McGrath and Summerfield, 1985; Pandey et al., 1986), we hypothesized that participants with better speech perception scores would be more accurate at detecting AV synchrony. In addition, because a preliminary study indicated that the synchrony window is highly similar for our particular speech and nonspeech signals (Conrey and Pisoni, 2003), we predicted that better synchrony detection for both speech and nonspeech signals would also be related to higher speech perception scores.
II. METHODS
A. Participants
Thirty-nine Indiana University undergraduates participated in the experiment. Data from 9 subjects were excluded from analysis for the following reasons: 3 participants did not follow directions on one or the other of the synchrony detection task conditions (they reversed their response hand), and 6 participants responded “synchronous” more than 50% of the time at all asynchrony levels and their data could not be fit with the same curve-fitting procedures used for the other participants. The remaining 30 participants included 25 females and 5 males who ranged in age from 18 to 22 years (mean age=19.67 years).
B. Procedure
Each participant completed both speech and nonspeech conditions in an AV synchrony detection task (described later). The participants also completed a modified version of the City University of New York (CUNY) Sentences Test (Boothroyd et al., 1985). The CUNY test evaluates the perception of spoken sentences presented in the A-only, V-only, and AV modalities. Participants always completed the CUNY test first, followed by the AV synchrony detection task. The conditions in the CUNY test were presented in the order A-only, V-only, and then AV, and the order of the speech and nonspeech conditions of the AV synchrony detection task was counterbalanced across participants.
1. CUNY sentences
As administered in this experiment, the CUNY test consisted of three sets of 12 sentences. A different set of sentences was used for each of the A-only, V-only, and AV conditions for a given observer. Before beginning each condition, the participants were given three example trials in which they viewed and/or heard sentences but were not required to respond. During the test itself, each sentence was presented, then the participant was asked to respond by typing what he or she thought the speaker had said. The sentences were all spoken by the same female talker originally recorded by Boothroyd et al. (1985) and later digitized by Theresa Hnath-Chisolm and her graduate students at the University of South Florida. In our version of the CUNY test, the sentences were presented using SuperCard 4.1.1 (copyright 1989–2003, Solutions Etcetera) running a program created in SuperEdit (copyright 1989–2003, Solutions Etcetera) for the MacIntosh.
The participants were all normal-hearing adults. In order to avoid ceiling effects in the A-only and AV conditions, the auditory signal was degraded to make the test more difficult. Specifically, following the methods for locally time-reversed speech (TRS) described by Saberi and Perrott (1999), the signal was divided into 80-ms long segments. Each segment was time-reversed, and then the segments were reassembled in the original order. TRS was chosen as the method to degrade performance because reversing the time segments forced participants to perceptually integrate over long time scales in order to understand what was said. The choice of TRS as it pertains to our results will be addressed in Sec. IV. Eighty ms was chosen for the reversal interval because pilot testing in our lab found that this level was more difficult than the 50-ms interval, at which participants performed at near-ceiling levels, and less difficult than the 100-ms interval, which was nearly impossible for most participants. The 80-ms interval seemed likely to produce a range of variability in results without unduly frustrating participants.
2. AV synchrony detection
a. Stimuli
The nonspeech stimuli were modeled after those used in a PET study by Bushara et al. (2001) that investigated the neural correlates of AV asynchrony detection for several asynchrony levels. The present study used a 4-cm-diam red circle paired with a 2000-Hz tone. As in the earlier Bushara et al. study, the visual and auditory stimuli were both 100 ms in duration. The nonspeech stimuli were not intended to be analogous to the speech stimuli. Instead, they were chosen as a simple static stimulus to contrast with the complex dynamic speech stimuli and to test for the possibility that multisensory processing even for simple non-speech signals might be related to variability in AV speech perception.
For the speech condition, 10 familiar English words were chosen from the Hoosier Audiovisual Multitalker Database (Lachs and Hernandez, 1998; Sheffert et al., 1996), which contains digitized AV movies of isolated monosyllabic words spoken by single talkers. The most intelligible of the eight talkers in the database was determined in a previous study, and A-only, V-only, and AV intelligibility data had been collected for all her utterances (Lachs, 1999; Lachs and Pisoni, 2004a, 2004b). In this study, all 10 words were spoken by this talker. All of the words used in the present experiment had 100% intelligibility scores for both auditory-alone and AV presentation.
The experimental stimuli used in this study were created using Final Cut Pro 3 (copyright 2003, Apple Computer, Inc.). The visual and auditory stimuli were combined beforehand into precompiled movies rather than being assembled “on the fly” by the computer during the experiment. Precompiling the movies ensured reliable timing of the auditory and visual signals, essential for this experiment. For the asynchronous speech stimuli, the portions of the audio and video tracks that did not overlap with each other were edited from the stimulus movie. The removed portions did not contain any speech sounds, and the finished movies started and ended with the mouth in a neutral, nonarticulating position. The movies were edited in this way so that the participants would be unable to rely on any global temporal cues such as the audio track playing while the screen was blank to determine if the movie was synchronous. Instead, the participants had to make their judgments about synchrony based on whether the presented auditory and visual information was temporally coincident across both modalities.
Previous research on AV synchrony detection (Dixon and Spitz, 1980; Lewkowicz, 1996; Massaro and Cohen, 1993; Massaro et al., 1996; McGrath and Summerfield, 1985; Pandey et al., 1986) and pilot studies in our lab indicated that most normal-hearing young adult participants were able to judge AV stimuli as asynchronous with close to 100% accuracy when the auditory signal leads the visual signal by 300 ms (A300V ms) and when the visual signal leads the auditory signal by 500 ms (V500A ms). These asynchrony levels served as the upper limits of the stimuli presented in our study, and many individual participants could detect smaller levels of asynchrony with close to 100% accuracy. Because the videos used were recorded at a rate of 30 frames/s, each successive stimulus could differ by 33.33 ms. This resulted in 25 asynchrony levels covering a range of 800 ms, from A300V to V500A. Nine stimuli had auditory leads, one was synchronous, and fifteen had visual leads.
b. Procedure
The visual stimuli were presented on an Apple Macintosh G4 computer. Auditory stimuli were presented over Beyer Dynamic DT headphones at 70 dB SPL. PsyScope version 1.5.2 (Cohen et al., 1993) was used for stimulus presentation and response collection. All participants were tested in both speech and nonspeech conditions. The conditions were blocked and were counterbalanced across participants.
The stimuli were presented in a single-interval synchrony detection task using the method of constant stimuli. On each trial, the participants were asked to judge whether the AV stimulus was synchronous or asynchronous (“in sync” or “not in sync”). Participants were instructed to press one button on a response box if the stimuli were synchronous and another if they were asynchronous. Response hand was counterbalanced across participants but kept constant for each participant on both conditions of the experiment so as to minimize confusion about the instructions. Before beginning each condition, the participants received instructions and were presented with examples of synchronous and asynchronous movies for that condition.
Each of the two conditions consisted of a block of 250 randomized trials, 10 for each of the 25 asynchrony levels. In the nonspeech condition, all trials used the same visual and auditory stimuli, the red circle and the 2000-Hz tone described earlier. In the speech condition, each of the 10 words was presented once at each asynchrony level. At the onset of each trial, a fixation mark (“+”) was displayed on the computer screen for 200 ms and was followed by 300 ms of blank screen before the test stimulus was presented. The participant’s response cued the onset of the next trial.
III. RESULTS
A. CUNY sentences
Participants’ responses were printed out from an output file and scored by comparison with a master list of sentences. Responses were scored using a “whole-word” method: Each word was given a score of 1 or 0 points based on whether it was completely correct or had any errors, respectively. The reversal of two letters in a word, as in appel for apple, was counted as correct as long as the reversal did not form a new English word. Similarly, one-letter typographical errors that did not result in the formation of a new word were also counted as correct.
As expected, the participants’ performance was worst overall with the visual-only sentences, with a mean score of 16 words correct (s.d. =7) out of 102. A-only scores were next, with a mean of 44 (s.d.=15). Participants were best overall at the AV condition, with a mean score of 81 (s.d. =10). All but 3 individual participants had higher A-only than V-only scores, and all were best at the AV condition. The distributions of A-only, V-only, and AV scores are shown in Fig. 1.
FIG. 1.

Distribution of A-only, V-only, and AV scores on the CUNY sentences. All scores are out of a possible 102 whole words correct.
B. AV synchrony detection
Throughout this report, we will refer to synchronous AV stimuli as the 0 condition, for 0-ms delay/lead. Because our figures represent auditory leads to the left side of 0 on the abscissa and visual leads to the right, “lower” will indicate further toward the auditory-leading side of the figure, and “higher” will indicate further toward the visual-leading side of the figure. Similarly, negative numbers will refer to the auditory signal leading the visual signal in time, and positive numbers to the visual signal leading the auditory signal.
The proportion of synchronous responses at each level of asynchrony was determined for each participant. The average proportions of synchronous responses are plotted for the speech and nonspeech conditions in Fig. 2. In looking at the figure, two major findings are apparent. First, the average range of asynchronies identified as synchronous was quite large, on the order of several hundred milliseconds. Second, this range was not centered at 0 ms, the physically synchronous condition, but was shifted to the right and centered on the visual-leading side of the continuum.
FIG. 2.
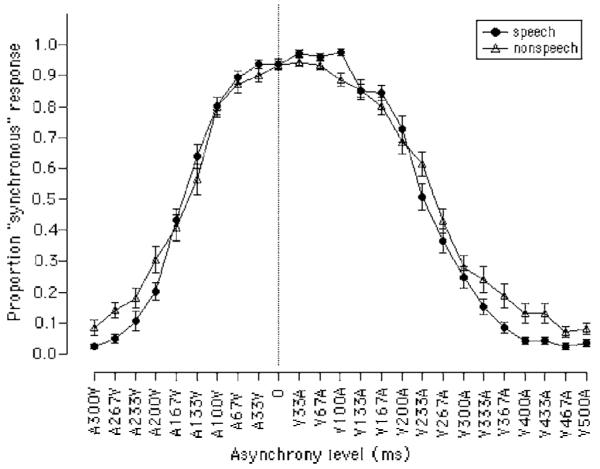
Average “synchronous” response for all participants on the AV synchrony detection task, in the speech and nonspeech conditions. The dotted vertical line is at 0-ms asynchrony. Error bars represent one standard error of the mean.
To quantify these findings and examine individual variability in the results, we fit each condition from the individual participants’ data with a Gaussian curve using Igor Pro 4.05A Carbon (copyright 1988-2002, WaveMetrics, Inc.). This analysis resulted in two curves for each participant, one for speech and one for nonspeech. The curve-fitting procedure provided estimates of the center and width of the synchrony window; from the center and width, the auditory- and visual-leading end points of the window were also calculated. The center was defined to be the mean point of synchrony (MPS), which indicated how far in ms the synchrony window was from being centered on the physically synchronous condition. For example, a MPS of 50 ms would indicate that a participant’s synchrony window was shifted from physical synchrony by 50 ms of visual lead, whereas a MPS of −50 ms would indicated that the participant’s synchrony window was shifted from physical synchrony by 50 ms of auditory lead. Although there were several possibilities for how to define the AV synchrony window’s width, here width was defined as the range of asynchronies over which subjects responded that the signals were synchronous more than half the time. This width was estimated using the full width at half maximum (FWHM) of the fitted Gaussian curve. The auditory-leading threshold was the largest amount of auditory lead at which signals were judged synchronous more than half the time. It was estimated as the MPS minus the half width at half maximum. Similarly, the visual-leading threshold was the largest amount of visual lead at which signals were judged synchronous more than half the time. It was calculated as the MPS plus the half width at half maximum. The auditory- and visual-leading thresholds are referred to as “derived” measures in the rest of the report, because they are derived from the MPS and FWHM and are not independent of those measures.
The order of presentation of the speech and nonspeech conditions did not produce any significant effects on the MPS or FWHM for either condition [speech MPS: t(28)=0.430; speech FWHM: t(28)=−0.379; nonspeech MPS: t(28)=0.226; nonspeech FWHM: t(28)=0.846; all p’s >0.05], so the speech-first and nonspeech-first participant groups were combined and analyzed together. Table II presents a summary of the MPS, FWHM, and auditory- and visual-leading threshold estimates obtained from a fit of the average response data weighted by the standard error. All statistical analyses used estimates from fitting curves to individual subject data.
TABLE II.
Curve fits for averaged responses.a
| Condition | MPS | FWHM | A-Lead | V-Lead |
|---|---|---|---|---|
| Speech | 47 (15) | 357 (61) | −131 (31) | 225 (36) |
| Nonspeech | 47 (43) | 400 (66) | −153 (46) | 247 (61) |
Standard deviations given in parentheses. All numbers are in milliseconds. Negative numbers indicate that the auditory signal led the visual signal. MPS=mean point of synchrony; FWHM=full width at half maximum; A-lead=auditory-leading threshold; V-lead=visual-leading threshold.
The distributions of the MPS and FWHM for the speech and nonspeech conditions are shown in Figs. 3 and 4, respectively. The distributions of the auditory- and visual-leading thresholds are not shown because these measures were derived directly from the MPS and FWHM.2
FIG. 3.

Distribution of MPS (top panel) and FWHM (bottom panel) measures for the speech condition of the AV synchrony detection task.
FIG. 4.

Distribution of MPS (top panel) and FWHM (bottom panel) measures for the nonspeech condition of the AV synchrony detection task.
C. Correlational analyses
Correlational analyses were performed to examine the relationship between CUNY sentence scores (A-only, V-only, and AV) and performance on the AV synchrony detection task as measured by the MPS, FWHM, and auditory- and visual-leading threshold estimates. Visual inspection of the data revealed that some of the measures, particularly for the nonspeech condition of the AV synchrony detection task, displayed skewed distributions and outliers, and so correlational analyses were performed using Spearman’s rho (rs) rank-order correlations rather than Pearson’s r correlations. Multiple regression analyses were generally redundant with the correlational analyses presented in the following because many of the measures were highly intercorrelated, so the results of regression analyses are not reported here.
1. CUNY sentences
Table III shows the bivariate correlations among the raw scores—A-only, V-only, and AV—on the CUNY sentences task. A-only and AV scores were positively correlated, rs=+0.53, p<0.01. Higher A-only scores were associated with higher AV scores. The correlations between V-only and A-only or AV scores were small and not statistically significant.
TABLE III.
Correlations among measures of AV speech perception (CUNYsentences)
| A-Only | V-Only | AV | |
|---|---|---|---|
| A-Only | … | ||
| V-Only | −0.06 | … | |
| AV | 0.53a | 0.03 | … |
p<0.01.
p<0.05.
2. AV synchrony detection
A summary of the AV synchrony detection correlations among MPS, FWHM, and auditory- and visual-leading threshold measures is given in Table IV. The FWHMs were positively correlated for the speech and nonspeech conditions, rs= +0.65, p<0.01. Larger speech synchrony windows were associated with larger nonspeech synchrony windows. Also, the MPSs were positively correlated for the speech and nonspeech conditions, rs= +0.46, p<0.01. The distance of the center of the synchrony window from physical synchrony was positively associated for the speech and nonspeech conditions.
TABLE IV.
Correlations among measures of AV synchrony detectiona
| Primary |
Derived |
|||||||
|---|---|---|---|---|---|---|---|---|
| Speech |
Nonspeech |
Speech |
Nonspeech |
|||||
| MPS | FWHM | MPS | FWHM | A-Lead | V-Lead | A-Lead | V-Lead | |
| Primary | ||||||||
| Speech | ||||||||
| MPS | … | |||||||
| FWHM | 0.18 | … | ||||||
| Nonspeech | ||||||||
| MPS | 0.46b | 0.30 | … | |||||
| FWHM | -0.04 | 0.65b | 0.24 | … | ||||
| Derived | ||||||||
| Speech | ||||||||
| A-Lead | 0.28 | -0.85b | -0.01 | -0.68b | … | |||
| V-Lead | 0.65b | 0.82b | 0.47c | 0.41c | -0.47b | … | ||
| Nonspeech | ||||||||
| A-Lead | 0.37c | -0.12 | 0.67c | -0.47c | 0.37c | 0.15 | … | |
| V-Lead | 0.35 | 0.47b | 0.81b | 0.68b | -0.31 | 0.51b | 0.17 | … |
Abbreviations as in Table II. “Derived” means derived from the MPS and FWHM, which were the “primary” measures obtained directly from the curve-fitting procedure.
p<0.01.
p<0.05.
Among the measures derived from the MPS and FWHM, the visual-leading thresholds were positively correlated for the speech and nonspeech conditions, rs= +0.50, p<0.01. Also, for the speech condition only, the auditory-leading and visual-leading thresholds of the synchrony window were negatively correlated, rs=−0.47, p<0.05. Because auditory-leading thresholds were coded as negative numbers and visual-leading thresholds were coded as positive, this finding indicates that larger (“lower”) auditory-leading thresholds were related to larger (“higher”) visual-leading thresholds. The relationship between auditory- and visual-leading thresholds was not significant for the nonspeech condition, however (rs= +0.17, p>0.05). Several of the correlations between “primary” and “derived” synchrony detection performance measures were statistically significant, although this finding may not have much practical significance because the derived measures were calculated using the primary measures and so were not statistically independent from them.
3. AV synchrony detection and CUNY sentences
Table V summarizes the intercorrelations among the AV synchrony detection and CUNY sentence measures. Several of these correlations were statistically significant. CUNY AV raw scores were negatively correlated with the FWHM for both the speech and nonspeech conditions (rs=−0.47, rs=−0.45; p<0.01, p<0.05, respectively). CUNY A-only scores were also negatively correlated with the FWHM for the nonspeech condition, rs=−0.41, p<0.05. Higher CUNY AV scores were thus associated with smaller synchrony windows, or lower tolerance for asynchrony, in both speech and nonspeech conditions. Higher A-only scores were also associated with smaller synchrony windows, but in the non-speech condition only. Finally, AV and A-only scores were positively correlated with the auditory-leading threshold for the speech condition only (rs= +0.49, rs= +0.39, respectively; p’s<0.05). This pattern indicates that higher CUNY AV and A-only scores for sentence intelligibility were associated with auditory-leading thresholds that were closer to physical synchrony.
TABLE V.
Correlations among measures of AV synchrony detection and AV speech perceptiona
| CUNY sentences |
|||
|---|---|---|---|
| Synchrony Detection | A−Only | V−Only | AV |
| Primary | |||
| Speech | |||
| MPS | 0.10 | −0.29 | 0.08 |
| FWHM | −0.31 | −0.04 | −0.47b |
| Nonspeech | |||
| MPS | −0.12 | −0.17 | −0.09 |
| FWHM | −0.41c | 0.20 | −0.45b |
| Derived | |||
| Speech | |||
| A−Lead | 0.39c | −0.14 | 0.49b |
| V−Lead | −0.10 | −0.15 | −0.31 |
| Nonspeech | |||
| A−Lead | 0.14 | −0.17 | 0.21 |
| V−lead | −0.31 | 0.14 | −0.14 |
Abbreviations as in previous tables.
p<0.01.
p<0.05.
IV. DISCUSSION
The results of this study demonstrate relationships between measures of AV sentence intelligibility and the ability to detect AV synchrony in both speech and nonspeech signals. First, significant within-participant correlations were found between AV synchrony detection for speech and non-speech signals. In addition, participants who obtained higher AV sentence intelligibility scores tended to have smaller windows over which they identified AV signals—either speech or nonspeech—as synchronous and thus were better at detecting small differences in the relative timing between auditory and visual signals.
Similar to Grant and Seitz (1998), who did not find a relationship between V-only speech perception scores and the effect of AV asynchrony on speech perception, the present study failed to find a relationship between V-only speech perception scores and AV synchrony detection. However, the present results are consistent on the whole with previous findings reported in the literature that AV synchrony perception for speech is correlated with some measures of AV speech perception ability (Grant and Seitz; McGrath and Summerfield, 1985). The present study used TRS to degrade the auditory signal, rather than more ecologically valid degradations such as noise that were used in previous studies. The TRS manipulation may have encouraged different strategies of integration than are typically employed when perceiving AV speech, which could potentially have strengthened the association between speech perception scores and the synchrony detection for nonspeech signals. Although this issue deserves further investigation, the present results for synchrony detection in speech signals are quite similar to previous results obtained with other forms of auditory degradation. In addition, the similarity of synchrony windows for our speech and nonspeech signals, which is independent of the auditory degradation used for the sentences, suggests that our findings linking speech perception scores with synchrony detection in nonspeech signals would hold for other forms of auditory degradation as well.
The present findings suggest new avenues of inquiry into the relationship between AV synchrony perception for nonspeech signals and AV speech perception abilities. Specifically, because AV speech perception ability is related to AV synchrony detection for both speech and nonspeech signals, it may be necessary to further examine variability in perceptual and cognitive mechanisms that are not specific to speech—such as sensory processing, perceptual learning, and auditory and visual attention—for further insights into individual differences in AV speech perception ability. In addition, future work examining the neural bases of the temporal integration of AV speech may also want to consider including nonspeech conditions to analyze the contribution of neural areas or mechanisms not specific to AV speech integration. Finally, the directionality of the link between explicit AV synchrony detection and speech perception should be further explored to determine for theoretical and clinical reasons whether explicit training in either synchrony detection or speech perception under degraded conditions affects performance on the other task.
Although some measures of AV synchrony detection for both speech and nonspeech signals were significantly correlated with AV speech perception measures, the positive correlation of A-only and AV scores with auditory-leading thresholds that were closer to physical synchrony was observed only for the speech and not the nonspeech signals. This result suggests that subjects who performed better on AV sentence intelligibility measures were more accurate at identifying the asynchrony in auditory-leading speech, but not in auditory-leading nonspeech signals. Long-term perceptual learning and experience may underlie this finding. A recent report suggests that after adaptation to asynchronous auditory- or visual-leading signals, AV synchrony judgments for simple nonspeech stimuli are recalibrated in the direction of the adapted asynchrony (Fujisaki et al., 2004). Perhaps consistent exposure to speech signals, in which visual articulatory motion often precedes the production of sound, causes long-term adaptation effects so that participants who are better at integrating auditory and visual information in speech perception are also able to more easily recognize the unnatural situation in which auditory speech precedes visual speech. On the other hand, the lack of expectations about which signal should lead in the nonspeech signal condition may have prevented the use of naturally occurring cues in that condition.
In conclusion, the positive correlations between AV synchrony detection measures for speech and nonspeech signals suggest that the asynchrony detection for the two types of signals may rely on some common properties of multisensory processing. Furthermore, the finding that accuracy at detecting AV synchrony in unfamiliar, semantically meaningless nonspeech signals is positively correlated with AV speech perception measures suggests that variation in AV speech perception abilities may be affected, in part, by variation in domain-general multisensory processing. In future studies it will be necessary to examine in greater detail the relationship between general multisensory processing and multisensory processing for speech signals, including the extent to which they engage shared neural mechanisms.
ACKNOWLEDGMENTS
This work was supported by NIH NIDCD R01 Research Grant No. DC00111 and NIH NIDCD T32 Training Grant No. DC00012. The first author was also supported by an Indiana University Chancellor’s Fellowship and an NSF Graduate Research Fellowship. The authors would like to thank Luis Hernandez for technical support and Sara Phillips and Angelique Horace for help with data collection. We also thank Ken Grant and the two anonymous reviewers for their helpful comments. We gratefully acknowledge the audience at the 2003 Audio-Visual Speech Processing workshop for their valuable suggestions on a preliminary version of this work.
Footnotes
It was not of interest here to determine whether the speech and nonspeech synchrony windows had precisely the same parameters, because these can be expected to vary somewhat based on the particular stimuli employed; rather, the relationships among the parameters were examined here.
An earlier study (Conrey and Pisoni, 2003) reported smaller synchrony windows for words with high versus low visual-only intelligibility; subsequent and more detailed analyses, however, indicated large item-by-item differences that were not always related to visual-only intelligibility.
PACS number(s): 43.71.Rt [KWG]
References
- Boothroyd A, Hanin L, Hnath T. Speech and Hearing Science Report No. RC110. City University of New York; 1985. A sentence test of speech perception: Reliability, set equivalence, and short term learning. [Google Scholar]
- Bushara KO, Grafman J, Hallett M. Neural correlates of auditory-visual stimulus onset asynchrony detection. J. Neurosci. 2001;21(1):300–304. doi: 10.1523/JNEUROSCI.21-01-00300.2001. [DOI] [PMC free article] [PubMed] [Google Scholar]
- Cohen JD, MacWhinney B, Flatt M, Provost J. PsyScope: A new graphic interactive environment for designing psychology experiments. Behav. Res. Methods Instrum. Comput. 1993;25(2):257–271. [Google Scholar]
- Conrey B, Pisoni DB. Audiovisual asynchrony detection for speech and nonspeech signals; paper presented at the ISCA 2003 International Conference on Auditory-Visual Speech Processing; 2003. [Google Scholar]
- Dixon N, Spitz L. The detection of audiovisual desynchrony. Perception. 1980;9:719–721. doi: 10.1068/p090719. [DOI] [PubMed] [Google Scholar]
- Fujisaki W, Shinsuke S, Kashino M, Nishida S. Recalibration of audiovisual simultaneity. Nat. Neurosci. 2004;7:773–778. doi: 10.1038/nn1268. [DOI] [PubMed] [Google Scholar]
- Grant KW, Greenberg S. Speech intelligibility derived from asynchronous processing of auditory-visual information; paper presented at the ISCA International Conference on Auditory-Visual Speech Processing; 2001. [Google Scholar]
- Grant KW, Seitz PF. Measures of auditory-visual integration in nonsense syllables and sentences. J. Acoust. Soc. Am. 1998;104:2438–2450. doi: 10.1121/1.423751. [DOI] [PubMed] [Google Scholar]
- Grant KW, van Wassenhove V, Poeppel D. Discrimination of auditory-visual synchrony; paper presented at the ISCA 2003 International Conference on Auditory-Visual Speech Processing; 2003. [Google Scholar]
- King AJ, Palmer AR. Integration of visual and auditory information in bimodal neurones in the guinea-pig superior colliculus. Exp. Brain Res. 1985;60:492–500. doi: 10.1007/BF00236934. [DOI] [PubMed] [Google Scholar]
- Lachs L. Research on Spoken Language Processing Progress Report No. 23. Speech Research Laboratory, Indiana University; Bloomington, IN: 1999. Use of partial stimulus information in spoken word recognition without auditory stimulation; pp. 82–114. [Google Scholar]
- Lachs L, Hernandez LR. Research on Spoken Language Processing Progress Report No. 22. Speech Research Laboratory, Indiana University; Bloomington, IN: 1998. Update: The Hoosier Audiovisual Multitalker Database; pp. 377–388. [Google Scholar]
- Lachs L, Pisoni DB. Crossmodal source identification in speech perception. Ecological Psychol. 2004a;16:159–187. doi: 10.1207/s15326969eco1603_1. [DOI] [PMC free article] [PubMed] [Google Scholar]
- Lachs L, Pisoni DB. Crossmodal source information and spoken word recognition. J. Exp. Psychol. Hum. Percept. Perform. 2004b;30(2):378–396. doi: 10.1037/0096-1523.30.2.378. [DOI] [PMC free article] [PubMed] [Google Scholar]
- Lewkowicz DJ. Perception of auditory-visual temporal synchrony in human infants. J. Exp. Psychol. Hum. Percept. Perform. 1996;22:1094–1106. doi: 10.1037//0096-1523.22.5.1094. [DOI] [PubMed] [Google Scholar]
- Massaro D, Cohen M. Perceiving asynchronous bimodal speech in consonant-vowel and vowel syllables. Speech Commun. 1993;13:127–134. [Google Scholar]
- Massaro D, Cohen MM, Smeele PMT. Perception of asynchronous and conflicting visual and auditory speech. J. Acoust. Soc. Am. 1996;100(3):1777–1786. doi: 10.1121/1.417342. [DOI] [PubMed] [Google Scholar]
- McGrath M, Summerfield Q. Intermodal timing relations and audio-visual speech recognition by normal-hearing adults. J. Acoust. Soc. Am. 1985;77(2):678–684. doi: 10.1121/1.392336. [DOI] [PubMed] [Google Scholar]
- Meredith MA. On the neuronal basis for multisensory convergence: A brief overview. Cognit. Brain Res. 2002;14:31–40. doi: 10.1016/s0926-6410(02)00059-9. [DOI] [PubMed] [Google Scholar]
- Meredith MA, Nemitz JW, Stein BE. Determinants of multisensory integration in superior colliculus neurons. I. Temporal factors. J. Neurosci. 1987;7(10):3215–3229. doi: 10.1523/JNEUROSCI.07-10-03215.1987. [DOI] [PMC free article] [PubMed] [Google Scholar]
- Munhall KG, Gribble P, Sacco L, Ward M. Temporal constraints on the McGurk effect. Percept. Psychophys. 1996;58(3):351–362. doi: 10.3758/bf03206811. [DOI] [PubMed] [Google Scholar]
- Pandey CP, Kunov H, Abel MS. Disruptive effects of auditory signal delay on speech perception with lip-reading. J. Aud. Res. 1986;26:27–41. [PubMed] [Google Scholar]
- Saberi K, Perrott DR. Cognitive restoration of reversed speech. Nature (London) 1999;398:760. doi: 10.1038/19652. [DOI] [PubMed] [Google Scholar]
- Sheffert SM, Lachs L, Hernandez LR. Research on Spoken Language Processing Progress Report No. 21. Speech Research Laboratory, Indiana University; Bloomington, IN: 1996. The Hoosier Audiovisual Multitalker Database; pp. 578–583. [Google Scholar]
- Stein B, Meredith MA. The Merging of the Senses. MIT; Cambridge, MA: 1993. [Google Scholar]
- Stone JV, Hunkin NM, Porrill J, Wood R, Keeler V, Beanland M, et al. When is now? Perception of simultaneity. Proc. R. Soc. London, Ser. B. 2001;268:31–38. doi: 10.1098/rspb.2000.1326. [DOI] [PMC free article] [PubMed] [Google Scholar]
- van Wassenhove V, Grant KW, Poeppel D. Temporal integration in the McGurk effect; poster presented at the annual meeting of the Society for Cognitive Neuroscience; San Francisco. 2002. [Google Scholar]