

Abstract
Aurora A is critical for mitosis and is overexpressed in several neoplasms. Its overexpression transforms cultured cells, and both its overexpression and knockdown cause genomic instability. In transgenic mice, Aurora A haploinsufficiency, not overexpression, leads to increased malignant tumor formation. Aurora A thus appears to have both tumor-promoting and tumor-suppressor functions. Here, we report that Aurora A protein, measured by quantitative western blotting, is differentially expressed in major glioma types in lineage-specific patterns. Aurora A protein levels in WHO grade II oligodendrogliomas (n = 16) and grade III anaplastic oligodendrogliomas (n = 16) are generally low, similar to control epilepsy cerebral tissue (n = 11). In contrast, pilocytic astrocytomas (n = 6) and ependymomas (n = 12) express high Aurora A levels. Among grade II to grade III astrocytomas (n = 7, n = 14, respectively) and grade IV glioblastomas (n = 31), Aurora A protein increases with increasing tumor grade. We also found that Aurora A expression is induced by hypoxia in cultured glioblastoma cells and is overexpressed in hypoxic regions of glioblastoma tumors. Retrospective Kaplan-Meier analysis revealed that both lower Aurora A protein measured by quantitative western blot (n = 31) and Aurora A mRNA levels measured by real-time quantitative RT-PCR (n = 58) are significantly associated with poorer patient survival in glioblastoma. Furthermore, we report that the selective Aurora A inhibitor MLN8237 is potently cytotoxic to glioblastoma cells, and that MLN8237 cytotoxicty is potentiated by ionizing radiation. MLN8237 also appeared to induce senescence and differentiation of glioblastoma cells. Thus, in addition to being significantly associated with survival in glioblastoma, Aurora A is a potential new drug target for the treatment of glioblastoma and possibly other glial neoplasms.
Key words: Aurora A, glioblastoma, MLN8237, differential expression, patient survival, radiation, diffuse astrocytoma, oligodendroglioma, ependymoma, pilocytic astrocytoma
Aurora A (STK-15) is a serine-threonine kinase critical for mitosis involved in centrosome duplication, mitotic entry, spindle assembly and sister chromatid segregation.1–4 In addition, Aurora A positively regulates several key components of pro-proliferate signaling pathways, including c-Myc, n-Myc, NFκB, β-catenin and cyclin B1.5–10
Transcription of Aurora A is induced by E2F3 in early S phase, and its protein expression peaks during G2/M.11 Aurora A transcription may also be induced by E4TF1,12 hypoxia-inducible factor-1α (HIF-1α),13 and c-Myc upstream of the cyclin-dependent kinase/pRb/E2F pathway.14 Aurora A protein regulation is complex. It is degraded by the 26S proteasome during anaphase following its ubiquitination by the anaphase promoting complex/cyclosome E3 ubiquitin ligase (APC/C),15 but is also ubiquitinated by the skp/cullin/Fbw7 E3 ligase (SCFFbw7) and the checkpoint with fork-head associated and ring finger E3 ligase (CHFR).10,16–18 Thus, Aurora A is highly regulated at the protein level.
Aurora A overexpression transforms cells in vitro. Both its overexpression and knockdown cause the formation of abnormal mitotic spindles, tetraploidy and aneuploidy,1,19–22 i.e., genomic instability, which is thought to be an important mechanism of progression to malignancy.20,23–25 Aurora A is overexpressed in several human neoplasms including breast, urogenital, hematolymphoid and CNS lesions.19,26–35 Although the Aurora A gene is amplified in approximately 26 to 31% of adult gliomas, Aurora A overexpression in gliomas also occurs in the absence of gene amplification.31,32
Conditional Aurora A overexpression in transgenic mice leads to precancerous breast, pancreatic and liver lesions (hyperplasia, dysplasia and adenomas) but generally not malignant tumors.36–40 Aurora A knockout is embryologically lethal; however, its haploinsufficiency results in a 3-fold higher incidence of malignant tumor formation, consistent with it having a tumor suppressor function.40 Aurora A overexpression may thus contribute to the development of a hyperproliferative state in early neoplastic transformation, and its subsequent over- or underexpression (loss of tumor suppressor function) may lead to tumor progression by generating further genomic instability.
Several pharmaceutical companies have developed Aurora kinase inhibitors, which have shown activity against hematolymphoid neoplasms and solid tumors in preclinical studies and early clinical trials.41–51 Most inhibit both Aurora A and Aurora B, a related kinase important in centrosome function. Millennium Pharmaceuticals, Inc. has introduced the selective Aurora A inhibitor MLN8237 that readily crosses the blood brain barrier and acts as a specific Aurora A inhibitor at concentrations lower than and equal to the maximally tolerated dose in animal models and phase I clinical trials.47–51
Here we demonstrate that Aurora A protein is differentially expressed in major histopathological types of human glial tumors, that its expression is induced by hypoxia in glioblastoma cells, and that both decreased Aurora A protein and decreased Aurora A mRNA levels are associated with poorer patient survival in glioblastoma. We also show that the selective Aurora A inhibitor MLN8237 is potently cytotoxic to glioblastoma cells and is potentiated by ionizing radiation.
Results
Aurora A protein expression in gliomas.
Western blot analysis of glial tumor lysates revealed that Aurora A was variably expressed by up to approximately 106-fold (Fig. 1A and Table 1). Aurora A is generally highly expressed in ependymomas (n = 12) and pilocytic astrocytomas (n = 6) as compared with control cerebral tissue from non-tumor epilepsy resections (n = 11) (p = 0.0028 and p = 0.0096, respectively) (Table 2). Aurora A protein was incrementally expressed from relatively low to relatively high levels in WHO grade II diffuse astrocytomas and grade III anaplastic astrocytomas through grade IV glioblastomas (Fig. 1B and Table 1). In contrast, both WHO grade II oligodendrogliomas and grade III anaplastic oligodendrogliomas showed Aurora A protein levels comparable to or lower than control epilepsy tissue, although, some individual anaplastic oligodendrogliomas expressed Aurora A at levels higher than the mean and maximal control levels (up to approximately 4.7- and 2.5-fold higher, respectively) (Table 1). In glioblastomas Aurora A protein expression was generally high, on average 5.5-fold higher than controls (p = 0.004), but varied by up to 80-fold. Mean Aurora A protein expression was higher in ependymomas compared with glioblastomas, but the range of expression was similar in both tumors. Among the tumor types examined, pilocytic astrocytomas showed the highest mean levels of Aurora A protein, approximately 14.7-fold higher than mean control tissue levels (p = 0.0096), although maximal levels were similar among pilocytic astrocytomas and glioblastomas (Table 1). A few control samples showed increased Aurora A levels, although they were low compared with highly expressing tumors. This may be attributable to hypoxic and reactive changes present in some epilepsy specimens, as reactive astrocytes were observed to be Aurora A positive by immunohistochemistry.
Figure 1.

Aurora A shows variable protein expression in gliomas. (A) Example Aurora A quantitative western blots in patient glioma samples (Diffuse A, diffuse astrocytoma WHO grade II; anaplastic astrocytoma grade III; Anaplastic Oligo, anaplastic oligodendroma grade III; ependymoma grade I–III; Pilocytic A, pilocytic astrocytoma grade I). Summarized quantitative data and individual quantitative data for all samples are presented in Tables 1 and S1, respectively. (B) Relative Aurora A protein expression in glioma histopathological types. Mean Aurora A levels from quantitative western blotting are shown for each group in relative units ± SD. The protein expression range for each group is depicted in dashed error bars. Related glioma diagnostic groups are color coded. DA, diffuse astrocytoma; AA, anaplastic astrocytoma; GBM, glioblastoma; OL, oligodendroglioma; AO, anaplastic oligodendroglioma; PA, pilocytic astrocytoma; EPN, ependymoma.
Table 1.
Summary of Aurora A protein expression in patient glioma samples
| Group | N | Mean | SD | Min | Max |
| Control | 11 | 0.045 | 0.030 | 0.007 | 0.085 |
| OL II | 16 | 0.017 | 0.018 | 0.000 | 0.060 |
| DA II | 7 | 0.017 | 0.021 | 0.000 | 0.050 |
| AO III | 16 | 0.047 | 0.048 | 0.012 | 0.210 |
| AA III | 14 | 0.153 | 0.210 | 0.019 | 0.815 |
| GBM IV | 31 | 0.246 | 0.276 | 0.015 | 1.169 |
| EPN I–III | 12 | 0.417 | 0.336 | 0.011 | 0.894 |
| PA I | 6 | 0.662 | 0.372 | 0.214 | 1.079 |
Means, standard deviations and ranges for Aurora A/β-actin ratios are shown for each diagnostic group. Abbreviations: DA, diffuse astrocytoma; AA, anaplastic astrocytoma; GBM, glioblastoma; OL, oligodendroglioma; AO, anaplastic oligodendroglioma; PA, pilocytic astrocytoma; EPN, ependymoma. Corresponding WHO grades are listed after tumor abbreviations.
Table 2.
p-Values for pair-wise comparisons of Aurora A protein expression between different glioma histopathological types
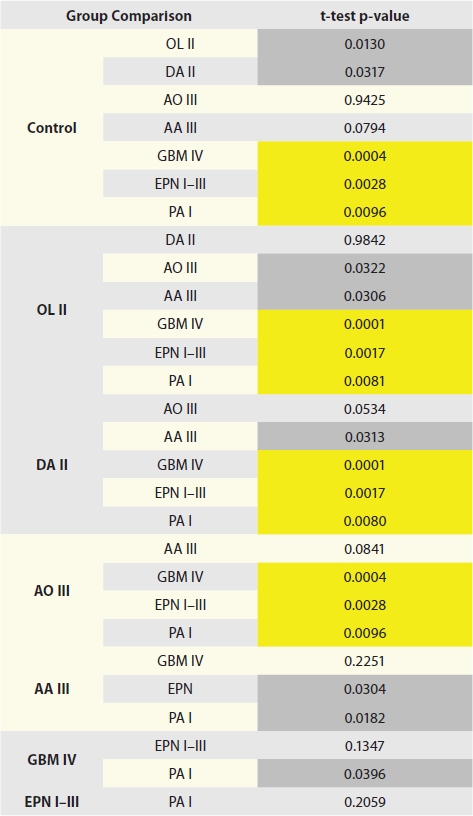 |
Abbreviations: DA, diffuse astrocytoma; AA, anaplastic astrocytoma; GBM, glioblastoma; OL, oligodendroglioma; AO, anaplastic oligodendroglioma; PA, pilocytic astrocytoma; EPN, ependymoma. Corresponding WHO grades are listed after tumor abbreviations. Due to the large number of comparisons, p-values less than 0.01 (shaded yellow) are considered significant. p-values between 0.05 and 0.01 (shaded gray) are considered borderline.
Aurora A mRNA is variably expressed in glioblastoma.
We next examined Aurora A mRNA expression in glioblastoma using real-time RT-PCR in 58 glioblastomas and found it to vary by up to about 35-fold (Fig. S1A). Data for both Aurora A protein and message expression were available for nine glioblastomas. RT-PCR message data showed moderate correlation with protein levels with a Pearson correlation coefficient of r = 0.72 [95% CI (0.11, 0.94), p = 0.0279] (Fig. S1B).
Aurora A expression weakly correlates with proliferation index in glioblastoma.
Ki-67 is expressed in cycling cells and is used clinically as a measure of the proliferation index in gliomas and other neoplasms. We compared Ki-67 labeling index as determined by immunochemistry to Aurora A message expression from our RT-PCR data set. Aurora A mRNA expression showed only weak correlation with Ki-67 labeling index. The Pearson correlation coefficient for Ki-67 and Aurora A ΔΔCt (fold change compared with 10 control epilepsy specimens) for glioblastoma samples (n = 55) was only r = 0.28 [95% CI: (0.016, 0.51), p = 0.0385], indicating that Aurora A expression does not necessarily parallel the proliferation rate (Fig. 2A). This low level of correlation is not surprising considering that pilocytic astrocytomas, which generally have very low Ki-67 labeling indices of 1% or less, expressed Aurora A protein at very high levels (Fig. 1A and Table 1).
Figure 2.

Correlates of Aurora A expression in glioblastoma. (A) Aurora A mRNA expression by RT-PCR (ΔΔCt) shows only weak correlation with Ki-67 proliferation index (r = 0.28). (B) Hypoxia induces Aurora A expression in U87 glioblastoma cells. The example western blot depicts maximal Aurora A protein expression after 3 hr of hypoxia coinciding with that of HIF-1α. Western blot signals are quantified in the bar graph. Mean ratios of Aurora A or HIF-1α protein normalized to actin over that found in 0 h non-hypoxic cultures are shown ± SEM. The dashed line indicates basal non-hypoxic expression. (C) Aurora A immunohistochemical staining in gliomas. WHO grade I ependymoma (myxopapillary ependymoma) (a) and grade I pilocytic astrocytoma (b) demonstrate strong nuclear staining for Aurora A. In the latter, eosinophillic granular bodies show weak nonspecific staining (arrow). An oligodendroglioma shows little Aurora A immunopositivity (c). In glioblastoma, the strongest Aurora A staining is in hypoxic areas of tumors. Anti-Aurora A antibody highlights pseudopalisading cells around necrosis (d and e) more intensely than in non-necrotic areas of tumor (f). Strong Aurora A staining is also observed in islands of viable tumor cells surrounded by necrosis (g), in cells surrounding microvascular proliferation (h) and of endothelial cells of small new vessels (arrows) within the tumor (i). Original magnifications: (a and b) 200x; (c and e–h) 100x; (d) 40x; and (i) 150x.
Aurora A expression is induced by hypoxia in glioblastomas.
Because Aurora A transcription can be induced by HIF-1α in cultured HepG2 hepatoma cells,13 we asked if this was also the case in glioblastomas. We queried the Cancer Genome Atlas (TCGA) glioblastoma gene microarray databank encompassing three Aurora A probes52 (although probe 208080 did not give consistent results and is not included in the following discussion) for correlations between Aurora A and HIF-1α, vascular endothelial growth factor (VEGF), c-Myc and E2F transcription factors (Table 3).
Table 3.
Correlation of Aurora A and E2F, HIF-1α, VEGF and c-Myc expression data for glioblastomas in the TCGA cDNA microarray database
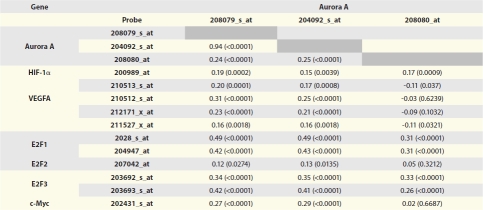 |
Data for the dominant VEGF transcript VEGF-A is shown.
We found a relatively low correlation of HIF-1α expression with Aurora A (Pearson correlation coefficient r = 0.15 to 0.20). HIF-1α's transcriptional target VEGF, however, showed somewhat stronger correlation with Aurora A expression in glioblastomas (r = 0.16 to 0.31). c-Myc correlation with Aurora A was r = 0.27 and r = 0.29 (Table 3). E2F-1 and E2F-3, the latter known to target Aurora A transcription,11 more strongly correlated with Aurora A expression, with Pearson correlation coefficients of r = 0.42 to 0.49 and r = 0.34 to 0.42, respectively across two of the three microarray Aurora A probes (Table 3). E2F-2 expression showed only poor correlation with Aurora A (r = 0.12 to 0.13). The E2F-1 and E2F-3 correlation coefficients are high for microarray data and strongly suggest that the Aurora A promoter is a target of both transcription factors. The similar correlation of Aurora A expression with VEGF compared with that of Aurora A with E2F-1 and E2F-3 may suggest that upregulation of Aurora A by HIF-1α is almost as strong as is its cell cycle-specific induction by E2Fs or, alternately, may be attributable to Aurora A's effect of inducing c-Myc, which both Aurora A and VEGF are also transcriptional targets of.53,54
To empirically test Aurora A induction by hypoxia in glioblastomas, we cultured U87 glioblastoma cells for various lengths of time in a hypoxia chamber in the presence of 1% oxygen. We found increasing Aurora A protein levels with time during oxygen deprivation by western blot, peaking after 3 to 6 hr (n = 3). This coincided with HIF-1α levels, also peaking at 3 to 6 hr (n = 3) but, on average, peaking before Aurora A (Fig. 2B). The average expression difference from control non-hypoxic cultures was statistically significant for HIF-1α after 3 hr of hypoxia (p = 0.0239), of borderline significance for Aurora A after 3 hr (p = 0.0531) and significant for Aurora A after 6 hr of hypoxia (p = 0.0038) (Fig. 2B, lower part). Examination of Aurora A by immunohistochemical staining in glioblastoma tissue sections frequently revealed increased tumor cell nuclear staining within areas of tumor correlating with hypoxia in vivo, i.e., pseudopalisading necrosis and microvascular endothelial cell hypertrophy and hyperplasia (Fig. 2C).
Aurora A expression correlates with patient survival in glioblastoma.
Cox regression was used to assess the relationship between Aurora A protein expression and survival in each glioma diagnostic class. To visualize this data, we divided each diagnostic group by its median Aurora A protein expression level and plotted the corresponding Kaplan-Meier curves.
When Aurora A protein expression was considered in individual tumor types, greater Aurora A appeared to correlate with decreased survival in pilocytic astrocytomas, ependymomas, grade II diffuse astrocytomas and grade II oligodendrogliomas. These findings were not statistically significant, however, and are limited by relatively few patients in each of these diagnostic groups (Fig. S2A, B, D and E). Surprisingly, in grade III anaplastic astrocytomas and grade III anaplastic oligodendrogliomas, lower not higher Aurora A protein expression appeared to predict poorer patient response; however, these relationships were also not statistically significant (p = 0.573 and 0.321, respectively) (Fig. S2C and F).
Among glioblastoma patients, however, both low Aurora A protein and low Aurora A mRNA expression significantly correlated with poorer patient survival (Kapaln-Meier log rank p = 0.0326 and 0.0066, respectively (Fig. 3A and B)). Used continuously, increasing Aurora A mRNA expression showed improved risk (Cox regression hazard ratio of 0.935, p = 0.0119), but this was less apparent for Aurora A protein (hazard ratio of 0.345, p = 0.40).
Figure 3.

Lower Aurora A expression predicts decreased survival in glioblastoma patients. (A) Aurora A protein and (B) Aurora A mRNA levels below median expression correlate with decreased patient survival. (C) Higher Aurora A protein expression predicts decreased survival when all adult-type gliomas are considered as a group, reflecting higher Aurora A levels in higher-grade tumors.
The Aurora A inhibitor MLN 8237 is potently cytotoxic to glioblastoma cell lines.
We used clonogenic assays to examine the cytotoxcity of a 24 hr exposure of the selective Aurora A inhibitor MLN8237 in glioblastoma cells. An example clonogenic assay is depicted in Figure S3. MLN8237 IC50 values in 10 glioma cell lines ranged from 60 nM to 225 nM with an average value of 108.5 nM (Figs. 4A, B and 5A). Of interest, low-passage cell lines derived from patient tumors (HF2303, HF2359 and HF2414) were more susceptible to Aurora A inhibition compared with high-passage established glioma cell lines (U87, T98, U251, A172, LN18, LN443 and HF66).
Figure 4.

(A) MLN8237 is potently cytotoxic in glioblastoma cells. (A) Primary low-passage and established glioma cell lines were treated with MLN8237 for 24 hr, and colony formation was scored 7 d later. Mean percent survival (3 replicates) ± SEM is shown. (B) Corresponding mean IC50 values are shown. (C) MLN8237 induces senescence and differentiation of U87 glioma cells. Cells were treated with 400 nM MLN8237 for 48 hr and Giemsa stained. Untreated cells imaged at the same magnification and from the same experiment are shown as a control.
Figure 5.

Optimization of MLN8237 cytotoxicity. (A) Optimal MLN8237 cytotoxicity requires 72 to 96 hr drug exposure in glioblastoma cells. Mean percent survival (three replicate dishes) ± SEM is shown. Straight perpendicular lines illustrate IC50 values. (B) MLN8237 potentiates the effects of gamma radiation in glioblastoma cell cultures. Cells were irradiated with 2 Gy (blue bars) or 4 Gy alone (red bars), treated with 50 nM (checkered bars) or 150 nM (black center bars) MLN8237 for 48 hr only, or subsequently irradiated with 2 Gy (checked bars with blue shading) or 4 Gy (black center bars with red shading). After treatments, cells were replated for colony-formation assays. Mean percent survival (3 replicates) ±SEM is shown.
MLN8237 begins to have significant inhibitory activity against Aurora B at approximately 300 to 400 nM (Jeffrey Ecsedy, personal communication). After a 24 hr exposure to MLN8237, concentrations well above this threshold were required for high levels of cytotoxicity, i.e., IC99's or more (Fig. 4A). Since acute inhibition of Aurora A would most affect its mitotic functions, it is not surprising that complete toxicity would require more than 24 hr of exposure to allow for cells of variable cell cycle duration times and in various parts of the cell cycle to reach mitosis, as observed for S phase-specific anti-proliferative drugs.55 We therefore measured MLN8237 cytotoxicity at drug exposure times ranging from 24 to 96 hr. IC99 values were achieved at much lower MLN8237 concentrations of 200 to 400 nM when cells were exposed to drug for 72 to 96 hr (Fig. 5A). In contrast, MLN8237 IC50 values were relatively constant from 24 to 96 hr.
As observed for other cell types,22 potent Aurora A inhibition resulted in increased numbers of binucleated and multinucleated cells and senescent cell morphology with markedly increased cytoplasm (Fig. 4C). Large multinucleated cells as seen for HF2303 (middle and lower right) are frequently observed in glioblastomas and are often non-cycling.56 There was also morphological evidence of cellular differentiation upon MLN8237 treatment, with the appearance of mature astrocyte-like glial processes.
MLN 8237 cytotoxicity is potentiated by gamma radiation in glioblastoma cells.
Aurora A inhibition and knockdown has previously been shown to sensitize cancer cells to ionizing radiation.57 We therefore examined the effects of MLN8237 on radiation sensitivity in glioblastoma cells in vitro. We exposed U87 cells and HF2303, HF2359 and HF2414 primary glioblastoma cells to 50 and 150 nM MLN8237 for 48 hr and then irradiated the cultures with 2 or 4 Gy. MLN8237 substantially potentiated the effects of radiation alone compared with glioblastoma cells not treated with the drug (Fig. 5B). Significant positive interaction effects from two-way ANOVA were observed for all four glioblastoma cell lines (U87, p = 0.0009; HF2303, p < 0.0001; HF2359, p < 0.0001; and HF2414, p = 0.0087), demonstrating that the combined effect of the two treatments is greater than their expected summed result, supporting a synergistic effect in each case.
Discussion
Previous studies have demonstrated overexpression of Aurora A in several human neoplasms, including gliomas.19,26–35 We found that in WHO grade II diffuse astrocytomas, grade III anaplastic astrocytomas and grade IV glioblastomas, mean Aurora A protein expression increases with increasing tumor grade. Consistent with these findings, analysis of the Repository for Molecular Brain Neoplasia Data (Rembrandt) mRNA database reveals lower Aurora A message expression in lower-grade astrocytomas compared with glioblastomas.58 This general pattern of Aurora A mRNA expression in low-grade astrocytomas and glioblastomas was also reported by Klein et al.32
In grade II oligodendrogliomas, Aurora A protein was expressed at relatively low levels similar to average levels in control cerebral tissue. Although still low, Aurora A protein was more highly expressed in grade III anaplastic oligodendrogliomas compared with grade II oligodendrogliomas.
The highest mean Aurora A protein levels were observed in grade I pilocytic astrocytomas followed by grade I to III ependymomas. Pilocytic astrocytomas appear to be more phylogenically related to ependymomas than other astrocytomas,59 consistent with the high levels of Aurora A found among these two tumor types. That high Aurora A levels in these related, generally low-grade tumors compared with much lower levels in other low-grade gliomas, i.e., diffuse astrocytomas and oligodendrogliomas, strongly suggests that Aurora A expression patterns in gliomas are tumor cell lineage-specific. This is not surprising, since Aurora A expression is controlled by several transcriptional and posttranscriptional mechanisms,10–18 which may be more or less dominant in different tumor types. It is also notable that unlike other low-grade glial tumors, e.g., diffuse astrocytomas and low-grade oligodendrogliomas, pilocytic astrocytomas are highly vascular tumors, and upregulation of vasculogenic signaly pathways may account for high Aurora A levels in these tumors.
In certain precancerous lesions, cancers and primitive neuroectodermal tumors (neuroblastomas and medulloblastomas), Aurora A overexpression appears to coincide with progression from lower- to higher-grade lesions and/or poorer prognosis.29–35 Consistent with this, we found increasing average Aurora A levels with increasing tumor grade among the biologically related grade II diffuse astrocytomas to grade III anaplastic astrocytomas to grade IV glioblastomas. The fact that Aurora A is inducible by hypoxia in high-grade glioma cells also supports it having a role in glioma progression, as angiogenesis is considered important in the biological progression of gliomas.60 Indeed, Aurora A protein levels correlated with decreased survival in adult-type gliomas as a group (excluding pilocytic astrocytomas and ependymomas, which more commonly present in children and younger adults); however, this was not quite statistically significant (Fig. 3C).
In contrast to studies in some non-glial neoplasms and our observations in adult-type gliomas as a group, when we only considered adult primary glioblastomas, we found that lower Aurora A protein and mRNA expression were significantly associated with shorter patient survival. We also observed this trend in other high-grade gliomas, namely, anaplastic astocytomas and anaplastic oligodendrogliomas, although these relationships were not statistically significant.
Why did we find that both decreased Aurora A mRNA and protein expression are associated with poorer survival in glioblastoma, while other studies implicate increased Aurora A expression with more clinically aggressive neoplasms? There are likely fundamental molecular differences driving tumor progression and clinical aggressiveness between carcinomas and pediatric primitive neural ectodermal tumors, e.g., neuroblastoma and medulloblastoma, compared with adult high-grade astrocytomas. Many studies have simply correlated Aurora A expression with tumor histological grade and not clinical outcomes.26–28,31–33 Additionally, our findings are based on highly quantitative methods, while other studies linking Aurora A overexpression with patient survival are based either on conventional immunohistochemical staining of tumor sections29,34 or cDNA array mRNA analysis of tumor samples.29,35 In standard immunohistochemical analysis, protein expression levels can be determined only in a crude semiquantitative manner, and underexpression is rarely addressed.
In contrast to our findings, Barton et al. found a significant correlation between higher Aurora A expression and shorter patient survival in high-grade gliomas using a cDNA microarray.35 By comparison, that study included only 23 patients in its Kaplan-Meier analysis and comprised of a mixture of pediatric anaplastic astrocytomas, primary pediatric glioblastomas, radiation-induced pediatric glioblastomas and adult glioblastomas, which were, therefore, not very biologically comparable tumors. It is also notable that quantitative RT-PCR has a greater dynamic range of mRNA level detection compared with cDNA microarrays. RT-PCR is considered the gold standard for measuring mRNA in clinical samples, and microarray data does not always correlate well with corresponding RT-PCR data, particularly for genes exhibiting large fold changes between samples,61 as we observed for Aurora A in glioblastomas. Thus, true differences in survival at very low and very high mRNA levels may not be found, if these differences in expression cannot be accurately quantified.
Interestingly, the Aurora A kinase substrate transforming acidic coiled coil-3 (TACC3) correlates with Aurora A mRNA expression and glioma grade.62 TACC3 is a centrosomal protein, the knockdown of which, like Aurora A, results in microtubule destabilization and genomic instability. Similar to our findings for Aurora A, TACC3 mRNA, measured by quantitative RT-PCR, was both mostly highly expressed in a subset of glioblastomas, and most variably expressed in glioblastomas as a whole. The level of TACC3 mRNA was nearly identical to our findings for Aurora A mRNA (about 35-fold).62
In addition to increased malignant tumor formation in Aurora A haploinsufficient mice,40 several other lines of evidence support a tumor suppressor role for Aurora A. Aurora A knock-in in Drosophila larvae results in decreased neuroblast proliferation, presumably by interfering with protein kinase C and Notch-mediated signaling.63 Additionally, Hoque et al. found elevated Aurora A expression in ductal carcinoma in situ of the breast (DCIS, a noninvasive pre-malignant lesion) and comparatively decreased Aurora A in invasive breast carcinoma within the same patients.64 Similarly, in ovarian cancer, one study reports that the highest Aurora A levels were found in early, lower-grade tumors.26 Another study showed frequent deletion or downregulation of the Aurora A gene in tumors from p53-null mice.65 Furthermore, two Aurora A single nucleotide polymorphisms (SNPs) resulting in reduced kinase activity are associated with increased risk of esophageal cancer.66
Hence, although Aurora A overexpression may be associated with neoplastic transformation and tumor progression in some neoplasms, perhaps including gliomas, its downregulation or loss may possibly lead to progression to even more aggressive lesions. Several other gene products, including the Aurora A-interacting protein neural precursor cell expressed, developmentally downregulated 9 (NEDD9), have recently been suggested to also have such dual roles in tumorogenesis.67,68
We therefore propose a model for dual roles for Aurora A in gliomagenesis. In this model, Aurora A overexpression is associated with the genesis of certain low-grade gliomas, e.g., pilocytic astrocytomas and ependymomas. Aurora A overexpression may lead to genomic instability and tumor progression in tumors with p53 pathway defects.20,25,39 Pilocytic astrocytomas and ependymomas generally do not harbor p53 defects, and pilocytic astrocytomas, in particular, rarely progress to high-grade lesions.69,70 p53 aberrations are, however, common in diffuse astrocytomas, anaplastic astrocytomas and glioblastomas, in which increased Aurora A expression may theoretically lead to genomic instability and the formation of more aggressive lesions. Aurora A alleles may then be subsequently lost in a subset of genomically unstable tumors, as it is well established that Aurora A overexpression may lead to genomic instability, possibly resulting in partial loss of its own alleles or generating genetic changes affecting Aurora A mRNA or protein regulation or function. Indeed, Aurora A protein expression was more variable in glioblastomas than any other glial tumor examined.
Consistent with the above theory, mouse mammary tumor virus (MMTV)-driven Aurora A overexpression led to increased complexity of mammary gland branching and, only infrequently, malignant tumors.39 The incidence of malignant tumor formation was significantly higher, however, in p53 (+/−) mice, suggesting that p53 dysfunction, often a prerequisite to genomic instability, was highly permissive to malignant transformation in Aurora A overexpressing animals.
The recently described proneural subtype of glioblastoma is characterized by amplification and overexpression of Aurora A among other genes. Consistent with our findings for Aurora A expression, glioblastomas demonstrating the proneural expression pattern signature are associated with a better prognosis compared with other glioblastoma subtypes.71 Moreover, analysis of the Rembrandt database by Cooper et al. revealed that the proneural expression signature was associated with a better prognosis in oligodendrogliomas.72 This is supported by our findings of improved survival in anaplastic oligodendrogliomas expressing higher Aurora A protein levels (Fig. S2F).
We found that the small molecule-selective Aurora A kinase inhibitor MLN8237 is potently cytotoxic to glioblastoma cells in vitro and appeared to induce cellular senescence and possibly cellular differentiation in surviving cells. Possible mechanisms include Aurora A inhibition resulting in decreased c-Myc and/or NFκB signaling, since c-Myc induces Nestin expression and the undifferentiated glioblastoma tumor stem cell phenotype73 and blockade of NFκB signaling can result in senescence of differentiating glioblastoma cells.74 MLN8237 additionally potentiated glioma cell susceptibility to ionizing radiation, suggesting that Aurora A inhibition may also serve as a modulator of ionizing radiation or vice versa. Aurora A inhibitors may also serve as modulators of other therapies; for instance, MLN8237 can also potentiate the effects of docetaxel.75
Since lower Aurora A expression correlates with more aggressive behavior in glioblastoma, one may question the rationale for clinical use of an Aurora A inhibitor in these patients. It is likely that Aurora A inhibition is anti-neoplastic by at least two mechanisms, namely, its direct effects on the mitotic spindle and tendency to generate aneuploidy and mitotic catastrophe (genomic instability), leading to apoptosis or senescence, and its probable indirect anti-proliferative effect via negative effects on signaling pathways, e.g., cyclin-B1, NFκB, n-Myc, c-Myc and β-catenin, possibly leading to senescence or differentiation. These antitumor effects would be relatively immediate and likely prevent any downstream oncogenic effects of Aurora A inhibition, such as the promotion of genomic instability, which would require cell division to generate. Nevertheless, the remote possibility that Aurora A inhibition, particularly sub-therapeutic or partial inhibition, may lead to tumor progression in vivo requires further study.
In summary, our findings suggest that Aurora A represents a potential useful biomarker in glioblastoma as a significant indicator of patient survival. Aurora A may also be a useful marker in other gliomas, particularly grade III astrocytomas and oligodendrogliomas, which display more variable clinical behavior, and merits further study in these neoplasms. Additionally, inhibition of Aurora A by MLN8237 or similar agents represents a potential new primary chemotherapeutic strategy and/or modulator of other therapies in glioblastoma and perhaps other glial tumor types. Further studies are needed to determine the precise mechanism(s) by which relative Aurora A downregulation or loss may directly lead to more aggressive tumors, or whether it is simply a by product of other causative phenomenon. Lastly, preclinical studies of MLN8237's efficacy with and without radiation or other co-therapies in animal models of glioblastoma are also warranted.
Materials and Methods
Patient samples.
The use of human tissues in this study was approved by the Henry Ford Health System Institutional Review Board (approval no. 6195). Written informed consent was obtained from all patients for the use of surgically collected tissues for research purposes. Snap frozen tissue samples from brain tumors and 11 epilepsy specimens (4 females, 7 males, age 19 to 65 y, = 33.9 y) stored in liquid nitrogen were used for western blots. There were 6 pilocytic astrocytomas (3 males, 3 females, age 4 mo to 40 y, = 23.4 y), 7 WHO grade II diffuse astrocytomas (5 males, 2 females, age 25 to 58 y, = 40 y), 14 WHO grade III anaplastic astrocytomas (7 males, 7 females, age 22 to 63 y, = 43.5), 31 WHO grade IV glioblastomas (16 males, 15 females, age 28 to 83 y, = 44.4), 16 WHO grade II oligodendrogliomas (11 males, 5 females, age 24 to 72, = 43.7), and 16 WHO grade III anaplastic oligodendrogliomas (12 males, 4 females, age 27 to 73, = 48.6). Twelve ependymomas were comprised of 2 WHO grade I myxopapillary ependymomas (2 females, age 17 and 28 y, = 22.5), 7 WHO grade II conventional ependymomas (5 males, 2 females, age 12 to 77, = 43) and 2 WHO grade III anaplastic ependymomas (1 male, 1 female, age 20 and 22 yr, = 21). Archived formalin-fixed, paraffin-embedded (FFPE) tumor samples from 10 epilepsy specimens (6 males, 4 females, age 20 to 60 y, = 40.1 y) and 58 glioblastoma patients (29 females, 29 males, age 21 to 83 y, = 57.2 y) were used for RT-PCR. Both protein and mRNA was available for 9 glioblastoma samples.
Quantitative western blots.
Snap frozen tissue from temporal lobe epilepsy or tumor resections were stored in liquid nitrogen and used to prepare cell lysates. Frozen tissue was homogenized in lysate buffer consisting of RIPA [25 mM TRIS-HCl pH 7.6, 150 mM NaCl, 1% NP-40, 1% sodium deoxycholate, 0.1% SDS (Thermo Scientific)] containing 1 µM dithiotreitol and protease inhibitors [16 µg/ml aprotinin, 1 µg/ml each of leupeptin A, pepstatin and chymostatin (Sigma) and 1 mM 4-(2-aminoethyl)-benzenesulfonyl fluoride hydrochloride (MP Biomedicals)]. Homogenates were centrifuged at 16,100x g at 4°C for 20 min; the supernatant was collected and centrifugation repeated. Lysate total protein was determined using the Pierce BCA method (Thermo Scientific). Lysates (25 µg total protein for patient samples and 10 µg for cell lines) were electrophoresed on 10% polyacrylamide gels and electrotransferred to Imobilon™ PVDF membranes (Millipore). Membranes were blocked with 4% dried milk in TBST and incubated with clone 35C1 mouse monoclonal anti-human Aurora A supernatant (1:500),27 for all tumor analyses or purified clone 35C1 antibody (Abcam ab13824, 1:500); for other experiments, rabbit anti-human HIF-1α (Cell Signaling Technology #3716, 1:500) or mouse monoclonal anti-β-actin (Sigma A2228, 1:4,000) for 90 min at room temperature. Secondary antibodies were goat anti-mouse or goat anti-rabbit IgG-HRP (Santa Cruz Biotechnologies) incubated for 30 min. Blots were developed with Pierce ECL (Thermo Scientific), or SuperSignal® West Femto (Thermo) for HIF-1α, and exposed to X-ray film. Ratios of Aurora A protein signal to β-actin signal within samples were determined by densitometry using NIH Image J software. One minute Aurora A exposures and 10 sec β-actin exposures were used for quantification. Densitometry results from light to moderate exposure levels (1 and 2 min) were consistently proportionate indicating ECL signal detection was in the linear range (Table S1).
Quantitative RT-PCR.
RNA was isolated from five to six 10 µM curls from FFPE tissue blocks using the RecoverAll™ Total Nucleic Acid Isolation Kit for FFPE (Ambion®). Macrodissection of 4 µm FFPE sections from 5 to 6 glass microscope slides was occasionally necessary for tumor enrichment due to the presence of significant amounts of necrosis or non-tumor tissue in paraffin blocks. RNA was assessed spectrophotometrically, and high quality RNA was confirmed by 260 nm/280 nm absorbance ratios of 1.8 to 2.1. cDNA was generated from mRNA using the SuperScript® III reverse transcriptase kit (Invitrogen) using random hexamer primers according to the manufacturer's protocol.
Real-time PCR was performed in reactions consisting of 12.5 µl ABI TaqMan Universal PCR Master Mix (Applied Biosystems), 3.0 µl of 2.5 µM forward primer, 3.0 µl of 2.5 µM reverse primer, 1.0 µl of 2.5 µM probe, 0.5 µl nuclease-free water and 5 µl sample cDNA using a Roche LightCycler 480. The PCR program was: 50°C 2 min hold; 95°C 10 min hold; 65 cycles of 95°C 15 sec and 60°C 1 min; and a final 50°C 1 min hold. PCR primers and probes were as follows. Aurora A forward primer: GCA GAT TTT GGG TGG TCA GT; reverse: CAA AAG GAG GCT TCC CAA CT; and probe (FAM-6): AAT GAT TGA AGG TCG GAT GC. For β-2 microglobin (B2M), forward: TGC CGT GTG AAC CAT GTG AC; reverse: ACC TCC ATG ATG CTG CTT ACA; and probe (FAM-6): TGT CAC AGC CCA AGA TAG TTA AGT GGG ATC G.
Fold change was estimated using the ΔΔ-Ct method with B2M as the control gene within each tumor sample and the average Δ-Ct among the 10 control samples as the referent group (). Thus, a negative fold change indicates less Aurora A expression in the tumor than in the average control.
Immunohistochemistry.
Four-micron-thick formalin-fixed, paraffin-embedded sections (FFPE) were antigen retrieved in Dako Envision FLEX target retrieval solution (citrate pH 6.1 for Aurora A and tris/EDTA pH 9 for Ki-67) by heat (97°C) in a Dako PT Link pretreatment chamber (Dako). Primary antibodies, rabbit anti-human Aurora A (Bethyl, 1:1,500) or mouse anti-human Ki-67 (Dako, clone MIB-1, 1:600) were incubated at room temperature for 20 min. Dako FLEX anti-rabbit linker HRP was used for detection with DAB chromagen. Slides were counterstained with Mayer's hematoxylin. Ki-67 labeling indices were determined by counting the fraction of positive tumor cell nuclei within a 400x microscope field in the most actively labeling areas of a tumor section.
Cell culture.
Established glioma monolayer cell lines and low-passage primary glioblastoma monolayer cell cultures derived from patient tumors were used as previously described in reference 76. Cells were cultured in DMEM or RPMI 1640 (HF2359) with 10% fetal calf serum in 5% CO2/air at 37°C using standard methods. The investigational Aurora A inhibitor MLN8237 was provided by Millennium Pharmaceuticals, Inc., and was diluted in DMSO. For cytotoxicity experiments, 600 cells were seeded per 60 mm culture dish and treated the following day with various concentrations of MLN8237 in triplicate dishes for 24 to 96 hr as described previously in reference 77. Seven days later, the culture was aspirated, and the dishes were washed with DPBS, fixed with methanol, stained with Giemsa, rinsed in deionized water and air-dried. Colonies containing 20 or more cells were counted using a dissecting microscope. Percent survival was calculated as the average number of colonies per dish from three dishes for a given MLN8237 concentration/time point divided by the average number of colonies per dish from three control dishes treated with DMSO only.
For hypoxia experiments, log-phase U87 glioma cells were incubated in a 1% O2, 5% CO2, 94% N2 atmosphere in a ProOx model C21 hypoxia chamber (Biospherix) within a standard water-jacked incubator at 37°C for various lengths of time. At the start of the experiment, culture media was replaced with media pre-equilibrated in the hypoxia chamber overnight.
In radiation treatments, cells were plated at 6,000 cells/60 mm dish and the following day were treated with 50 nM or 150 nM MLN8237 for 48 hr and then exposed to 2 Gy or 4 Gy of gamma radiation in a JL Shepherd and Associates Mark I-688 5,000 Ci cesium (Cs-137) irradiator. The cells were then trypsinized and re-plated into 60 mm dishes and cultured for 7 d, followed by Giemsa staining and colony formation scoring as above.
Statistical analysis.
For analysis of western blot data, two sample t-tests, allowing unequal variance, were used to determine p-values for the pairwise comparisons of Aurora A protein levels between glioma histopathological subtypes (Aurora A/β-actin at 1 min of X-ray film exposure). Because of the large number of comparisons, p-values less than 0.01 were considered statistically significant, and p-values between 0.01 and 0.05 were considered to be of borderline statistical significance.78 When comparing protein and RT-PCR values, protein measures were scaled by the average measure among controls.
For U87 cell culture hypoxia experiments, ratios of HIF-1α or Aurora A to β-actin protein expression were calculated at each hypoxia time point. The average fold change, relative to control non-hypoxic cultures at time zero, was examined at each time point using a two-sided one-sample t-test (log2 scale).
Survival was measured from the time of diagnosis until death or last follow-up (right-censored). The association of protein or transcript level with patient survival was assessed continuously using Cox regression and visualized using Kaplan-Meier curves split at the median value for each diagnostic class, i.e., measures at or below the median were considered low and those above the median were considered high. The log-rank test was used to assess the separation of the Kaplan-Meier curves. High-throughput gene expression measurements from an Affymetrix HG-U133Plus2A array were obtained from TCGA data portal (http://tcga-data.nci.nih.gov/tcga/, May 28, 2010) for 364 glioblastoma samples.52 These data were normalized using global centering to the sample-wise medians and scaling to the sample-wise MAD, to reduce batch effects between samples. Genes of interest were selected, and Pearson correlation coefficients were calculated by probe.
For combined MLN8237 and radiation experiments, the average number of colonies surviving after treatment with radiation and Aurora A inhibitor were compared using a two-factor analysis of variance with factors inhibitor and radiation. The interaction term for these factors was used to assess synergistic action of the two treatments. There were three levels of inhibitor (none, 50 nM, 150 nM) and three levels of radiation treatment (none, 2 Gy, 4 Gy), which were treated nominally.
All correlation coefficients, and 95% confidence intervals, are from the Pearson's correlation assuming a linear association. p-values are based on the null hypothesis of no correlation, i.e., r = 0.
Acknowledgements
We thank Ms. Theresa Hobbs, Ms. Deborah Jewell and Ms. Frances Devos for administrative assistance, Ms. Nivedita Tiwari, Ms. Lisa Scarpace, Mr. Enoch Carlton, Ms. Nancy Lemke, Ms. Nancy Peshkin, Mr. Kevin Nelsen, Mr. Andrew Kolozsvary and Dr. Kenneth Barton for technical assistance, Dr. Ana deCarvalho for primary glioblastoma cell lines, Dr. Dhananjay Chitale for Aurora A PCR primers, Dr. Zheng Zhang and Dr. Feng Jiang for helpful suggestions, and Mr. John Waugh for support. Clone 35C1 anti-Aurora A monoclonal antibody supernatant was kindly provided by Dr. Claude Prigent. This study was funded in part by the National Institute of Neurological Disorders and Stroke K08 NS45077 (N.L.L.).
Disclosure of Potential Conflicts of Interest
No potential conflicts of interest were disclosed.
Supplementary Material
References
- 1.Zhou H, Kuang J, Zhong L, Kuo WL, Gray JW, Sahin A, et al. Tumour amplified kinase STK15/BTAK induces centrosome amplification, aneuploidy and transformation. Nat Genet. 1998;20:189–193. doi: 10.1038/2496. [DOI] [PubMed] [Google Scholar]
- 2.Marumoto T, Honda S, Hara T, Nitta M, Kohmura E, Saya H. Aurora A kinase maintains the fidelity of early and late mitotic events in HeLa cells. J Biol Chem. 2003;278:51786–51795. doi: 10.1074/jbc.M306275200. [DOI] [PubMed] [Google Scholar]
- 3.Seki A, Coppinger JA, Jang CY, Yates JR, Fang G. Bora and the kinase Aurora A cooperatively activate the kinase Plk1 and control mitotic entry. Science. 2008;320:1655–1658. doi: 10.1126/science.1157425. [DOI] [PMC free article] [PubMed] [Google Scholar]
- 4.Song SJ, Song MS, Kim SJ, Kim SY, Kwon SH, Kim JG, et al. Aurora A regulates prometaphase progression by inhibiting the ability of RASSF1A to suppress APC-Cdc20 activity. Cancer Res. 2009;69:2314–2323. doi: 10.1158/0008-5472.CAN-08-3984. [DOI] [PubMed] [Google Scholar]
- 5.Otto T, Horn S, Brockmann M, Eilers U, Schüttrumpf L, Popov N, et al. Stabilization of N-Myc is a critical function of Aurora A in human neuroblastoma. Cancer Cell. 2009;15:67–78. doi: 10.1016/j.ccr.2008.12.005. [DOI] [PubMed] [Google Scholar]
- 6.Dar AA, Belkhiri A, El-Rifai W. The Aurora kinase A regulates GSK-3β in gastric cancer cells. Oncogene. 2009;28:866–875. doi: 10.1038/onc.2008.434. [DOI] [PMC free article] [PubMed] [Google Scholar]
- 7.Yang H, Ou CC, Feldman RI, Nicosia SV, Kruk PA, Cheng JQ. Aurora A kinase regulates telomerase activity through c-Myc in human ovarian and breast epithelial cells. Cancer Res. 2004;64:463–467. doi: 10.1158/0008-5472.CAN-03-2907. [DOI] [PubMed] [Google Scholar]
- 8.Sasayama T, Marumoto T, Kunitoku N, Zhang D, Tamaki N, Kohmura E, et al. Overexpression of Aurora A targets cytoplasmic polyadenylation element binding protein and promotes mRNA polyadenylation of Cdk1 and Cyclin B1. Genes Cells. 2005;10:627–638. doi: 10.1111/j.1365-2443.2005.00870.x. [DOI] [PubMed] [Google Scholar]
- 9.Qin L, Tong T, Song Y, Xue L, Fan F, Zhan Q. Aurora A interacts with Cyclin B1 and enhances its stability. Cancer Lett. 2009;275:77–85. doi: 10.1016/j.canlet.2008.10.011. [DOI] [PubMed] [Google Scholar]
- 10.Tomita M, Toyota M, Ishikawa C, Nakazato T, Okudaira T, Matsuda T, et al. Overexpression of Aurora A by loss of CHFR gene expression increases the growth and survival of HTLV-1-infected T cells through enhanced NFkappaB activity. Int J Cancer. 2009;124:2607–2615. doi: 10.1002/ijc.24257. [DOI] [PubMed] [Google Scholar]
- 11.He L, Yang H, Ma Y, Pledger WJ, Cress WD, Cheng JQ. Identification of Aurora A as a direct target of E2F3 during G2/M cell cycle progression. J Biol Chem. 2008;283:31012–31020. doi: 10.1074/jbc.M803547200. [DOI] [PMC free article] [PubMed] [Google Scholar] [Retracted]
- 12.Tanaka M, Ueda A, Kanamori H, Ideguchi H, Yang J, Kitajima S, et al. Cell cycle-dependent regulation of human Aurora A transcription is mediated by periodic repression of E4TF1. J Biol Chem. 2002;277:10719–10726. doi: 10.1074/jbc.M108252200. [DOI] [PubMed] [Google Scholar]
- 13.Klein A, Flügel D, Kietzmann T. Transcriptional regulation of serine/threonine kinase-15 (STK15) expression by hypoxia and HIF-1. Mol Biol Cell. 2008;19:3667–3675. doi: 10.1091/mbc.E08-01-0042. [DOI] [PMC free article] [PubMed] [Google Scholar]
- 14.den Hollander J, Rimpi S, Doherty JR, Rudelius M, Buck A, Hoellein A, et al. Aurora kinases A and B are upregulated by Myc and are essential for maintenance of the malignant state. Blood. 2010;116:1498–1505. doi: 10.1182/blood-2009-11-251074. [DOI] [PMC free article] [PubMed] [Google Scholar]
- 15.van Leuken R, Clijsters L, van Zon W, Lim D, Yao X, Wolthuis RM, et al. Polo-like kinase-1 controls Aurora A destruction by activating APC/C-Cdh1. PLoS ONE. 2009;4:5282. doi: 10.1371/journal.pone.0005282. [DOI] [PMC free article] [PubMed] [Google Scholar]
- 16.Fujii Y, Yada M, Nishiyama M, Kamura T, Takahashi H, Tsunematsu R, et al. Fbxw7 contributes to tumor suppression by targeting multiple proteins for ubiquitin-dependent degradation. Cancer Sci. 2006;97:729–736. doi: 10.1111/j.1349-7006.2006.00239.x. [DOI] [PMC free article] [PubMed] [Google Scholar]
- 17.Finkin S, Aylon Y, Anzi S, Oren M, Shaulian E. Fbw7 regulates the activity of endoreduplication mediators and the p53 pathway to prevent drug-induced polyploidy. Oncogene. 2008;27:4411–4421. doi: 10.1038/onc.2008.77. [DOI] [PubMed] [Google Scholar]
- 18.Hagedorn M, Delugin M, Abraldes I, Allain N, Belaud-Rotureau MA, Turmo M, et al. FBXW7/hCDC4 controls glioma cell proliferation in vitro and is a prognostic marker for survival in glioblastoma patients. Cell Div. 2007;2:9. doi: 10.1186/1747-028-2-9. [DOI] [PMC free article] [PubMed] [Google Scholar]
- 19.Bischoff JR, Anderson L, Zhu Y, Mossie K, Ng L, Souza B, et al. A homologue of Drosophila Aurora kinase is oncogenic and amplified in human colorectal cancers. EMBO J. 1998;17:3052–3065. doi: 10.1093/emboj/17.11.3052. [DOI] [PMC free article] [PubMed] [Google Scholar]
- 20.Meraldi P, Honda R, Nig EA. Aurora A overexpression reveals tetraploidization as a major route to centrosome amplification in p53−/− cells. EMBO J. 2002;21:483–492. doi: 10.1093/emboj/21.4.483. [DOI] [PMC free article] [PubMed] [Google Scholar]
- 21.Hoar K, Chakravarty A, Rabino C, Wysong D, Bowman D, Roy N, et al. MLN8054, a small-molecule inhibitor of Aurora A, causes spindle pole and chromosome congression defects leading to aneuploidy. Mol Cell Biol. 2007;27:4513–4525. doi: 10.1128/MCB.02364-06. [DOI] [PMC free article] [PubMed] [Google Scholar]
- 22.Huck JJ, Zhang M, McDonald A, Bowman D, Hoar KM, Stringer B, et al. MLN8054, an inhibitor of Aurora A kinase, induces senescence in human tumor cells both in vitro and in vivo. Mol Cancer Res. 2010;8:373–384. doi: 10.1158/1541-7786.MCR-09-0300. [DOI] [PubMed] [Google Scholar]
- 23.Cahill DP, Kinzler KM, Vogelstein B, Lengauer C. Genetic instability and darwinian selection in tumours. Trends Cell Biol. 1999;9:57–60. doi: 10.1016/S0962-8924(99)01661-X. [DOI] [PubMed] [Google Scholar]
- 24.Fujiwara T, Bandi M, Nitta M, Ivanova EV, Bronson RT, Pellman D. Cytokinesis failure generating tetraploids promotes tumorigenesis in p53-null cells. Nature. 2005;437:1043–1047. doi: 10.1038/nature04217. [DOI] [PubMed] [Google Scholar]
- 25.Lehman NL, Verschuren EW, Hsu JY, Cherry Am, Jackson PK. Overexpression of the anaphase promoting complex/cyclosome inhibitor Emi1 leads to tetraploidy and genomic instability of p53-deficient cells. Cell Cycle. 2006;5:1569–1573. doi: 10.4161/cc.5.14.2925. [DOI] [PubMed] [Google Scholar]
- 26.Gritsko TM, Coppola D, Paciga JE, Yang L, Sun M, Shelley SA, et al. Activation and overexpression of centrosome kinase BTAK/Aurora A in human ovarian cancer. Clin Cancer Res. 2003;9:1420–1426. [PubMed] [Google Scholar]
- 27.Conte N, Delaval B, Ginestier C, Ferrand A, Isnardon D, Larroque C, et al. TACC1-chTOG-Aurora A protein complex in breast cancer. Oncogene. 2003;22:8102–8116. doi: 10.1038/sj.onc.1206972. [DOI] [PubMed] [Google Scholar]
- 28.Buschhorn HM, Klein RR, Chambers SM, Hardy MC, Green S, Bearss D, et al. Aurora A overexpression in high-grade PIN lesions and prostate cancer. Prostate. 2005;64:341–346. doi: 10.1002/pros.20247. [DOI] [PubMed] [Google Scholar]
- 29.Neben K, Korshunov A, Benner A, Wrobel G, Hahn M, Kokocinski F, et al. Microarray-based screening for molecular markers in medulloblastoma revealed STK15 as independent predictor for survival. Cancer Res. 2004;64:3103–3111. doi: 10.1158/0008-5472.CAN-03-3968. [DOI] [PubMed] [Google Scholar]
- 30.Shang X, Burlingame SM, Okcu MF, Ge N, Russell HV, Egler RA, et al. Aurora A is a negative prognostic factor and a new therapeutic target in human neuroblastoma. Mol Cancer Ther. 2009;8:2461–2469. doi: 10.1158/1535-7163.MCT-08-0857. [DOI] [PMC free article] [PubMed] [Google Scholar]
- 31.Reichardt W, Jung V, Brunner C, Klein A, Wemmert S, Romeike BF, et al. The putative serine/threonine kinase gene STK15 on chromosome 20q13.2 is amplified in human gliomas. Oncol Rep. 2003;10:1275–1279. [PubMed] [Google Scholar]
- 32.Klein A, Reichardt W, Jung V, Zang KD, Meese E, Urbschat S. Overexpression and amplification of STK15 in human gliomas. Int J Oncol. 2004;25:1789–1794. [PubMed] [Google Scholar]
- 33.Lehman NL, Tibshirani R, Hsu JY, Natkunam Y, Harris BT, West RB, et al. Oncogenic regulators and substrates of the anaphase promoting complex/cyclosome are frequently overexpressed in malignant tumors. Am J Pathol. 2007;170:1793–1805. doi: 10.2353/ajpath.2007.060767. [DOI] [PMC free article] [PubMed] [Google Scholar]
- 34.Samaras V, Stamatelli A, Samaras E, Arnaoutoglou C, Arnaoutoglou M, Stergiou I, et al. Comparative immunohistochemical analysis of Aurora A and Aurora B expression in human glioblastomas. Associations with proliferative activity and clinicopathological features. Pathol Res Pract. 2009;205:765–773. doi: 10.1016/j.prp.2009.06.011. [DOI] [PubMed] [Google Scholar]
- 35.Barton VN, Foreman NK, Donson AM, Birks DK, Handler MH, Vibhakar R. Aurora kinase A as a rational target for therapy in glioblastoma. J Neurosurg Pediatr. 2010;6:98–105. doi: 10.3171/2010.3.PEDS10120. [DOI] [PubMed] [Google Scholar]
- 36.Li CC, Chu HY, Yang CW, Chou CK, Tsai TF. Aurora A overexpression in mouse liver causes p53-dependent premitotic arrest during liver regeneration. Mol Cancer Res. 2009;7:678–688. doi: 10.1158/1541-7786.MCR-08-0483. [DOI] [PubMed] [Google Scholar]
- 37.Warner SL, Muñoz RM, Bearss DJ, Grippo P, Han H, Von Hoff DD. Pdx-1-driven overexpression of Aurora a kinase induces mild ductal dysplasia of pancreatic ducts near islets in transgenic mice. Pancreas. 2008;37:39–44. doi: 10.1097/MPA.0b013e318176b9ae. [DOI] [PMC free article] [PubMed] [Google Scholar]
- 38.Zhang D, Shimizu T, Araki N, Hirota T, Yoshie M, Ogawa K, et al. Aurora A overexpression induces cellular senescence in mammary gland hyperplastic tumors developed in p53-deficient mice. Oncogene. 2008;27:4305–4314. doi: 10.1038/onc.2008.76. [DOI] [PubMed] [Google Scholar]
- 39.Wang X, Zhou YX, Qiao W, Tominaga Y, Ouchi M, Ouchi T, et al. Overexpression of Aurora kinase A in mouse mammary epithelium induces genetic instability preceding mammary tumor formation. Oncogene. 2006;25:7148–7158. doi: 10.1038/sj.onc.1209707. [DOI] [PubMed] [Google Scholar]
- 40.Lu LY, Wood JL, Ye L, Minter-Dykhouse K, Saunders TL, Yu X, et al. Aurora A is essential for early embryonic development and tumor suppression. J Biol Chem. 2008;283:31785–31790. doi: 10.1074/jbc.M805880200. [DOI] [PMC free article] [PubMed] [Google Scholar]
- 41.Harrington EA, Bebbington D, Moore J, Rasmussen RK, Ajose-Adeogun AO, Nakayama T, et al. VX-680, a potent and selective small-molecule inhibitor of the Aurora kinases, suppresses tumor growth in vivo. Nat Med. 2004;10:262–267. doi: 10.1038/nm1003. [DOI] [PubMed] [Google Scholar]
- 42.Cheung CH, Coumar MS, Hsieh HP, Chang JY. Aurora kinase inhibitors in preclinical and clinical testing. Expert Opin Investig Drugs. 2009;18:379–398. doi: 10.1517/13543780902806392. [DOI] [PubMed] [Google Scholar]
- 43.Manfredi MG, Ecsedy JA, Meetze KA, Balani SK, Burenkova O, Chen W, et al. Antitumor activity of MLN8054, an orally active small-molecule inhibitor of Aurora A kinase. Proc Natl Acad Sci USA. 2007;104:4106–4111. doi: 10.1073/pnas.0608798104. [DOI] [PMC free article] [PubMed] [Google Scholar]
- 44.Hose D, Rème T, Meissner T, Moreaux J, Seckinger A, Lewis J, et al. Inhibition of Aurora kinases for tailored risk-adapted treatment of multiple myeloma. Blood. 2009;113:4331–4340. doi: 10.1182/blood-2008-09-178350. [DOI] [PMC free article] [PubMed] [Google Scholar]
- 45.VanderPorten EC, Taverna P, Hogan JN, Ballinger MD, Flanagan WM, Fucini RV. The Aurora kinase inhibitor SNS-314 shows broad therapeutic potential with chemotherapeutics and synergy with microtubule-targeted agents in a colon carcinoma model. Mol Cancer Ther. 2009;8:930–939. doi: 10.1158/1535-7163.MCT-08-0754. [DOI] [PubMed] [Google Scholar]
- 46.Macarulla T, Cervantes A, Elez E, Rodríguez-Braun E, Baselga J, Roselló S, et al. Phase I study of the selective Aurora A kinase inhibitor MLN8054 in patients with advanced solid tumors: safety, pharmacokinetics and pharmacodynamics. Mol Cancer Ther. 2010;9:2844–2852. doi: 10.1158/1535-7163.MCT-10-0299. [DOI] [PubMed] [Google Scholar]
- 47.Kelly KR, Ecsedy J, Medina E, Mahalingam D, Padmanabhan S, Nawrocki ST, et al. The novel Aurora A kinase inhibitor MLN8237 is active in resistant chronic myeloid leukemia and significantly increases the efficacy of nilotinib. J Cell Mol Med. 2011;15:2057–2070. doi: 10.1111/j.1582-4934.2010.01218.x. [DOI] [PMC free article] [PubMed] [Google Scholar]
- 48.Görgün G, Calabrese E, Hideshima T, Ecsedy J, Perrone G, Mani M, et al. A novel Aurora A kinase inhibitor MLN8237 induces cytotoxicity and cell cycle arrest in multiple myeloma. Blood. 2010;115:5202–5213. doi: 10.1182/blood-2009-12-259523. [DOI] [PMC free article] [PubMed] [Google Scholar]
- 49.Carol H, Boehm I, Reynolds CP, Kang MH, Maris JM, Morton CL, et al. Efficacy and pharmacokinetic/pharmacodynamic evaluation of the Aurora kinase A inhibitor MLN8237 against preclinical models of pediatric cancer. Cancer Chemother Pharmacol. 2011;68:1291–1304. doi: 10.1007/s00280-011-1618-8. [DOI] [PMC free article] [PubMed] [Google Scholar]
- 50.Maris JM, Morton CL, Gorlick R, Kolb EA, Lock R, Carol H, et al. Initial testing of the Aurora kinase A inhibitor MLN8237 by the Pediatric Preclinical Testing Program (PPTP) Pediatr Blood Cancer. 2010;55:26–34. doi: 10.1002/pbc.22430. [DOI] [PMC free article] [PubMed] [Google Scholar]
- 51.Sells T, Ecsedy J, Stroud S, Janowick D, Hoar K, LeRoy P, et al. MLN8237: An orally active small molecule inhibitor of Aurora A kinase in Phase I clinical trials. Proceedings American Association for Cancer Research. 2008 [Google Scholar]
- 52.Cancer Genome Atlas Research Network, author. Comprehensive genomic characterization defines human glioblastoma genes and core pathways. Nature. 2008;455:1061–1068. doi: 10.1038/nature07385. [DOI] [PMC free article] [PubMed] [Google Scholar]
- 53.Yang S, He S, Zhou X, Liu M, Zhu H, Wang Y, et al. Suppression of Aurora A oncogenic potential by c-Myc downregulation. Exp Mol Med. 2010;42:759–767. doi: 10.3858/emm.2010.42.11.077. [DOI] [PMC free article] [PubMed] [Google Scholar]
- 54.El-Sheikh A, Fan R, Birks D, Donson A, Foreman NK, Vibhakar R. Inhibition of Aurora Kinase A enhances chemosensitivity of medulloblastoma cell lines. Pediatr Blood Cancer. 2010;55:35–41. doi: 10.1002/pbc.22465. [DOI] [PubMed] [Google Scholar]
- 55.Smith SG, Lehman NL, Moran RG. Cytotoxicity of antifolate inhibitors of thymidylate and purine synthesis to WiDr colonic carcinoma cells. Cancer Res. 1993;53:5697–5706. [PubMed] [Google Scholar]
- 56.Takeuchi H, Sato K, Ido K, Kubota T. Mitotic activity of multinucleated giant cells with glial fibrillary acidic protein immunoreactivity in glioblastomas: an immunohistochemical double labeling study. J Neurooncol. 2006;78:15–18. doi: 10.1007/s11060-005-9067-z. [DOI] [PubMed] [Google Scholar]
- 57.Tao Y, Zhang P, Frascogna V, Lecluse Y, Auperin A, Bourhis J, et al. Enhancement of radiation response by inhibition of Aurora A kinase using siRNA or a selective Aurora kinase inhibitor PHA680632 in p53-deficient cancer cells. Br J Cancer. 2007;97:1664–1672. doi: 10.1038/sj.bjc.6604083. [DOI] [PMC free article] [PubMed] [Google Scholar]
- 58.Madhavan S, Zenklusen JC, Kotliarov Y, Sahni H, Fine HA, Buetow K. Rembrandt: helping personalized medicine become a reality through integrative translational research. Mol Cancer Res. 2009;7:157–167. doi: 10.1158/1541-7786.MCR-08-0435. [DOI] [PMC free article] [PubMed] [Google Scholar]
- 59.Sharma MK, Mansur DB, Reifenberger G, Perry A, Leonard JR, Aldape KD, et al. Distinct genetic signatures among pilocytic astrocytomas relate to their brain region origin. Cancer Res. 2007;67:890–900. doi: 10.1158/0008-5472.CAN-06-0973. [DOI] [PubMed] [Google Scholar]
- 60.Rong Y, Durden DL, Van Meir EG, Brat DJ. ‘Pseudopalisading’ necrosis in glioblastoma: a familiar morphologic feature that links vascular pathology, hypoxia and angiogenesis. J Neuropathol Exp Neurol. 2006;65:529–539. doi: 10.1097/00005072-200606000-00001. [DOI] [PubMed] [Google Scholar]
- 61.Dallas PB, Gottardo NG, Firth MJ, Beesley AH, Hoffmann K, Terry PA, et al. Gene expression levels assessed by oligonucleotide microarray analysis and quantitative real-time RT-PCR—how well do they correlate? BMC Genomics. 2005;6:59. doi: 10.1186/1471-2164-6-59. [DOI] [PMC free article] [PubMed] [Google Scholar]
- 62.Duncan CG, Killela PJ, Payne CA, Lampson B, Chen WC, Liu J, et al. Integrated genomic analyses identify ERRFI1 and TACC3 as glioblastoma-targeted genes. Oncotarget. 2010;1:265–277. doi: 10.18632/oncotarget.137. [DOI] [PMC free article] [PubMed] [Google Scholar]
- 63.Wang H, Somers GW, Bashirullah A, Heberlein U, Yu F, Chia W. Aurora A acts as a tumor suppressor and regulates self-renewal of Drosophila neuroblasts. Genes Dev. 2006;20:3453–3463. doi: 10.1101/gad.1487506. [DOI] [PMC free article] [PubMed] [Google Scholar]
- 64.Hoque A, Carter J, Xia W, Hung MC, Sahin AA, Sen S, et al. Loss of Aurora A/STK15/BTAK overexpression correlates with transition of in situ to invasive ductal carcinoma of the breast. Cancer Epidemiol Biomarkers Prev. 2003;12:1518–1522. [PubMed] [Google Scholar]
- 65.Mao JH, Wu D, Perez-Losada J, Jiang T, Li Q, Neve RM, et al. Crosstalk between Aurora A and p53: frequent deletion or downregulation of Aurora A in tumors from p53 null mice. Cancer Cell. 2007;11:161–173. doi: 10.1016/j.ccr.2006.11.025. [DOI] [PMC free article] [PubMed] [Google Scholar]
- 66.Kimura MT, Mori T, Conroy J, Nowak NJ, Satomi S, Tamai K, et al. Two Functional Coding Single Nucleotide Polymorphisms in STK15 (Aurora A) Coordinately Increase Esophageal Cancer Risk. Cancer Res. 2005;65:3548–3554. doi: 10.1158/0008-5472.CAN-04-2149. [DOI] [PMC free article] [PubMed] [Google Scholar]
- 67.Akst J. Two-faced proteins? Proteins that both hinder and spur cancer progression may not be as uncommon as previously thought. [Published 11th January 2011 01:03 PM GMT]—The Scientist-Magazine of the Life Sciences http://www.the-scientist.com/news/display/57916.
- 68.Kim M, Gans JD, Nogueira C, Wang A, Paik JH, Feng B, et al. Comparative oncogenomics identifies NEDD9 as a melanoma metastasis gene. Cell. 2006;125:1269–1281. doi: 10.1016/j.cell.2006.06.008. [DOI] [PubMed] [Google Scholar]
- 69.Scheithauer BW, Hawkins C, Tihan T, VandenBerg SR, Burger PC. Pilocytic astrocytoma. In: Louis DN, Ohgaki H, Wiestler OD, Cavenee WK, editors. World Health Organization Classification of Tumours, 4th Edition. WHO Classification of Tumors of the Central Tumors of the Nervous System. Vol. 4. Lyon: IARC Press; 2007. pp. 14–21. [Google Scholar]
- 70.McLendon RE, Wiestler OD, Kros JM, Korshunov A, Ng H-K. Ependymoma. In: Louis DN, Ohgaki H, Wiestler OD, Cavenee WK, editors. World Health Organization Classification of Tumours, 4th Edition. WHO Classification of Tumors of the Central Tumors of the Nervous System. Vol. 4. Lyon: IARC Press; 2007. pp. 74–78. [Google Scholar]
- 71.Verhaak RG, Hoadley KA, Purdom E, Wang V, Qi Y, Wilkerson MD, et al. Cancer Genome Atlas Research Network. Integrated genomic analysis identifies clinically relevant subtypes of glioblastoma characterized by abnormalities in PDGFRA, IDH1, EGFR and NF1. Cancer Cell. 2010;17:98–110. doi: 10.1016/j.ccr.2009.12.020. [DOI] [PMC free article] [PubMed] [Google Scholar]
- 72.Cooper LA, Gutman DA, Long Q, Johnson BA, Cholleti SR, Kurc T, et al. The proneural molecular signature is enriched in oligodendrogliomas and predicts improved survival among diffuse gliomas. PLoS ONE. 2010;5:12548. doi: 10.1371/journal.pone.0012548. [DOI] [PMC free article] [PubMed] [Google Scholar]
- 73.Panicker SP, Raychaudhuri B, Sharma P, Tipps R, Mazumdar T, Mal AK, et al. p300- and Myc-mediated regulation of glioblastoma multiforme cell differentiation. Oncotarget. 2010;1:289–303. doi: 10.18632/oncotarget.139. [DOI] [PMC free article] [PubMed] [Google Scholar]
- 74.Nogueira L, Ruiz-Ontanon P, Vazquez-Barquero A, Moris F, Fernandez-Luna JL. The NFκB pathway: a therapeutic target in glioblastoma. Oncotarget. 2011;2:646–653. doi: 10.18632/oncotarget.322. [DOI] [PMC free article] [PubMed] [Google Scholar]
- 75.Qi W, Cooke LS, Liu X, Rimsza L, Roe DJ, Manziolli A, et al. Aurora inhibitor MLN8237 in combination with docetaxel enhances apoptosis and antitumor activity in mantle cell lymphoma. Biochem Pharmacol. 2011;81:881–890. doi: 10.1016/j.bcp.2011.01.017. [DOI] [PMC free article] [PubMed] [Google Scholar]
- 76.deCarvalho AC, Nelson K, Lemke N, Lehman NL, Arbab AS, Kalkanis S, et al. Gliosarcoma stem cells undergo glial and mesenchymal differentiation in vivo. Stem Cells. 2010;28:181–190. doi: 10.1002/stem.264. [DOI] [PMC free article] [PubMed] [Google Scholar]
- 77.Lehman NL, Danenberg PV. Modulation of RTX cytotoxicity by thymidine and dipyridamole in vitro: implications for chemotherapy. Cancer Chemother Pharmacol. 2000;45:142–148. doi: 10.1007/s002800050022. [DOI] [PubMed] [Google Scholar]
- 78.O'Brien PC. The appropriateness of ANOVA and multiple comparisons procedures. Biometrics. 1983;39:787–794. doi: 10.2307/2531110. [DOI] [PubMed] [Google Scholar]
Associated Data
This section collects any data citations, data availability statements, or supplementary materials included in this article.