

Abstract
Pancreatic cancer (PC) is one of the most lethal malignancies. It has a 5-year survival rate of only 6%, owing in part to the lack of a reliable tumor marker for early diagnosis. Recent research has shown that the mucin protein MUC4 is aberrantly expressed in pancreatic adenocarcinoma cell lines and tissues but is undetectable in normal pancreas and chronic pancreatitis. Thus, the level of MUC4 in patient sera has the potential to function as a diagnostic and prognostic marker for PC. However, the measurement of MUC4 in sera using conventional test platforms (e.g., enzyme linked immunosorbent assay (ELISA) and radioimmunoassay (RIA)) has been unsuccessful. This has prevented the assessment of the utility of this protein as a possible PC marker in sera. In addressing this obstacle, the work herein examines the potential to create a simple diagnostic test for MUC4 through the development of a surface-enhanced Raman scattering (SERS)-based immunoassay, which was then used to demonstrate the first ever detection of MUC4 in cancer patient serum samples. Importantly, these measurements showed that sera from patients with PC produced a significantly higher SERS response for MUC4 compared to sera from healthy individuals and from patients with benign diseases. These results indicate that a SERS-based immunoassay can monitor MUC4 levels in patient sera, representing a much needed first step toward assessing the potential of this protein to serve as a serum marker for the early stage diagnosis of PC. This paper details these and other findings (i.e., the detection of the mucin protein CA19-9), which demonstrate that our SERS assay outperforms conventional assays (i.e., RIA and ELISA) with respect to limits of detection, readout time, and required sample volume.
Pancreatic cancer (PC) is the fourth leading cause of cancer-related deaths in the United States; estimated to account for 36 800 deaths in 2010.1 It exhibits rapid metastasis and has a 5 year survival rate of 6%.1 This poor outlook reflects both the late onset of symptoms and the absence of specific biomarkers and diagnostic tests for early diagnosis. Serum-based assays are the most used tests for the detection of tumor markers in clinical settings, owing to the important role serum markers play in early diagnosis, predicting relapse, prognosis, and assessing response to therapy.2
Mucins are high molecular weight, heavily glycosylated proteins characterized by repetitive stretches of amino acids repeated in tandem. Mucins have emerged in recent years as useful markers for the early detection and predicting prognosis and response to therapy in several solid tumors because the expression of various mucin backbones and associated carbohydrate epitopes is altered during the initiation and progression of various cancers, including PC. Moreover, the repetitive nature of the tandem repeat sequences and the presence of carbohydrate modifications allows for the development of highly sensitive detection assays for mucins. Therefore, a majority of serum assays for several cancers are mucin based, including those for CA19-9 (Sialyl Lewis a), CA15-3 (MUC 1), and CA125 (MUC 16).3
Of these proteins, the tumor-associated antigen CA19-9 has proven the most useful and is central to monitoring PC progression after resection or during therapy.4 CA19-9, however, has very little utility in screening patients for early disease as its serum levels are also elevated in a number of benign diseases (e.g., chronic pancreatitis, obstructive jaundice, cirrhosis, pulmonary diseases, and other malignancies5,6). Moreover, the diagnostic sensitivity (69–93%) and specificity (46–98%) of CA19-9 serum assays for PC are unacceptably low.7
While studying the expression profile of various mucins in PC tissues, we found that the mucin protein MUC4 is overexpressed in most PCs but undetectable in chronic pancreatitis and in the normal pancreas.8 Furthermore, after producing the anti-MUC4 monoclonal antibody 8G7, generated against the tandem repeat sequence,9 we established that: (1) MUC4 is expressed in the premalignant precursor lesions (pancreatic intraepithelial neoplasias (PanIN)) of the pancreas; (2) MUC4 expression increased with advancing stages of PC; and (3) MUC4 expression correlated with poor patient survival.10–12 We have also detected MUC4 expression in 91% of fine needle aspirates from PC patients.13 Taken together, these findings point not only to MUC4 as a promising biomarker for PC but also to that a serum-based assay for the detection and estimation of MUC4 levels could potentially prove very useful in the early diagnosis and management of this lethal malignancy.
To evaluate the utility of MUC4 as a serum marker for PC, we first tested platforms routinely employed in clinical settings (i.e., enzyme linked immunosorbent assay (ELISA), radioimmunoassay (RIA)). We have, however, not been successful in applying any of these methods to the detection of MUC4 in serum. As an alternative, this paper reports the successful development of an assay for MUC4 based on surface-enhanced Raman scattering (SERS) and the first quantitative measurements of MUC4 levels in the serum of PC patients.
In its traditional normal and resonance formats, Raman scattering lacks the signal intensity required for immunoassay readout. 14,15 Recent reports, however, have shown that the intensity of SERS can rival that of fluorescence when silver and gold nanoparticles are used as enhancing substrates.16–18 While still the focus of extensive theoretical work, it is widely held that scattering enhancement is mainly due to the enormous increase in the electromagnetic field at the surface of the nanoparticles due to surface plasmon resonance excitation.19 This breakthrough has led to renewed interest in exploring SERS as a tool for rapid, low-level readout.20–25
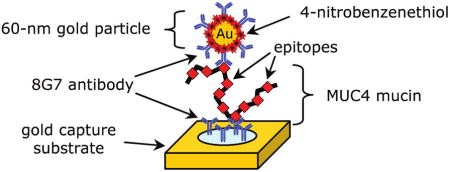
The key features of our SERS-based immunoassay are shown in Figure 1. There are three main components: (1) a capture substrate to specifically extract and concentrate antigens from solution; (2) surface functionalized gold nanoparticles (AuNPs) to bind to captured antigens selectively and generate intense SERS signals; and (3) SERS readout.14,15 This strategy exploits the strong SERS signal for organic compounds, i.e., Raman reporter molecules (RRMs), that are immobilized on AuNPs along with the appropriate detection antibody.14 We refer to these modified AuNPs as extrinsic Raman labels or ERLs. Using a sandwich immunosorbent assay, each antigen is identified by the characteristic SERS spectrum of the immobilized RRM and quantified by the corresponding SERS intensity. The advantages of this strategy largely reflect three unique features of SERS.20,26,27 First, the widths of Raman spectral bands are typically 10–100 times narrower than those of fluorescence, minimizing spectral overlap in the response from different RRMs and thus facilitating the detection of different ERLs at a single biochip address in multiplexed assays.28 Second, SERS intensities for RRMs can rival those of fluorescent dyes, which has enabled the detection of a single ERL nanoparticle using only a few seconds of signal acquisition.29 Third, only one excitation wavelength is needed to produce SERS from different RRMs, which simplifies the instrumental hardware required for signal generation and acquisition.
Figure 1.
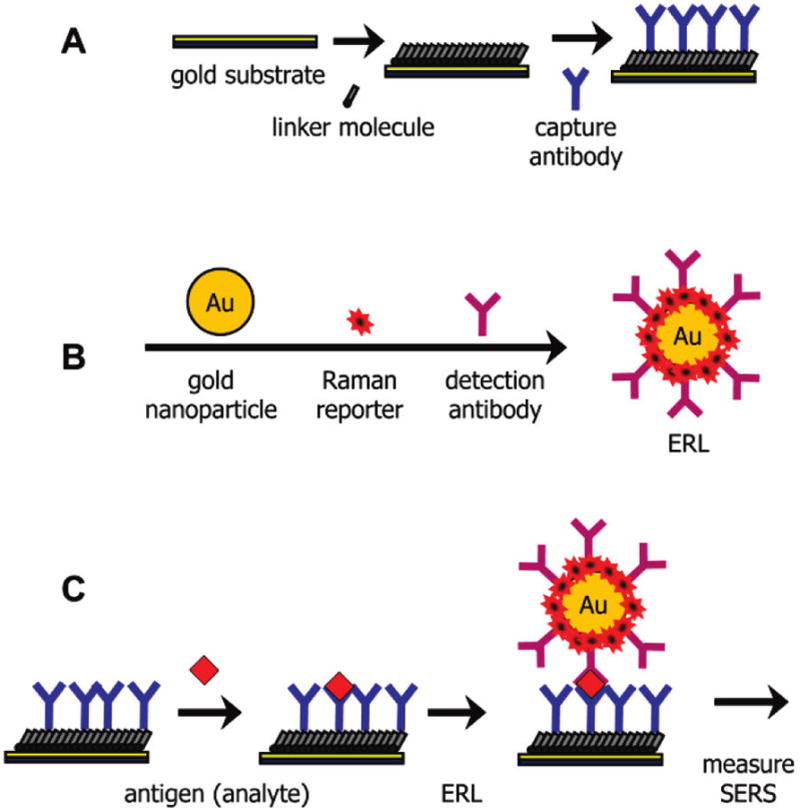
General SERS-based immunoassay chip design and assay scheme: (A) a capture substrate to specifically extract and concentrate antigens from solution; (B) surface functionalized gold nanoparticles (ERLs) to bind to captured antigens selectively and generate intense SERS signals; and (C) sandwich immunoassay with SERS readout.
SERS has five more features that make it attractive for use in diagnostics. First, stable AuNP suspensions with narrow, reproducible size distributions are readily available, engendering reproducible enhancement. Second, AuNPs can be readily modified by thiols and disulfides,30,31 providing versatility for ERL construction. Third, AuNPs require long wavelengths (i.e., red to near-infrared region) for effective SERS excitation, which reduces background interference from native fluorescence. Fourth, Raman scattering, in contrast to fluorescence, is not affected by quenchers (e.g., oxygen) and is less prone to photobleaching, facilitating its application in many sample matrixes and enabling extended signal averaging to lower detection limits. Fifth, recent breakthroughs have led to the development of high performance, portable Raman instruments at affordable prices,32 which facilitates movement into clinical settings.
This platform has several noteworthy features. First, we have eliminated the need for a reproducibly roughened surface, since in our approach the surface does not produce SERS. In fact, capture surfaces are constructed on template stripped gold (TSG) substrates.33 TSG is flat on an atomic scale and can be prepared with a high level of reproducibility. Importantly, TSG does not produce SERS. Our earlier work has shown that SERS is generated by the gold nanoparticles, which can also be prepared reproducibly, and this SERS is amplified by the close proximity of the TSG.34 That is, the plasmon oscillations of the particle, excited by the incident laser field, couple to free electrons in the TSG to produce an extremely large oscillating electric field that is scattered by the RRMs. Thus, in our SERS platform, the substrate is more than a passive support for capture antibodies. It also increases the SERS intensity by shifting the plasmon band of the gold nanoparticle labels into resonance with the excitation laser (633 nm). We recently detailed an in-depth investigation that supports this conclusion from both experimental and theoretical perspectives.34 Because SERS is enhanced by the gold substrate, there is no need to reproducibly form colloidal aggregation to generate SERS. Instead, each nanoparticle effectively produces a SERS “hot spot” on the smooth Au substrate through antibody–antigen interaction. The nanoparticles (ERLs) are well dispersed on the surface and show no evidence of large scale aggregation.29 Prior work has also established that there is a linear relationship between the analyte concentration (at low surface coverage) and the number of captured ERLs and also that there is a linear relationship between the number of captured ERLs and SERS intensity.29
Additional advantages in this strategy reflect the use of gold colloids in label development. First, each colloidal particle is coated with a large number of RRMs (103–104 depending on particle and RRM size). As such, the response of an individual binding event is markedly amplified. That is, each “hot spot” contains 103–104 scattering molecules. It is important to note that no SERS is observed that can be assigned to the antibodies that coat the particles. This is possibly due to the rapid drop in SERS intensity with increasing separation from the gold particle surface. Our design strategy for ERLs minimizes the distance between the gold nanoparticle surface and RRMs and, thus, maximizes scattering.
We have employed differing versions of this strategy in the low-level detection of proteins (e.g., immunoglobulin G14,28 and prostate-specific antigen,15,29), viruses (e.g., feline calicivirus38), bacteria (e.g., Mycobacterium avium subsp. paratuberculosis35,36), and small molecules (i.e., a Vitamin D metabolite).37 This paper describes the development of SERS-based sandwich immunoassays for the detection of MUC4 and CA19-9 and their application to the first ever measurement of MUC4 in patient sera. These assays used the same antibody for both capture and detection since both 8G7, the anti-MUC4 antibody, and the anti-CA19-9 antibody NS19-9 target repeating epitopes of the mucin molecules. The results show that MUC4 levels are significantly elevated in the sera of PC patients, indicating that MUC4 has the exciting potential to serve as a much needed serum marker for PC and its early stage diagnosis. These findings demonstrate that our SERS assay outperforms conventional assays (i.e., RIA and ELISA) with respect to limits of detection (~1000 × lower) and sample volume requirements (~10× lower). The potential of our SERS-based immunoassay platform to become an important addition to the clinical laboratory is also briefly discussed.
EXPERIMENTAL SECTION
Reagents
Gold nanoparticles (60 nm in diameter, 2.6 × 10¹⁰ particles/mL) were purchased from Ted Pella. Starting Block and borate buffer packs (50 mM) were acquired from Pierce Biotechnology. Octadecanethiol (ODT), sodium chloride, dithiobis- (succinimidyl proprionate) (DSP), dimethylsulfoxide (DMSO), phosphate buffered saline (PBS) packs (10 mM), and bovine serum albumin (BSA) were received from Sigma Aldrich. Two-part epoxy was from Epotek. 4-Nitrobenzenethiol (NBT) was obtained from Sigma Aldrich. All buffers were prepared in deionized water and then passed through a membrane filter with a 0.22 μm pore size.
The generation of anti-MUC4 monoclonal antibody 8G7 (reactive against the tandem repeat of MUC4) and isotype control anti-KLH antibody K2G6 has been described previously.9 The hybridoma for anti-CA19-9 antibody NS19-9 was procured from ATCC. All antibodies were purified from hybridoma supernatants using protein-G affinity columns. MUC4 positive (CD18/HPAF) and negative (MiaPaCa) PC cell lines were grown in Dulbecco’s modified eagle medium (DMEM) supplemented with 10% fetal bovine serum. Cell lysates were prepared from confluent cultures by lysing the cells in RIPA buffer (150 mM NaCl, 1.0% Nonidet P-40, 0.5% deoxycholate, 0.1% sodium dodecyl sulfate (SDS), 50 mM Tris, pH 8.0).
Serum samples were collected from patients following protocol approved by the Institutional Review Board (IRB) at the University of Nebraska Medical Center (Omaha, NE) and University of Pittsburgh (Pittsburgh, PA). Sera samples from healthy individuals, patients with pancreatitis, and patients with PC were pooled into respective categories (10 samples per pool).
Preparation of ERLs
ERLs were prepared by first forming a mixed thiol monolayer composed of DSP and NBT, followed by conjugation with the detection antibody.28 Briefly, a 1.0 mL suspension of AuNPs was first adjusted to pH 8.5 by adding 40 μL of 50 mM borate buffer. Next, 2.0 μL of freshly prepared 1.0 mM DSP in DMSO and 8.0 μL of 1.0 mM NBT solution in acetonitrile were mixed and added to the colloidal suspension. After reacting for 8 h, residual reactants were removed by centrifuging at 2000g for 10 min. The supernatant was carefully removed with a syringe, and the gold nanoparticles were resuspended in 2.0 mM borate buffer. Next, the colloidal suspension was incubated with 20 μg of antibody for 16 h, followed by exposure to 100 μL of 10% BSA for 8 h to block nonspecific binding sites. The suspension was then centrifuged, and after decanting the clear supernatant, the loose red sediment was resuspended in 1.0 mL of 2.0 mM borate buffer containing 1% BSA. The rinsing process was repeated two more times, and finally, the particles were resuspended in 0.5 mL of 2.0 mM borate buffer containing 1% BSA. An appropriate volume of 10% NaCl solution was added to yield a final NaCl concentration of 150 mM to stabilize the ERL solution and promote antibody–antigen binding. As a final step, the labeled nanoparticles were passed through a 0.22 μm syringe filter (Costar) to remove any large aggregates.
Preparation of Capture Substrates and Assay Procedures
The method for preparing the capture substrate and the assay protocol have been described.38 Briefly, the capture substrate was formed using template-stripped gold (TSG) as the support surface. To prepare TSG, silicon wafers (test grade, University Wafers) were first cleaned in ethanol and dried with a stream of high purity nitrogen gas. The cleaned wafer was then coated with a 250 nm gold film, deposited with an Edward 306A resistive evaporator. Glass microscope slides were cut into 1 × 1 cm chips and sonicated in diluted Contrad 70 (Micro, Cole-Parmer), deionized water, and ethanol, each for 30 min, and dried under a nitrogen stream. The cleaned glass chips were subsequently affixed to the gold-coated wafer with two-part epoxy (Epoxy Technology) and cured at 150 °C for 1.75 h. The glass chips were then gently detached from the silicon wafer, which exposes a smooth gold film on the topside of the glass chip.
Next, an ODT monolayer was stamped onto the TSG substrate to define the assay address on the chip. In this process, a polydimethylsiloxane (PDMS, Dow Corning) stamp with a centered, 3 mm diameter hole was immersed in 2 mM ODT for 1 min and dried under a stream of high purity nitrogen. The dried PDMS stamp was then gently pressed onto a TSG substrate for 30 s. This process leaves a 3 mm diameter uncoated gold area that is surrounded by a hydrophobic ODT monolayer, which acts to confine droplets of aqueous fluids. The substrate was then immersed in 0.1 mM DSP in ethanol for 16 h, rinsed with ethanol, and dried with high purity nitrogen gas, creating a 3 mm diameter DSP-coated address.
Capture antibodies (20 μL), diluted in 50 mM borate buffer (100 μg/mL, pH 8.5), were applied to the DSP-coated address and allowed to react for 8 h in a humidity chamber. This step forms a layer of capture antibodies that are coupled to the DSP monolayer through amide linkages formed between the amine groups on the protein and the succinimidyl ester of the DSP. The substrate was then rinsed with 10 mM PBS, followed by exposure to 20 μL of Starting Block blocking buffer for 16 h.
In a typical assay, capture substrates were exposed to 20 μL samples for 8 h in a humidity chamber. After rinsing with buffer (2 mM borate, 150 mM NaCl), captured antigens were labeled by exposing each address to 20 μL of the ERL suspension for 16 h. The substrates were then rinsed with buffer (2 mM borate, 150 mM NaCl), dried with a stream of high purity nitrogen, and analyzed by SERS.
SERS Measurement
The Raman spectra were collected with a NanoRaman I fiber-optic-based Raman system (Concurrent Analytical), a portable, field-deployable instrument. The light source was a 30 mW, 632.8 nm He–Ne laser. The spectrograph consisted of an f/2.0 Czerny-Turner imaging spectrometer (6–8 cm−1 resolution) and a Kodak 0401E CCD thermoelectrically cooled to 0 °C. The incident laser light was focused to a 25 μm spot on the substrate at normal incidence using an objective with a numerical aperture of 0.68. The power at the sample was ~3 mW. The same objective was used to collect the scattered radiation. In each measurement, the integration time was varied according to the signal strength. The analyte concentration was quantified using the peak intensity of the symmetric nitro stretch (vs(NO2)) of NTP at 1336 cm−1,39 averaged over 20 spectra, each collected from a different spot in the assay address.
MUC4 Sandwich ELISA
The amount of human mucin MUC4 was measured in CD18/HPAF lysate by sandwich ELISA. Briefly, 8 well enzyme immunoassay (EIA) strips (Costar) were coated with 100 μL of anti-MUC4 antibody 8G7 (6 μg/mL) diluted in carbonate buffer (pH 9.6). After overnight incubation, the strips were blocked with 3% BSA in PBS-T (0.05% Tween 20 and 0.01 M PBS, pH 7.2) for 2.5 h at 37 °C. After three washings with PBS-T, 100 μL of CD18/HPAF-10% (MUC4 positive pancreatic cancer cell line) and MiaPaCa (MUC4 negative cell line) cell lysate were plated in duplicates at 2-log dilutions. The ELISA plate containing antigen was incubated overnight at 4 °C followed by four washings with PBS-T. For detection of captured MUC4, the strips were incubated with 100 μL of 200 ng/mL of biotinylated 8G7 for 1 h at 37 °C. After five washings with PBS-T, strips were further incubated with 1:200 dilution of streptavidin–horseradish peroxidase (HRP) conjugate (R&D) for 20 min at room temperature. Finally, the reaction was developed by adding 100 μL of 3,3′,5,5′-tetramethylbenzidine (TMB) substrate solution (DAKO), and the reaction was stopped by adding 50 μL of 1 M sulfuric acid. EIA strips were read at 450 nm in an ELX-800 plate reader (Bio-Tek Instruments), and the data were analyzed using the SOFTMAX PRO software (Molecular Devices Corp., Sunnyvale, CA).
RESULTS AND DISCUSSION
Detection of MUC4 in Cell Lysates
As a starting point, we examined if the highly selective monoclonal antibody 8G7, which recognizes the polypeptide backbone of MUC4,9 continues to function when used in our SERS-based immunoassay platform. We qualitatively evaluated the reactivity of 8G7 by comparison to K2G6, an antibody that does not recognize any form of MUC4. Both monoclonal antibodies were prepared as 1.0 mg/mL solutions in PBS. We used cell lysates of MUC4 expressing cells (CD18/HPAF) as a source of MUC4 due to the lack of available purified MUC4. MUC4-negative cell lysates, MiaPaCa, were used as another control.
Figure 2 presents our initial findings. The images show 1 × 1 cm assay chips (triplicate measurements, i.e., Trials 1, 2, and 3) after exposure to the lysates and ERL labeling. The chips in the first column, which were coated with 8G7 and incubated with CD18/HPAF, have clearly bound a layer of 8G7-coated ERLs. The red appearance in the circular active area of each chip suggests a significant amount of MUC4 was captured and then tagged with ERLs. This conclusion is supported by the two control assays. In the middle column, 8G7 capture substrates were incubated with MiaPaCa, a MUC4-free cell lysate, and 8G7-coated ERLs. In the right column, K2G6, an isotype control antibody, which does not recognize any form of MUC4, was used to prepare the capture substrate and ERLs, while the sample was MUC4-containing CD18/HPAF. In both controls, the fainter color of the assay address indicates the amount of ERL binding is clearly much lower than that in the first column and is attributed to nonspecific binding. It is, therefore, evident that antibody 8G7 preferentially detects MUC4 in CD18/HPAF lysates, compared to the K2G6 antibody, and specifically binds to MUC4 expressed by CD18/HPAF cells compared to MiaPaCa lysate, which does not contain MUC4. These results establish that 8G7 can be attached to nanoparticles and retain its specificity for MUC4 detection in a sandwich immunoassay format, both of which are necessary for our SERS-based assay.
Figure 2.
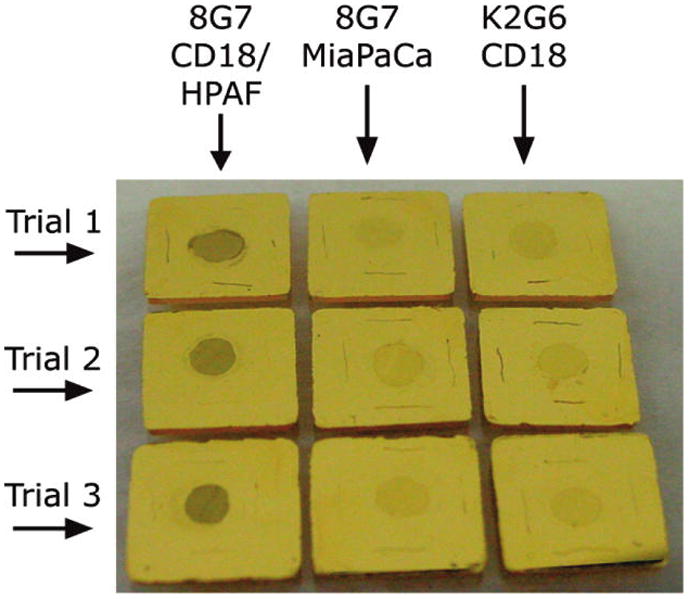
Photograph of sandwich immunoassays (colored circular area) on gold chips demonstrating visually the specificity of the nanoparticle-based assay scheme. Each assay employed the same antibody (i.e., 8G7 or K2G6) for capture and detection. The three trials are replicates of the three different assays. Left: anti-MUC4 antibody (8G7) with CD18/HPAF cell lysate (positive control). Middle: anti-MUC4 antibody (8G7) with MiaPaCa cell lysate (negative control). Right: isotype control antibody (K2G6) with CD18/HPAF cell lysate.
We next evaluated the ability to quantitate MUC4 levels using SERS readout and the 8G7 antibody. For this, we measured the SERS response of samples consisting of serial dilutions of CD18/HPAF lysates in PBS. Figure 3A shows the SERS spectra acquired using signal integration times of 2 s for 0.0–0.1 μg/mL samples, 0.5 s for 1 μg/mL, and 0.25 s for 10–100 μg/mL samples. Note that the MUC4 content is presented as total protein concentration in cell lysates since the level of MUC4 in the lysates is not known. At low concentrations (<10 ng/mL CD18/HPAF total cell lysate), the spectra are devoid of vibrational features. At higher concentrations, bands characteristics of the RRM, 4-nitrobenzenethiolate, become evident and increase in intensity with increasing protein concentration. Importantly, all observed spectral features can be assigned to the RRM. That is, there is no evidence of enhanced Raman scattering from other lysate components
Figure 3.

SERS-based assay for MUC4 in PBS buffer. (A) SERS spectra acquired at various CD18/HPAF cell lysate concentrations, offset vertically for clarity. (B) Dose–response curve for MUC4 in PBS buffer prepared by serially diluting CD18/HPAF cell lysates in PBS buffer. Error bars are from 20 measurements at a single address for each concentration. (C) Low concentration range on a linear scale. Data points are the average of three separate assays, and the error bars are their standard deviations.
The results were further analyzed by plotting the intensity of vs(NO2) at 1336 cm−1 as a function of the logarithm of total protein concentration (10 ng/mL to 100 μg/mL), generating the response curve in Figure 3B The response increases linearly as the protein concentration varies from 0.01 to 10 μg/mL and then begins to level off (Figure 3B), owing to the onset of capture substrate saturation. The linearity (r2 = 0.9988) is seen more easily in Figure 3C, which shows the 0–1 μg/mL range on a linear concentration scale, along with the linear regression line. The limit of detection (LOD), defined as the analyte concentration that produces a signal three times larger than the standard deviation of blank measurements, is 33 ng/mL total lysate protein, which corresponds to a 30 000-fold dilution of the original lysate.
The error bars in Figure 3B were derived from 20 randomly selected spots in a single chip address and give an indication of reproducibility of the response across the capture surface. This reproducibility is presented in greater detail in Figure 4, which shows 20 individual readings from 20 random spots in one address on four different assay chips, with each chip exposed to a different concentration of cell lysate (10, 1, 0.1, and 0.0 μg/mL total lysate protein, acquired using 0.25, 0.5, 2, and 2 s integration times, respectively). The mean intensities and standard deviations are 62300 ± 3700, 26100 ± 2000, 2380 ± 750, and 172 ± 260 cps for measurements of the 10, 1, 0.1, and 0.0 μg/mL solutions, respectively. The corresponding relative standard deviations are 6, 8, 32, and 149%. As expected for a counting experiment, the relative standard deviation decreases as the number of counts increases. The highest relative variability is in the blank signal, which is due to a low level of nonspecific binding. Because the LOD is directly proportional to the variability of blank measurement, this nonspecific binding sets the lower limit to the amount of MUC4 that can be detected. A measurement of a chip that was not exposed to nanoparticles has no SERS spectrum, and the standard deviation of the baseline is only 2 cps. This implies that the LOD would be less than 1 ng/mL if there were no nonspecific binding and indicates one potential means for improving the assay. These data are consistent with our earlier atomic force microscopy (AFM) work, which showed developed assay surfaces are covered by individual nanoparticles whose surface concentration increases as analyte increases.29
Figure 4.
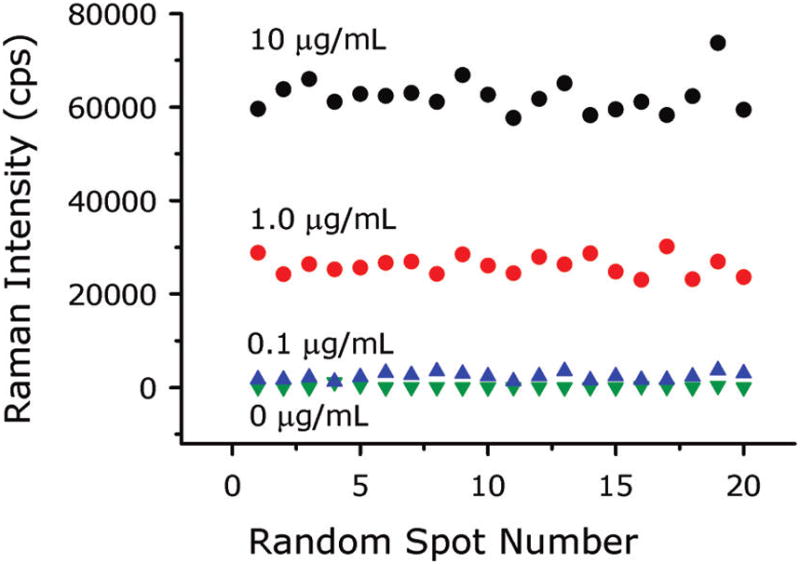
Readings from 20 random spots in one address on three assay chips showing the uniformity of the signal in each address. Each chip was exposed to a different CD18/HPAF lysate total protein concentration.
The error bars in Figure 3C were calculated from the mean intensities of three separate assays, run at approximately 2 month intervals. The resulting means of the means and standard deviations are 19300 ± 1400, 1440 ± 540, 279 ± 130, and 268 ± 130 cps for 1, 0.1, 0.01, and 0.0 μg/mL solutions, respectively. The corresponding relative standard deviations are 7, 38, 45, and 50%. These results are very similar to variability observed across individual addresses.
Detection of MUC4 in Cell Lysates Using ELISA
As mentioned, we have been unable to detect MUC4 in serum using standard ELISA with the 8G7 antibody. However, we are able to measure MUC4 in CD18/HPAF lysates, and a comparison of these results to the SERS findings shows that the SERS method has a much lower LOD. In Figure 5 are shown the ELISA results for serial dilutions of MUC4-containing CD18/HPAF lysates and MUC4-devoid MiaPaCa lysates. We see that the MiaPaCa lysates produce no signal (r2 = 0.0972) while the CD18/HPAF lysates produce a linear response over this concentration range with a slope of 0.0025 AU/μg/mL (r2 = 0.9974). The LOD, estimated from the standard deviation in the lowest concentration (31 μg/mL) measurements, is 30 μg/mL. This is approximately 1000 × higher than the LOD of the SERS method. This is a large difference given that both methods use the same antibody for both capture and detection of MUC4 in a sandwich format. For comparison, we typically obtained an LOD for mouse IgG of 0.3 ng/mL,28 compared to around 10 ng/mL for commercial ELISA kits,40 or about a 30 × improvement. Future work will include a more careful determination of the ELISA LOD and an examination of the differences in assay conditions to try to identify the reason for the large difference in detection limits between the two methods. Also, because of the MUC4 tandem repeats, multiple ERL antibody molecules may be involved in the capture of the nanoparticles, i.e., an ERL can be thought of as a multivalent antibody and the antigen contains multiple epitopes. This could increase the binding constant of the ERLs to the antigen by several orders of magnitude compared to a single antibody–antigen binding event. Multiple binding is even possible between ERLs and IgG molecules and may be responsible for the improved SERS assay sensitivity we consistently observe with those antigens. With the tandem repeats of MUC4, such an effect would be expected to be even greater. This topic is currently being investigated.
Figure 5.

ELISA measurements of CD18/HPAF (positive control) and MiaPaCa (negative control) lysates.
Detection of CA19-9 in Cell Lysates
There is at present no MUC4 standard reference material for determining the concentration of MUC4 in the lysates. However, commercial assays for measuring the cancer antigen CA19-9 in serum are available. CA19-9 is a carbohydrate epitope, Sialyl Lewis a, which was identified by its reactivity with the monoclonal antibody NS19-9 antibody raised against a colon cancer cell line.41,42 It is predominantly used to monitor the disease status in patients with confirmed pancreatic cancer. The ability to measure CA19-9 was, therefore, chosen as an indication of the performance of our SERS-based immunoassay. For this, a SERS-based assay was prepared using the monoclonal antibody NS19-9 for modifying both the capture substrate and ERLs. This assay was then tested with the same cell lysate (CD18/HPAF) used in developing our MUC4 assay. The response curve is shown in Figure 6 and has a profile similar to that found for MUC4 in Figure 3B. The signal integration times were 3 s for the 0.0, 0.01, and 0.1 μg/mL samples and 0.5 s for the 1.0, 10, and 100 μg/mL samples. The assay has an LOD of 27 ng/mL of total cell protein, a 37 000-fold dilution of the lysate. These values are comparable to those for MUC4 detection in cell lysate, which suggests our SERS platform not only opens the way for the facile determination of MUC4 in serum but also can serve as an alternative platform for CA19-9 measurements. To explore this possibility in more detail, tests were run on CA19-9 standard solutions using the SERS-based assay.
Figure 6.

Response curve for a SERS-based immunoassay for CA19-9 in PBS buffer.
SERS-Based Measurements of CA19-9 Standards
To quantify the analytical figures of merit (i.e., response curve and LOD) of our SERS assay in terms of detectable CA19-9 concentration, rather than total protein levels or dilution factors, measurements were of the standard solutions provided in an RIA kit for CA19-9 (Fujirebio Diagnostics, Inc.). The kit contains six CA19-9 standards (0, 15, 30, 60, 120, and 240 U/mL, where the unit U stands for an arbitrary value related to a reference standard maintained by Fujirebio Diagnostics, Inc.) and has an established a cutoff of 37 U/mL for discriminating patients with pancreatic cancer from normal individuals or those with benign diseases. Since determining the LOD of our SERS method requires measurements in the low concentration range, all standards were diluted in PBS at a ratio of 1:20 before being applied to the assay chips. No effort was made to optimize this assay. The resulting response curve (r2 = 0.9961), shown in Figure 7 (1 s signal integration), has an LOD of 0.8 U/mL CA19-9 (calculated using two times the standard deviation of the blank measurements to be consistent with the RIA kit). This LOD is well below the 37 U/mL cutoff and about the same as the RIA kit LOD of 1 U/mL. However, our SERS measurements were made on 1:20 dilutions of the standards, using only 20 μL from each dilution. In contrast, the RIA requires 200 μL samples at a 1:2 dilution. Thus, the lowest absolute amount of CA19-9 that can be detected is ~100 times lower for the SERS assay compared to RIA. In addition, RIA uses a 60 s counting time, whereas readout with our SERS assay takes only a few seconds. Therefore, these initial evaluations show the SERS-based assay is more sensitive, has faster readout, and requires less sample compared to RIA. Moreover, our assay does not generate radioactive waste.
Figure 7.
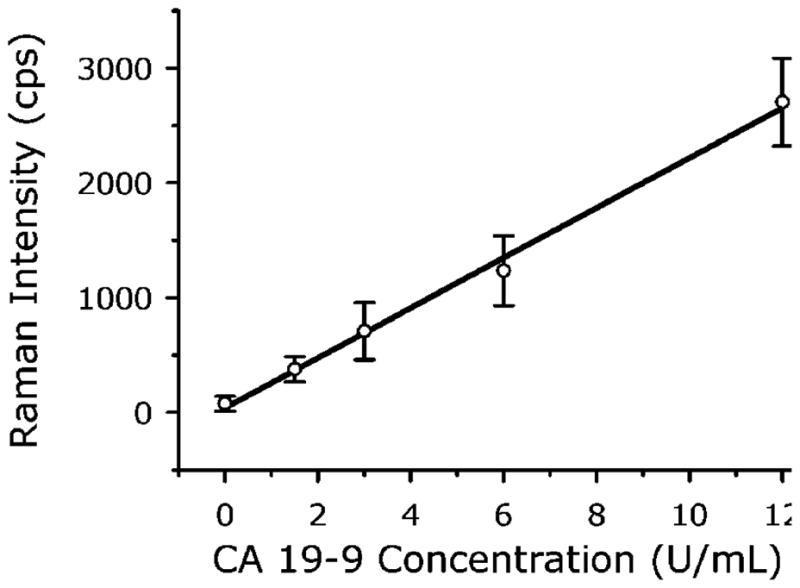
Measurement of CA19-9 standards using a SERS-based immunoassay. CA19-9 standard solutions were diluted in PBS at a ratio of 1:20 before being applied to the assay chip. The solid line is the linear regression of the data.
Detection of MUC4 in Pooled Serum Samples
On the basis of these encouraging results, we then applied our SERS-based assay to the detection of MUC4 in the sera of PC patients. Five sets of pooled sera samples were analyzed after a 20-fold dilution in PBS: one pool from healthy individuals, labeled “Normal”, one pool from patients with acute pancreatitis, labeled “P”, and three pools from PC patients, labeled “PC1”, “PC2”, and “PC3”. Each sample contained the pooled sera from 10 individuals. Each pooled sample was analyzed on three separate chips (3 s signal integration), and the averages and standard deviations of the three measurements are summarized in Figure 8A.
Figure 8.
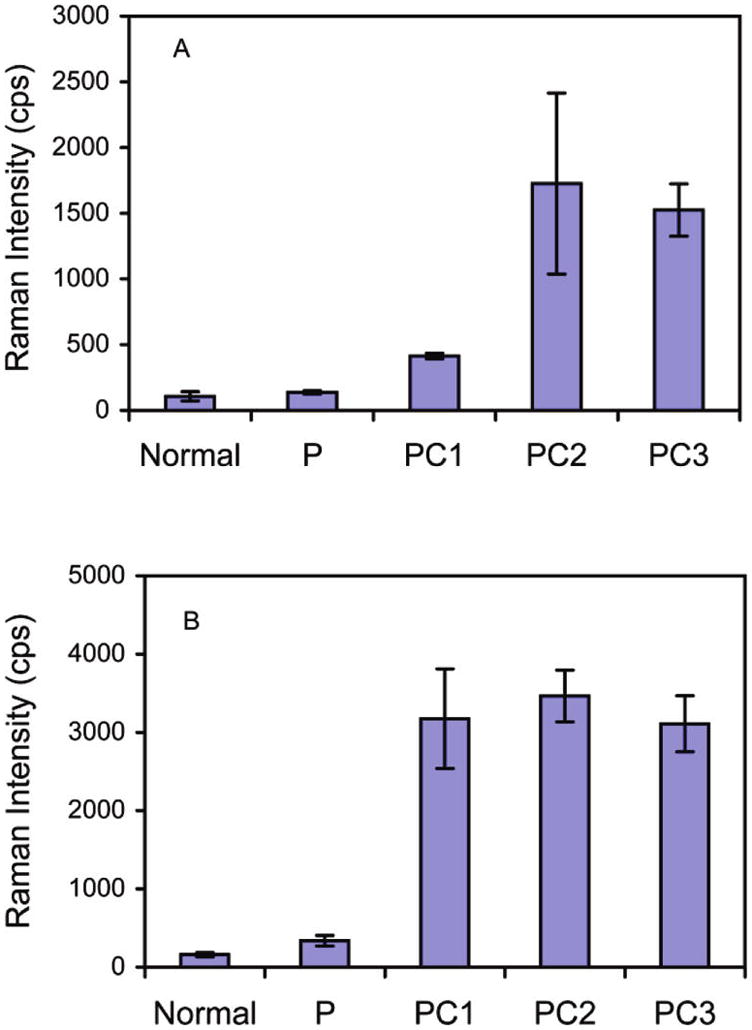
SERS detection of (A) MUC4 and (B) CA19-9 in pooled sera from normal individuals and patients with pancreatitis (P) or pancreatic cancer (PC1, PC2, and PC3). Each pool includes sera from 10 individuals.
As can be seen in Figure 8A, the pooled sera of PC patients produced significantly higher responses than the normal sera (P < 0.001). It is important to mention that our previous attempts using conventional methods like ELISA (direct, sandwich, and competitive) and RIA failed to detect MUC4 in sera samples. These results, therefore, represent an important first step toward demonstrating the feasibility and utility of SERS in detecting low levels of mucins in serum.
Figure 8A also shows that the sera from patients with acute pancreatitis produced readings that were not significantly different from the levels found in normal sera (P = 0.768) but are significantly lower than PC sera levels (P < 0.001). These data indicate that the level of MUC4 in serum can potentially serve as a marker to distinguish cancer from benign disease.
We also made an initial comparison of MUC4 and CA19-9 detection by SERS in the same set of pooled sera. The CA19-9 results are shown in Figure 8B (3 s signal integration). A trend similar to the MUC4 assay was observed, i.e., the response of the pooled sera from pancreatic patients was significantly larger (P < 0.001) than that of normal individuals and acute pancreatitis patients. These data show that our immunoassay approach based on SERS can be used with established antibodies with comparable or better results than those obtained using conventional readout strategies. These findings also highlight the potential of our SERS platform to concurrently detect multiple cancer markers if configured for multiplexing, as demonstrated recently.31
CONCLUSIONS
The results from our pilot study show that we have successfully developed a SERS-based immunoassay for MUC4 in human serum. This is significant because our previous attempts using conventional methods like ELISA (direct, sandwich, or competitive) and RIA all failed to detect MUC4 in human sera. Thus, for the first time, it is possible to quantitatively measure MUC4 levels in the sera of PC patients for diagnostic and prognostic purposes. Our result shows that sera pools from PC patients produced a significantly higher response in the assays than the sera from normal patients and those with benign diseases, which is consistent with previous studies that have shown MUC4 to be a specific marker for PC.8
We have also demonstrated that the SERS immunoassay platform can be readily adapted to detect other cancer markers. This suggests the possibility of developing an assay for the concurrent measurement of multiple markers, each tagged with a spectrally unique reporter molecule. Combining the measurements of different markers may reveal patterns of expression with improved diagnostic sensitivity and specificity. Improvements of the assay, now underway, are focusing on optimizing the assay conditions, reducing nonspecific binding, expediting the assay time, and extending the study to a large number of individual samples, automation, and multiplexing.
Acknowledgments
This work was supported by a seed funding from the University of Nebraska Medical Center and Ames Laboratory, U.S. D.O.E, Iowa State University, and in part, by the grants from Department of Defense (BC097421) and National Institutes of Health (EDRN UO1 CA111294, RO1 CA131944). The Ames Laboratory is operated by Iowa State University under Contract Number DE-AC02-07CH11358.
Contributor Information
Gufeng Wang, Iowa State University, Ames, Iowa, United States.
Robert J. Lipert, Iowa State University, Ames, Iowa, United States.
Maneesh Jain, University of Nebraska Medical Center, Omaha, Nebraska, United States.
Sukhwinder Kaur, University of Nebraska Medical Center, Omaha, Nebraska, United States.
Subhankar Chakraboty, University of Nebraska Medical Center, Omaha, Nebraska, United States.
Maria P. Torres, University of Nebraska Medical Center, Omaha, Nebraska, United States
Surinder K. Batra, University of Nebraska Medical Center, Omaha, Nebraska, United States.
Randall E. Brand, University of Pittsburgh Medical Center, Pittsburgh, Pennsylvania, United States
Marc D. Porter, University of Utah, Salt Lake City, Utah, United States
References
- 1.Jemal A, Siegel R, Xu J, Ward E. CA Cancer J Clin. 2010;60:277–300. doi: 10.3322/caac.20073. [DOI] [PubMed] [Google Scholar]
- 2.Sharma S. Indian J Med Pediatr Oncol. 2009;30:1–8. doi: 10.4103/0971-5851.56328. [DOI] [PMC free article] [PubMed] [Google Scholar]
- 3.Kufe DW. Nat Rev Cancer. 2009;9:874–885. doi: 10.1038/nrc2761. [DOI] [PMC free article] [PubMed] [Google Scholar]
- 4.Okusaka T, Okada S, Sato T, Wakasugi H, Saisho H, Furuse J, Ishikawa O, Matsuno S, Yokoyama S. Hepatogastroenterology. 1998;45:867–872. [PubMed] [Google Scholar]
- 5.Adamek HE, Albert J, Breer H, Weitz M, Schilling D, Riemann JF. Lancet. 2000;356:190–193. doi: 10.1016/S0140-6736(00)02479-X. [DOI] [PubMed] [Google Scholar]
- 6.Eskelinen MJ, Haglund UH. Eur J Surg. 1999;165:292–306. doi: 10.1080/110241599750006811. [DOI] [PubMed] [Google Scholar]
- 7.Daram SR. South Med J. 2006;99:205. doi: 10.1097/01.smj.0000204525.62861.85. [DOI] [PubMed] [Google Scholar]
- 8.Andrianifahanana M, Moniaux N, Schmied BM, Ringel J, Friess H, Hollingsworth MA, Buchler MW, Aubert JP, Batra SK. Clin Cancer Res. 2001;7:4033–4040. [PubMed] [Google Scholar]
- 9.Moniaux N, Varshney GC, Chauhan SC, Copin MC, Jain M, Wittel UA, Andrianifahanana M, Aubert JP, Batra SK. J Histochem Cytochem. 2004;52:253–261. doi: 10.1177/002215540405200213. [DOI] [PubMed] [Google Scholar]
- 10.Park HU, Kim JW, Kim GE, Bae HI, Crawley SC, Yang SC, Gum JR, Jr, Batra SK, Rousseau K, Swallow DM, Sleisenger MH, Kim YS. Pancreas. 2003;26:e48–54. doi: 10.1097/00006676-200304000-00022. [DOI] [PubMed] [Google Scholar]
- 11.Swartz MJ, Batra SK, Varshney GC, Hollingsworth MA, Yeo CJ, Cameron JL, Wilentz RE, Hruban RH, Argani P. Am J Clin Pathol. 2002;117:791–796. doi: 10.1309/7Y7N-M1WM-R0YK-M2VA. [DOI] [PubMed] [Google Scholar]
- 12.Saitou M, Goto M, Horinouchi M, Tamada S, Nagata K, Hamada T, Osako M, Takao S, Batra SK, Aikou T, Imai K, Yonezawa S. J Clin Pathol. 2005;58:845–852. doi: 10.1136/jcp.2004.023572. [DOI] [PMC free article] [PubMed] [Google Scholar]
- 13.Jhala N, Jhala D, Vickers SM, Eltoum I, Batra SK, Manne U, Eloubeidi M, Jones JJ, Grizzle WE. Am J Clin Pathol. 2006;126:572–579. doi: 10.1309/cev30be088cbdqd9. [DOI] [PubMed] [Google Scholar]
- 14.Ni J, Lipert RJ, Dawson GB, Porter MD. Anal Chem. 1999;71:4903–4908. doi: 10.1021/ac990616a. [DOI] [PubMed] [Google Scholar]
- 15.Grubisha DS, Lipert RJ, Park HY, Driskell J, Porter MD. Anal Chem. 2003;75:5936–5943. doi: 10.1021/ac034356f. [DOI] [PubMed] [Google Scholar]
- 16.Kneipp K, Harrison GR, Emory SR, Nie SM. Chimia. 1999;53:35–37. [Google Scholar]
- 17.Kneipp K, Kneipp H, Itzkan I, Dasari RR, Feld MS. J Phys: Condens Matter. 2002;14:R597–R624. [Google Scholar]
- 18.Kneipp K, Wang Y, Kneipp H, Perelman LT, Itzkan I, Dasari RR, Feld MS. Phys Rev Lett. 1997;78:1667–1670. [Google Scholar]
- 19.Schatz GC, Young MA, Van Duyne RP. Top Appl Phys. 2006;103:19–46. [Google Scholar]
- 20.Graham D, Mallinder BJ, Smith WE. Angew Chem, Int Ed. 2000;39:1061–1063. doi: 10.1002/(sici)1521-3773(20000317)39:6<1061::aid-anie1061>3.0.co;2-9. [DOI] [PubMed] [Google Scholar]
- 21.Faulds K, Barbagallo RP, Keer JT, Smith WE, Graham D. Analyst. 2004;129:567–568. doi: 10.1039/b406423b. [DOI] [PubMed] [Google Scholar]
- 22.Faulds K, Littleford RE, Graham D, Dent G, Smith WE. Anal Chem. 2004;76:592–598. doi: 10.1021/ac035053o. [DOI] [PubMed] [Google Scholar]
- 23.Graham D, Mallinder BJ, Whitcombe D, Smith WE. ChemPhysChem. 2001;2:746–748. doi: 10.1002/1439-7641(20011217)2:12<746::AID-CPHC746>3.0.CO;2-Q. [DOI] [PubMed] [Google Scholar]
- 24.Graham D, Mallinder BJ, Whitcombe D, Watson ND, Smith WE. Anal Chem. 2002;74:1069–1074. doi: 10.1021/ac0155456. [DOI] [PubMed] [Google Scholar]
- 25.Rohr TE, Cotton T, Fan N, Tarcha PJ. Anal Biochem. 1989;182:388–398. doi: 10.1016/0003-2697(89)90613-1. [DOI] [PubMed] [Google Scholar]
- 26.Emory SR, Nie S. J Phys Chem B. 1998;102:493–497. [Google Scholar]
- 27.Keating CD, Kovaleski KM, Natan MJ. J Phys Chem B. 1998;102:9404–9413. [Google Scholar]
- 28.Wang GF, Park HY, Lipert RJ. Anal Chem. 2009;81:9643–9650. doi: 10.1021/ac901711f. [DOI] [PubMed] [Google Scholar]
- 29.Park H-Y, Lipert RJ, Porter MD. Proc SPIE-Nanosensing: Mater Devices. 2004;5593:464–465. [Google Scholar]
- 30.Shipway AN, Katz E, Willner I. ChemPhysChem. 2000;1:18–52. doi: 10.1002/1439-7641(20000804)1:1<18::AID-CPHC18>3.0.CO;2-L. [DOI] [PubMed] [Google Scholar]
- 31.Zhong CJ, Porter MD. Anal Chem. 1995;67:709A–715A. [Google Scholar]
- 32.Park HY, Driskell JD, Kwarta KM, Lipert RJ, Porter MD, Schoen C, Neill JD, Ridpath JF. Top Appl Phys. 2006;103:427–446. [Google Scholar]
- 33.Stamou D, Gourdon D, Liley M, Burnham NA, Kulik A, Vogel H, Duschl C. Langmuir. 1997;13:2425–2428. [Google Scholar]
- 34.Driskell JD, Lipert RJ, Porter MD. J Phys Chem B. 2006;110:17444–17451. doi: 10.1021/jp0636930. [DOI] [PubMed] [Google Scholar]
- 35.Yakes BJ, Lipert RJ, Bannantine JP, Porter MD. Clin Vaccine Immunol. 2008;15:227–234. doi: 10.1128/CVI.00334-07. [DOI] [PMC free article] [PubMed] [Google Scholar]
- 36.Yakes BJ, Lipert RJ, Bannantine JP, Porter MD. Clin Vaccine Immunol. 2008;15:235–242. doi: 10.1128/CVI.00335-07. [DOI] [PMC free article] [PubMed] [Google Scholar]
- 37.Dufek EJ, Ehlert B, Granger MC, Sandrock TM, Legge SL, Herrmann MG, Meikle AW, Porter MD. Analyst. 2010;135:2811–2817. doi: 10.1039/c0an00354a. [DOI] [PubMed] [Google Scholar]
- 38.Driskell JD, Kwarta KM, Lipert RJ, Porter MD, Neill JD, Ridpath JF. Anal Chem. 2005;77:6147–6154. doi: 10.1021/ac0504159. [DOI] [PubMed] [Google Scholar]
- 39.Varsanyi G. Assignments for Vibrational Spectra of Seven Hundred Benzene Derivatives. John Wiley & Sons; New York: 1974. [Google Scholar]
- 40.Roche Diagnostics GmbH. Mouse-IgG ELISA. 2009 June; www.roche-applied-science.com, Version.
- 41.Koprowski H, Herlyn M, Steplewski Z, Sears HF. Science. 1981;212:53–55. doi: 10.1126/science.6163212. [DOI] [PubMed] [Google Scholar]
- 42.Ugorski M, Laskowska A. Acta Biochim Pol. 2002;49:303–311. [PubMed] [Google Scholar]