Abstract
Ca2+-activated Cl− channels (CaCCs) are involved in several physiological processes. Recently, TMEM16A/anoctamin1 and TMEM16B/anoctamin2 have been shown to function as CaCCs, but very little information is available on the structure–function relations of these channels. TMEM16B is expressed in the cilia of olfactory sensory neurons, in microvilli of vomeronasal sensory neurons, and in the synaptic terminals of retinal photoreceptors. Here, we have performed the first site-directed mutagenesis study on TMEM16B to understand the molecular mechanisms of voltage and Ca2+ dependence. We have mutated amino acids in the first putative intracellular loop and measured the properties of the wild-type and mutant TMEM16B channels expressed in HEK 293T cells using the whole cell voltage-clamp technique in the presence of various intracellular Ca2+ concentrations. We mutated E367 into glutamine or deleted the five consecutive glutamates 386EEEEE390 and 399EYE401. The EYE deletion did not significantly modify the apparent Ca2+ dependence nor the voltage dependence of channel activation. E367Q and deletion of the five glutamates did not greatly affect the apparent Ca2+ affinity but modified the voltage dependence, shifting the conductance–voltage relations toward more positive voltages. These findings indicate that glutamates E367 and 386EEEEE390 in the first intracellular putative loop play an important role in the voltage dependence of TMEM16B, thus providing an initial structure–function study for this channel.
INTRODUCTION
Ca2+-activated Cl− channels (CaCCs) are expressed in many cell types, where they play various physiological roles. For example, CaCCs are involved in fast block of polyspermy in Xenopus laevis oocytes, in the regulation of smooth muscle contraction, in fluid secretion from exocrine glands, in the control of excitability in cardiac myocytes, as well as in olfactory, taste, and phototransduction (Frings et al., 2000; Hartzell et al., 2005; Leblanc et al., 2005; Petersen, 2005; Wray et al., 2005; Bers, 2008; Kleene, 2008; Lalonde et al., 2008; Petersen and Tepikin, 2008; Duran et al., 2010; Kunzelmann et al., 2011a).
Despite the fact that CaCCs are broadly present in several tissues, their molecular identity had remained elusive until 2008, when three independent studies reported that the expression of TMEM16A/anoctamin1 was associated with CaCCs (Caputo et al., 2008; Schroeder et al., 2008; Yang et al., 2008). The TMEM16 family comprises 10 members, and another member of the family, TMEM16B/anoctamin2, has also been shown to function as a CaCC when heterologously expressed in axolotl oocytes (Schroeder et al., 2008) or in HEK 293T cells (Pifferi et al., 2009; Stephan et al., 2009; Stöhr et al., 2009; Rasche et al., 2010; Sagheddu et al., 2010).
The study of knockout mice for TMEM16A (Rock and Harfe, 2008) and for TMEM16B (Billig et al., 2011) further confirmed that CaCC activity was reduced or abolished in several cells (Flores et al., 2009; Galietta, 2009; Hartzell et al., 2009; Kunzelmann et al., 2011b, 2012; Huang et al., 2012; Pifferi et al., 2012; Sanders et al., 2012; Scudieri et al., 2012).
Hydropathy analysis indicates that TMEM16 proteins have eight putative transmembrane domains with both N- and C-terminal domains located at the intracellular side of the membrane, and the predicted topology has been experimentally confirmed for TMEM16G/anoctamin7 (Das et al., 2008). At present, TMEM16A and TMEM16B have been shown to function as CaCCs, whereas it is unclear whether the other members of the family are CaCCs (Duran and Hartzell, 2011; Huang et al., 2012; Scudieri et al., 2012). Furthermore, splice variants have been identified both for TMEM16A (Caputo et al., 2008; Ferrera et al., 2009, 2011) and for TMEM16B (Stephan et al., 2009). However, although the functional properties of different isoforms have been extensively investigated for TMEM16A, only preliminary data have been presented for TMEM16B (Saidu, S.P., A.B. Stephan, S.M. Caraballo, H. Zhao, and J. Reisert. 2010. Association for Chemoreception Sciences Meeting. Abstr. P68).
At present, very little is known about the structure–function relations for these channels. The analysis of the sequence of TMEM16A and TMEM16B did not reveal any canonical voltage-sensing or Ca2+-binding domains (Yang et al., 2008), but a comparison among the biophysical properties of the TMEM16A splice variants pointed to the functional relevance of the first putative intracellular loop (Caputo et al., 2008; Ferrera et al., 2009, 2011). Moreover, a recent study performed site-directed mutagenesis experiments on TMEM16A modifying some amino acids in the first putative intracellular loop and found that deletion of EAVK affected both the Ca2+ and voltage dependence of TMEM16A (Xiao et al., 2011).
Here, we aimed to perform a first site-directed mutagenesis investigation of TMEM16B to contribute to the understanding of the molecular mechanisms underlying the channel voltage and Ca2+ dependence. We identified some acidic amino acids in the first intracellular loop of TMEM16B (367E, 386EEEEE390, 399EYE401), which are conserved in TMEM16A, where some of them have been studied (Xiao et al., 2011). We mutated or deleted the indicated glutamates and made a comparison between the electrophysiological properties measured in the whole cell configuration of the wild-type (WT) TMEM16B and its mutants. We have found that 367E and 386EEEEE390 contribute to the voltage-dependent regulation of the TMEM16B channel.
MATERIALS AND METHODS
Site-directed mutagenesis of TMEM16B and heterologous expression
Full-length mouse TMEM16B cDNA in pCMV-Sport6 mammalian expression plasmid was obtained from RZPD (clone identification, IRAVp968H1167D; NCBI Protein database accession no. NP_705817.1). Mutations were made using a PCR-based site-directed mutagenesis kit (Gene Tailor; Invitrogen) and confirmed by DNA sequencing. HEK 293T cells (American Type Culture Collection) were transfected with 2 µg TMEM16B by using transfection reagent (FuGENE 6; Roche). Cells were cotransfected with 0.2 µg enhanced green fluorescent protein (eGFP; Takara Bio Inc.) for fluorescent identification of transfected cells. After 24 h, transfected cells were replated at a lower density and used for patch-clamp experiments between 48 and 72 h from transfection.
Electrophysiological recordings and ionic solutions
Current recordings from HEK 293T cells expressing TMEM16B or its mutants were performed in the whole cell voltage-clamp configuration, as described previously (Pifferi et al., 2006, 2009). Patch pipettes were made of borosilicate glass (World Precision Instruments, Inc.) and pulled with a PP-830 puller (Narishige). Patch pipettes filled with the intracellular solution had a resistance of ∼3–5 MΩ when immersed in the bath solution. Currents were recorded with an Axopatch 1D or Axopatch 200B amplifier controlled by Clampex 9 or 10 via a Digidata 1332A or 1440 (Molecular Devices). Data were low-pass filtered at 5 kHz and sampled at 10 kHz. Experiments were performed at room temperature (20–25°C). As reported previously (Pifferi et al., 2006), control experiments in nontransfected and only eGFP-transfected cells did not show any significant Ca2+-activated current.
The standard extracellular solution contained (in mM): 140 NaCl, 5 KCl, 2 CaCl2, 1 MgCl2, 10 glucose, and 10 HEPES, adjusted to pH 7.4 with NaOH. The intracellular solution filling the patch pipette contained (in mM): 140 CsCl, 10 HEPES, and 10 HEDTA, adjusted to pH 7.2 with CsOH, and no added Ca2+ for the nominally 0 Ca2+ solution, or various added Ca2+ concentrations, as calculated with the program WinMAXC (Patton et al., 2004), to obtain free Ca2+ in the range between 0.5 and 100 µM. The free Ca2+ concentrations were experimentally determined by Fura-4F (Invitrogen) measurements by using a luminescence spectrophotometer (LS-50B; PerkinElmer), as described previously (Pifferi et al., 2006). The total Cl− concentration was 158 mM in the extracellular solution, whereas in the pipette solution it ranged from 140 mM in 0 Ca2+ to 160 mM in 100 µM Ca2+, with a calculated equilibrium potential for Cl− of −1.5 and +1.9 mV, respectively. All chemicals, unless otherwise stated, were purchased from Sigma-Aldrich.
In most experiments, we applied voltage steps of 200-ms duration from a holding potential of 0 mV ranging from −100 to +100 mV (or from −200 to +200 mV), followed by a step to −100 mV. A single-exponential function was fitted to tail currents to extrapolate the current value at the beginning of the step to −100 mV. In another set of experiments, channels were activated by a 200-ms pulse to +100 mV, and then rapidly closed by the application of hyperpolarizing steps. Single-exponential functions were fitted to tail currents at each voltage step.
Membrane capacitance and series resistance were compensated with the amplifier during the experiments. Membrane current density was calculated by dividing the current by the cell capacitance. The conductance, G, was calculated as G = I/(V − Vrev), where I is the tail current, V is the membrane voltage, and Vrev is the current reversal potential. Because in our experimental conditions the calculated equilibrium potential for Cl− ranged between −1.5 and +1.9 mV and the measured Vrev was close to 0 mV, Vrev was set to 0 mV in all calculations.
Data analysis
Data are presented as mean ± SEM, with n indicating the number of cells. Statistical significance was determined using paired or unpaired t tests or ANOVA, as appropriate. When a statistically significant difference was determined with ANOVA, a post-hoc Tukey test was done to evaluate which data groups showed significant differences. P-values of <0.05 were considered significant. Data analysis and figures were made with Igor Pro software (WaveMetrics).
RESULTS
TMEM16B activation by Ca2+ and voltage
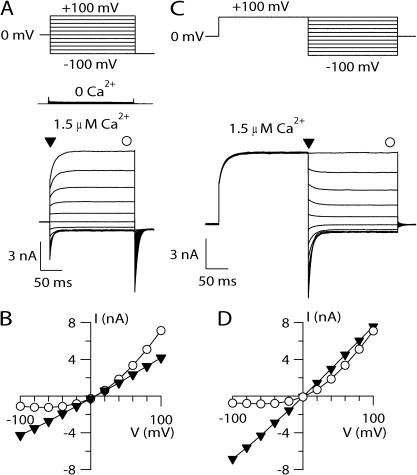
To study the activation of TMEM16B by [Ca2+]i and voltage, we performed whole cell voltage-clamp recordings on HEK 293T cells transiently transfected with TMEM16B using intracellular solutions containing different free [Ca2+]i. Fig. 1 A shows that voltage steps between −100 and +100 mV from a holding voltage of 0 mV elicited very small currents with a nominally 0-Ca2+ pipette solution (8 ± 3 pA/pF at +100 mV; n = 8), whereas it induced large outward currents in the presence of 1.5 µM Ca2+.
Figure 1.
I-V relations of TMEM16B. (A) Representative whole cell voltage-clamp recordings obtained with an intracellular solution containing nominally 0 Ca2+ or 1.5 µM Ca2+, as indicated. Voltage steps of 200-ms duration were given from a holding voltage of 0 mV to voltages between −100 and +100 mV in 20-mV steps, followed by a step to −100 mV, as indicated in the top part of the panel. (B) Steady-state I-V relation measured at the end of the voltage steps (circles) or instantaneous I-V measured at the beginning of each voltage step (inverted triangles) from the cell shown in B. (C) Representative recordings at 1.5 µM Ca2+ obtained with a voltage protocol consisting of a prepulse to +100 mV from a holding voltage of 0 mV, followed by voltage steps between −100 and +100 mV in 20-mV steps, as shown in the top part of the panel. (D) I-V relations measured from tail currents (inverted triangles) or at the steady state (circles).
In the presence of Ca2+, depolarizing voltage steps elicited an instantaneous outward current, indicating that channels were open at the holding potential of 0 mV, followed by a time-dependent outward relaxation (see also Fig. 5). Hyperpolarizing voltage steps induced instantaneous inward currents followed by a relaxation toward less negative values, in agreement with previous results (Pifferi et al., 2009; Stöhr et al., 2009; Rasche et al., 2010). The I-V relation measured at the steady state showed a pronounced outward rectification, whereas the instantaneous I-V curve measured at the beginning of each step was linear (Fig. 1 B). A similar result was obtained by activating TMEM16B with a different voltage protocol: channels were first activated by a 200-ms prepulse to +100 mV, and then tail currents were induced by voltage steps between −100 and +100 mV in 20-mV steps (Fig. 1 C). The I-V relation obtained by plotting the tail currents measured at the beginning of each step versus the step voltage was linear, whereas the steady-state I-V curve showed an outward rectification (Fig. 1 D), as in Fig. 1 B. These results clearly demonstrate that the I-V relation of the open channel is linear, and therefore the outward rectification is a result of a voltage-dependent mechanism that favors channel opening at depolarizing voltages. Thus, TMEM16B is activated by [Ca2+]i and modulated by voltage at low [Ca2+]i.
Figure 5.
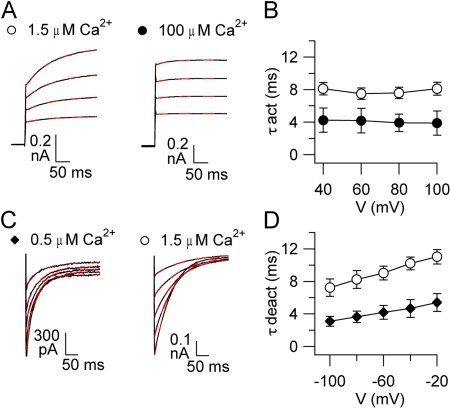
Activation and deactivation kinetics of TMEM16B. (A) Representative recordings at the indicated [Ca2+]i. Voltage protocol as in Fig. 1 A, with voltage steps from a holding voltage of 0 between +40 to +100 mV in 20-mV steps. Red dashed lines are the fit to a single-exponential function. (B) Average activation time constants (τact) plotted versus voltage (n = 6–8). (C) Representative recordings at the indicated [Ca2+]i. Voltage protocol as in Fig. 1 C, with a prepulse to +100 mV and tail currents induced by voltage steps between −100 and +100 mV in 20-mV steps. Only tail currents are illustrated. Red dashed lines are the fit to a single-exponential function. (D) Average deactivation time constants (τdeact) plotted versus voltage (n = 4–9).
To further examine the interplay between [Ca2+]i and voltage in channel activation, we varied [Ca2+]i (Fig. 2 A). Steady-state I-V relations measured at low [Ca2+]i showed an outward rectification that became less pronounced as [Ca2+]i increased (Fig. 2 B). We calculated a rectification index as the ratio between the steady-state current at +100 and −100 mV at each [Ca2+]i. The rectification index was 4.8 ± 0.2 at 1.5 µM Ca2+ and decreased to 1.4 ± 0.2 at 100 µM Ca2+, showing that the I-V relation is Ca2+ dependent and becomes more linear as [Ca2+]i increases (Fig. 2 C).
Figure 2.
Ca2+-dependent rectification of TMEM16B. (A) Whole cell currents activated by the indicated [Ca2+]i. Voltage protocol as in Fig. 1 A. (B) Average steady-state I-V relations from several cells (n = 3–6). (C) Average ratios between steady-state currents measured at +100 and −100 mV at various [Ca2+]i (n = 3–6).
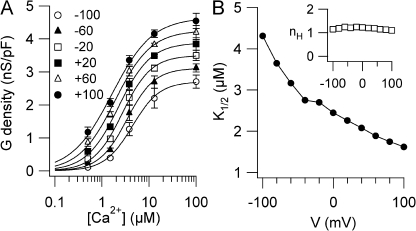
To analyze the Ca2+ dependence of TMEM16B activation at various voltages, we measured the dose–response relations. Tail currents at each [Ca2+]i were measured at the beginning of the step to −100 mV after prepulses ranging from −100 to +100 mV. Fig. 3 A shows the average conductance densities plotted versus [Ca2+]i and fit at each voltage by the Hill equation:
| (1) |
where G is the current density, Gmax is the maximal current density, K1/2 is the half-maximal [Ca2+]i, and nH is the Hill coefficient.
Figure 3.
Ca2+ sensitivity of TMEM16B. (A) Conductance density calculated from tail currents measured at −100 mV after prepulses between −100 and +100 mV as indicated was plotted versus [Ca2+]i (n = 3–6). Voltage protocol as in Fig. 1 A. Lines are the fit to the Hill equation (Eq. 1). (B) K1/2 and nH (inset) values plotted versus voltage.
The Hill coefficient was not voltage dependent with a value of 1.2 at −100 mV and 1.1 at +100 mV. The finding that the Hill coefficient was >1 indicates that the binding of more than one Ca2+ ion is necessary to open the channel. K1/2 slightly decreased with membrane depolarization from 4.3 µM at −100 mV to 1.6 µM at +100 mV, as illustrated in Fig. 3 B. These data show that the Ca2+ sensitivity of TMEM16B is moderately voltage dependent, in agreement with previous results obtained with inside-out patches (Pifferi et al., 2009; Stephan et al., 2009).
The voltage dependence of steady-state activation (G-V relation) was analyzed by measuring tail currents at the beginning of a step to −100 mV after prepulse voltages between −200 and +200 mV. The range of voltages was extended from the previous voltage protocols to obtain a better estimate of voltage dependence. Fig. 4 A shows the average conductance activated at a given [Ca2+]i plotted versus membrane voltage and fit by the Boltzmann equation:
| (2) |
where G/Gmax is the normalized conductance, z is the equivalent gating charge associated with voltage-dependent channel opening, V is the membrane potential, V1/2 is the membrane potential producing half-maximal activation, F is the Faraday constant, R is the gas constant, and T is the absolute temperature.
Figure 4.
Voltage dependence of TMEM16B. (A) Normalized conductances at the indicated [Ca2+]i calculated from tail currents at −100 mV after prepulses between −200 and +200 mV were plotted versus the prepulse voltage (n = 4–9). Lines are the fit to the Boltzmann equation (Eq. 2). (B) V1/2 and z (inset) values plotted versus [Ca2+]i.
The maximal conductance density Gmax was determined by a global fit of G-V relations, and G at each [Ca2+]i was then normalized to the same Gmax. Because at the smaller [Ca2+]i the prediction of Gmax from the fit could be affected by a large error, we also estimated Gmax at each [Ca2+]i. Gmax at 0.5 µM Ca2+ was 4.1 ± 0.4 nS/pF, not significantly different from the value of 4.7 ± 0.4 nS/pF at 100 µM Ca2+, indicating that the estimate of Gmax was little affected by [Ca2+]i. Fig. 4 A shows that increasing [Ca2+]i produced a leftward shift in the G-V relation: V1/2 was 124 ± 20 mV at 1.5 µM Ca2+ and became −115 ± 18 mV at 100 µM Ca2+, whereas the equivalent gating charge was not largely modified (z = 0.23–0.30). Thus, V1/2 decreased as [Ca2+]i increased, indicating that more channels can be activated by depolarization in the presence of a high [Ca2+]i (Fig. 4 B). At a given [Ca2+]i, the conductance increased with depolarization, showing that the conductance depends both on [Ca2+]i and voltage.
Activation and deactivation kinetics are regulated by [Ca2+]i and voltage
To characterize activation and deactivation kinetics, we analyzed the time-dependent components in response to voltage steps in the presence of a given [Ca2+]i. As shown in Figs. 2 A and 5 A, current activation in response to depolarizing voltage steps had two components: an instantaneous time-independent current, related to the fraction of channels open at the holding voltage of 0 mV, followed by an outward time-dependent relaxation, a result of the increase in the fraction of channels opened by depolarization. The time-independent component became larger as voltage or [Ca2+]i increased.
To examine the activation kinetics, we analyzed the time-dependent component of the current elicited by depolarizing voltage steps. Fig. 5 A shows that most of the time course of time-dependent relaxations was well fit by a single-exponential function. The time constant of current activation, τact, in the presence of 1.5 µM Ca2+ was 8.1 ± 0.8 ms at +100 mV and did not vary as a function of voltage at a given [Ca2+]i (Fig. 5 B). At +100 mV, τact at 100 µM Ca2+ was 3.9 ± 1.4 ms, significantly smaller than the value of 8.1 ± 0.8 ms at 1.5 µM Ca2+, showing that an increase in [Ca2+]i accelerated activation.
The time constant of current deactivation (τdeact) was calculated by fitting with a single-exponential function the tail currents obtained after a prepulse at +100 mV by voltage steps ranging between −100 and −20 mV (Fig. 5 C). In the presence of 0.5 µM Ca2+, τdeact was 3.0 ± 0.2 ms at −100 mV and 5.4 ± 0.5 ms at −20 mV, showing that less negative voltages slowed deactivation (Fig. 5 D). At −100 mV, τdeact at 1.5 µM Ca2+ was 7.2 ± 0.8 ms, significantly different from the value of 3.0 ± 0.2 ms at 0.5 µM Ca2+, showing that an increase in [Ca2+]i slowed deactivation.
In summary, the activation kinetics are voltage independent and become faster by increasing [Ca2+]i, whereas the deactivation kinetics are prolonged by depolarization and by increasing [Ca2+]i.
Functional characterization of mutations in the first putative intracellular loop
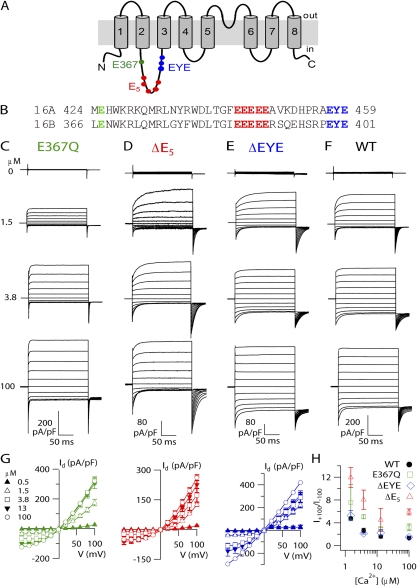
To investigate the molecular mechanisms responsible for channel activation by Ca2+ and by voltage, we performed a site-directed mutagenesis study. Hydropathy analysis indicates that each member of the TMEM16 family has eight transmembrane domains (Fig. 6 A). Analysis of the sequence of TMEM16B does not reveal the presence of any typical voltage sensor or Ca2+-binding domain. However, some acidic amino acids are located in the first putative intracellular loop between transmembrane segment 2 and 3, and we hypothesized that some of them may be involved in Ca2+ and/or voltage activation of TMEM16B. As illustrated in Fig. 6 B, we mutated glutamate at position 367 into glutamine (E367Q), deleted the five consecutive glutamate residues 386EEEEE390 (ΔE5), or deleted 399EYE401 (ΔEYE), and measured their biophysical properties.
Figure 6.
TMEM16B mutations. (A) Predicted topology of TMEM16A and TMEM16B from hydropathy analysis. (B) Alignment between mouse TMEM16A (a,c; available from GenBank/EMBL/DDBJ under accession no. NM_178642.4) and the retinal isoform of TMEM16B used in this study (NP_705817.1), with the mutations or deletions highlighted in color. (C–F) Representative recordings at the indicated [Ca2+]i for E367Q (C), ΔE5 (D), ΔEYE (E) mutants, and WT (F). Traces for WT are the same as in Fig. 2 A. Voltage protocol as in Fig. 1 A. (G) I-V steady-state relations (n = 3–8). (H) Average ratios between currents measured at +100 and −100 mV plotted versus [Ca2+]i for each mutant (n = 3–8).
Fig. 6 (C–F) illustrates recordings from each mutant channel in the presence of various [Ca2+]i. Similar to WT (Fig. 2 A), the steady-state I-V relation for each mutant was Ca2+ dependent, showing an outward rectification at low [Ca2+]i that became less pronounced as [Ca2+]i increased (Fig. 6 G). However, although the overall Ca2+ dependence was similar, the rectification index, measured from the ratio between steady-state currents at +100 and −100 mV, was significantly higher at every [Ca2+]i in E367Q and ΔE5 mutants than in WT, whereas it remained similar in ΔEYE mutant channel (Fig. 6 H).
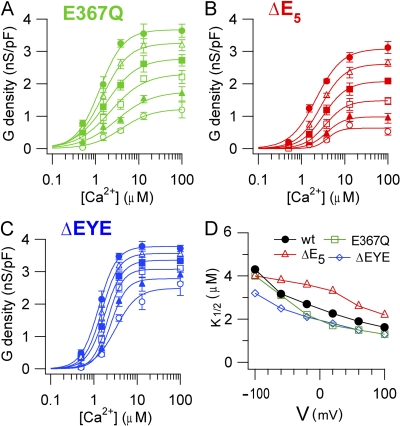
The dose–response relations for each mutant channel, evaluated from tail currents as described previously for the WT channel (Fig. 3), were fit by the Hill equation (Fig. 7, A–C). Fig. 7 D shows that K1/2 at +100 mV (−100 mV) was 1.6 µM (4.3 µM) in WT, 1.3 µM (4.0 µM) in E367Q, 2.2 µM (4.0 µM) in ΔE5, and 1.3 µM (3.2 µM) in ΔEYE. The Hill coefficient nH at +100 mV (−100 mV) was 1.1 (1.2) in WT, 1.6 (1.2) in E367Q, 1.4 (2.9) in ΔE5, and 2.0 (1.7) in ΔEYE. Thus, the mutations produced only some very small changes in K1/2 or nH, but overall no strong modifications in Ca2+ sensitivity were observed.
Figure 7.
Ca2+ sensitivity of TMEM16B mutants. Conductance density calculated from tail currents measured at −100 mV after prepulses between −100 and +100 mV as indicated was plotted versus [Ca2+]i for E367Q (A; n = 3–6), ΔE5 (B; n = 3–5), and ΔEYE (C; n = 3–8) mutants. Lines are the fit to the Hill equation (Eq. 1). (D) K1/2 values plotted versus voltage for each mutant.
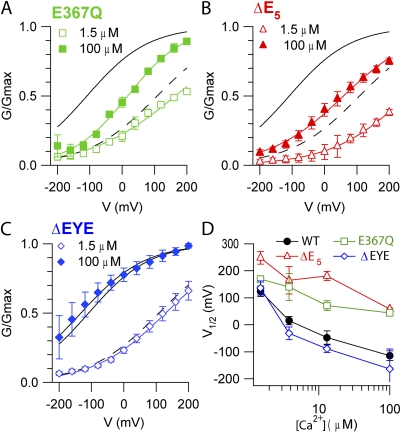
The G-V relations in mutant channels were measured at each [Ca2+]i and compared with the corresponding relations in WT channels. Fig. 8 A shows that the E367Q mutation produced a rightward shift of the G-V relation at a given [Ca2+]i with respect to WT; indeed, V1/2 changed from 124 ± 20 mV in WT to 169 ± 6 mV in E367Q at 1.5 µM Ca2+, and from −115 ± 18 mV in WT to 44 ± 8 mV in E367Q at 100 µM Ca2+ (Fig. 8 D). The deletion ΔE5 also shifted the G-V relations to the right (Fig. 8, B and D): V1/2 changed from 124 ± 20 mV in WT to 248 ± 39 mV in ΔE5 at 1.5 µM Ca2+, and from −115 ± 18 mV in WT to 58 ± 15 mV in ΔE5 at 100 µM Ca2+. Differently from the previous mutants, the ΔEYE deletion did not produce any significant change in the G-V relations (Fig. 8, C and D). The equivalent gating charge for each mutant varied between 0.15 and 0.32, values similar to those of the WT channel (z = 0.23–0.30). Thus, E367Q and the ΔE5 deletion modified the voltage sensitivity: at a given [Ca2+]i, fewer channels can be open by depolarization compared with WT.
Figure 8.
Voltage dependence of TMEM16B mutants. Normalized conductances at the indicated [Ca2+]i calculated from tail currents at −100 mV after prepulses between −200 and +200 mV were plotted versus the prepulse voltage. Black lines are the fit to the Boltzmann equation (Eq. 2) for WT from Fig. 4 at 100 µM Ca2+ (solid line) or at 1.5 µM Ca2+ (dashed line). Colored lines are the fits to the Boltzmann equation for E367Q (A; n = 3–4), ΔE5 (B; n = 3–5), and ΔEYE (C; n = 3–6) mutants. (D) Average V1/2 values plotted versus [Ca2+]i.
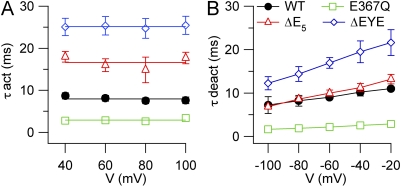
The kinetic properties of activation and deactivation of mutant channels also showed some interesting changes compared with WT channels. Upon depolarizing voltage steps, the activation of mutant channels was still characterized by two components: an instantaneous time-independent current, followed by an outward time-dependent relaxation (Fig. 6), which was well fit by a single-exponential function as in WT channels. In the presence of 1.5 µM Ca2+, τact at +100 mV was 2.8 ± 0.3 ms in E367Q, faster than 7.5 ± 0.7 ms in the WT channel, whereas it became slower than WT in ΔE5 (17.7 ± 3.0 ms) and in ΔEYE (25.5 ± 2.3 ms). These results indicate that each mutation altered the time course of activation. Indeed, the time necessary to respond to a depolarization decreased in E367Q, whereas it was progressively prolonged in ΔE5 and in ΔEYE compared with WT. As in the WT channel, τact in each mutant was not significantly modified by voltage (Fig. 9 A).
Figure 9.
Activation and deactivation kinetics of TMEM16B mutants. Kinetics were measured as explained in Fig. 5. (A) Average activation time constants (τact) plotted versus voltage for E367Q (n = 5), ΔE5 (n = 3), and ΔEYE (n = 6) mutants. (B) Average deactivation time constants (τdeact) plotted versus voltage for E367Q (n = 4), ΔE5 (n = 4), and ΔEYE (n = 5) mutants.
Deactivation kinetics was also well fit by a single-exponential function and, similarly to WT, τdeact showed an increase at less negative voltages for each mutant channel (Fig. 9 B). In the presence of 1.5 µM Ca2+, τdeact at −100 mV was 1.6 ± 0.3 ms in E367Q, smaller than 7.2 ± 0.8 ms in the WT channel, whereas it was not significantly different from WT in ΔE5 (6.8 ± 0.3 ms) and became larger than WT in ΔEYE (12.3 ± 1.5 ms). The time necessary for channels to close upon repolarization decreased in E367Q but remained similar in ΔE5, and it was prolonged in ΔEYE compared with WT. Thus, E367Q and ΔEYE mutants also showed a modified time course of deactivation.
DISCUSSION
Here, we have provided the first site-directed mutagenesis study to investigate structure–function relations of the TMEM16B channel. Because previous studies have shown that TMEM16B in excised inside-out patches has a significant rundown (Pifferi et al., 2009, Fig. 5; Stephan et al., 2009, Fig. 3 A), whereas whole cell recordings are rather stable (Pifferi et al., 2009, Fig. 1 h), we decided to use the whole cell configuration.
We first characterized the WT TMEM16B channel and established one important difference between TMEM16A and TMEM16B activation properties in the absence of [Ca2+]i. Indeed, we found that TMEM16B cannot be activated by voltages up to +200 mV in the absence of Ca2+ (32 ± 10 pA/pF; n = 6; not depicted), whereas recent data from Hartzell’s laboratory showed that TMEM16A was activated by strong depolarization in the absence of Ca2+ (∼140 pA/pF at +200 mV; Fig. 5 A in Xiao et al., 2011). Thus, our data show that TMEM16B needs Ca2+ to be activated differently from TMEM16A, which can be activated by voltage also in the absence of Ca2+ (Xiao et al., 2011).
In the presence of Ca2+, dose–response relations for TMEM16A and TMEM16B obtained by different laboratories reported variable values for K1/2. For TMEM16A, from inside-out recordings, K1/2 at +60 mV (−60 mV) was 0.3 µM (2.6 µM) (Yang et al., 2008), and at +100 mV (−100 mV) it was 0.4 µM (5.9 µM) (Xiao et al., 2011), whereas from whole cell recordings at +100 mV (−40 mV) it was 332 nM (∼700 nM) (Ferrera et al., 2009). For TMEM16B, from previous work in inside-out patches, K1/2 at +50 mV (−50 mV) was 3.3 µM (4.9 µM) (Pifferi et al., 2009), and at +40 mV (−40 mV) it was 1.2 µM (1.8 µM) (Stephan et al., 2009), whereas from whole cell recordings we found that K1/2 at +40 mV (−40 mV) was 2.0 µM (2.7 µM), and at +100 mV (−100 mV) it was 1.6 µM (4.3 µM) (Fig. 3). Although there are some differences among studies reported from different laboratories, every report showed that the apparent affinity for Ca2+ is slightly voltage dependent, with higher apparent Ca2+ affinity at positive voltages, and the Hill coefficients are consistently higher than one, indicating that more than a Ca2+ ion is necessary to activate the channels. A comparison between TMEM16A and TMEM16B shows a fourfold difference between K1/2 values at +100 mV: 0.4 µM (Xiao et al., 2011) for TMEM16A and 1.6 µM for TMEM16B (Fig. 3), indicating a lower apparent affinity for Ca2+ of TMEM16B compared with TMEM16A.
A critical question about the function of TMEM16A and TMEM16B is the following: what are the molecular mechanisms responsible for Ca2+ and voltage modulation of channel gating in each channel? Galietta’s laboratory (Ferrera et al., 2009) has shown that human TMEM16A has various protein isoforms generated by alternative splicing, and it has labeled the four identified alternative segments as a, b, c, and d. A rare minimal version of TMEM16A lacking all alternative segments, TMEM16A (0), still shows CaCC properties, although the voltage dependence is reduced, (Caputo et al., 2008; Ferrera et al., 2009, 2011). Ferrera et al. (2009) showed that segment b modified the Ca2+ sensitivity by nearly fourfold, decreasing the apparent half-effective concentration at +80 mV from 350 to 90 nM, whereas segment c affected the voltage dependence but not the Ca2+ sensitivity of human TMEM16A (abc). Segment c is composed of the four amino acids EAVK, which have also been recently deleted from mouse TMEM16A (ac) in a study from Hartzell’s laboratory (Xiao et al., 2011). Differently from Ferrera et al. (2009), Xiao et al. (2011) found that deletion of EAVK modified both Ca2+ and voltage dependence of TMEM16A. The discrepancy between the results can be a result of differences between human TMEM16A (ab) and mouse TMEM16A (a), and/or to the different techniques, whole cell versus inside-out recordings, used for the experiments in the different laboratories. Although the two studies reached some different conclusions, they both pointed to the relevance of the segment c in the regulation of the TMEM16A functional activity.
TMEM16B is expressed in the retina, at the synaptic terminal of photoreceptors (Stöhr et al., 2009; Billig et al., 2011), in the cilia of olfactory sensory neurons, and in the microvilli of vomeronasal sensory neurons (Stephan et al., 2009; Rasche et al., 2010; Sagheddu et al., 2010; Billig et al., 2011; Pifferi et al., 2012). Zhao’s laboratory showed that the major TMEM16B olfactory isoform differs from the retinal isoform in the absence of the exon encoding the four amino acids ERSQ in the first putative intracellular loop (Stephan et al., 2009). It is worth pointing out here that segment c (EAVK) in TMEM16A is not present in TMEM16B, but that ERSQ residues are located in the corresponding positions in the retinal isoform of TMEM16B (Fig. 6). A comparison between the biophysical properties measured in inside-out patches from the retinal isoform (Pifferi et al., 2009) and from the olfactory isoform (missing ERSQ; Stephan et al., 2009) did not reveal any major difference in the rectification properties and in the dose–response relations between the two isoforms, although we cannot exclude that more detailed biophysical studies may reveal subtle differences. Indeed, the functional properties of additional isoforms for TMEM16B are under investigation (Saidu, S.P., A.B. Stephan, S.M. Caraballo, H. Zhao, and J. Reisert. 2010. Association for Chemoreception Sciences Meeting. Abstr. P68).
Although the amino acidic sequences of both TMEM16A and TMEM16B lack any classical voltage-sensor or Ca2+-binding domain, a series of five consecutive glutamates located in the first putative intracellular loop has been identified as a good candidate to play a role in channel gating. Moreover, we have investigated if other glutamates in the same loop could also be involved in the activation of TMEM16B by Ca2+ and voltage. We found that deletion of the five glutamates, ΔE5, did not greatly affect the apparent affinity for Ca2+ (Fig. 7), but it significantly shifted the activation curve to the right. Indeed, V1/2 at 1.5 µM Ca2+ changed from 124 mV in WT to 248 mV, whereas the equivalent gating charge was not modified. In addition, the time necessary to respond to a depolarization was prolonged in ΔE5, whereas the deactivation constant was not significantly affected (Fig. 9). Thus, the five consecutive glutamates are involved in the voltage dependence of the TMEM16B channel, whereas they do not seem to play a significant role in the apparent affinity for Ca2+. These results are in agreement with a recent study in TMEM16A, showing that the substitution of the four correspondent glutamates into alanines (444EEEE/AAAA447) did not greatly affect the apparent affinity for Ca2+ but modified the voltage dependence, producing a shift of the activation curve to the right (Xiao et al., 2011).
In the TMEM16B mutant E367Q, both activation and deactivation kinetics were shortened; the dose–response relation for Ca2+ was not strongly modified, while the activation curve was shifted to the right. Finally, the deletion ΔEYE produced an increase in the time constants for activation and deactivation, whereas it did not cause any large change in apparent affinity for Ca2+ or in voltage sensitivity.
Collectively, our results indicate that glutamates E367 and 386EEEEE390 in the first putative intracellular loop play a relevant role in the modulation of the voltage dependence of TMEM16B.
Conclusions
In conclusion, we have found evidence that the five consecutive glutamates in the first putative intracellular loop are not involved in Ca2+ sensitivity in TMEM16B but have an important role in voltage dependence. Another glutamate in position 367 plays a similar role, further indicating that the first intracellular loop is involved in voltage-dependent activation of TMEM16B.
At present, the location of the Ca2+-binding site in TMEM16A and TMEM16B remains unknown. It is possible that several residues in different regions contribute to bind Ca2+ ions, but it cannot be excluded that the Ca2+-binding site is located in an accessory subunit expressed both in HEK 293T cells and in axolotl oocytes. Future work will have to shed light on the intricate mechanisms that couple Ca2+ gating and voltage dependence, including intriguing interactions between gating and permeation.
Acknowledgments
We thank Anna Boccaccio, Arin Marchesi, and Riccardo Scala for discussions; Federica Ferrero for help with cell cultures; and all members of the laboratory for discussions.
This study was supported by grants from the Italian Ministry of Education, University and Research, and from the Italian Institute of Technology.
Christopher Miller served as editor.
Footnotes
Abbreviations used in this paper:
- CaCC
- Ca2+-activated Cl− channel
- WT
- wild type
References
- Bers D.M. 2008. Calcium cycling and signaling in cardiac myocytes. Annu. Rev. Physiol. 70:23–49. 10.1146/annurev.physiol.70.113006.100455 [DOI] [PubMed] [Google Scholar]
- Billig G.M., Pál B., Fidzinski P., Jentsch T.J.. 2011. Ca2+-activated Cl− currents are dispensable for olfaction. Nat. Neurosci. 14:763–769. 10.1038/nn.2821 [DOI] [PubMed] [Google Scholar]
- Caputo A., Caci E., Ferrera L., Pedemonte N., Barsanti C., Sondo E., Pfeffer U., Ravazzolo R., Zegarra-Moran O., Galietta L.J.V.. 2008. TMEM16A, a membrane protein associated with calcium-dependent chloride channel activity. Science. 322:590–594. 10.1126/science.1163518 [DOI] [PubMed] [Google Scholar]
- Das S., Hahn Y., Walker D.A., Nagata S., Willingham M.C., Peehl D.M., Bera T.K., Lee B., Pastan I.. 2008. Topology of NGEP, a prostate-specific cell:cell junction protein widely expressed in many cancers of different grade level. Cancer Res. 68:6306–6312. 10.1158/0008-5472.CAN-08-0870 [DOI] [PMC free article] [PubMed] [Google Scholar]
- Duran C., Hartzell H.C.. 2011. Physiological roles and diseases of tmem16/anoctamin proteins: are they all chloride channels? Acta Pharmacol. Sin. 32:685–692. 10.1038/aps.2011.48 [DOI] [PMC free article] [PubMed] [Google Scholar]
- Duran C., Thompson C.H., Xiao Q., Hartzell H.C.. 2010. Chloride channels: often enigmatic, rarely predictable. Annu. Rev. Physiol. 72:95–121. 10.1146/annurev-physiol-021909-135811 [DOI] [PMC free article] [PubMed] [Google Scholar]
- Ferrera L., Caputo A., Ubby I., Bussani E., Zegarra-Moran O., Ravazzolo R., Pagani F., Galietta L.J.V.. 2009. Regulation of TMEM16A chloride channel properties by alternative splicing. J. Biol. Chem. 284:33360–33368. 10.1074/jbc.M109.046607 [DOI] [PMC free article] [PubMed] [Google Scholar]
- Ferrera L., Scudieri P., Sondo E., Caputo A., Caci E., Zegarra-Moran O., Ravazzolo R., Galietta L.J.V.. 2011. A minimal isoform of the TMEM16A protein associated with chloride channel activity. Biochim. Biophys. Acta. 1808:2214–2223. 10.1016/j.bbamem.2011.05.017 [DOI] [PMC free article] [PubMed] [Google Scholar]
- Flores C.A., Cid L.P., Sepúlveda F.V., Niemeyer M.I.. 2009. TMEM16 proteins: the long awaited calcium-activated chloride channels? Braz. J. Med. Biol. Res. 42:993–1001. 10.1590/S0100-879X2009005000028 [DOI] [PubMed] [Google Scholar]
- Frings S., Reuter D., Kleene S.J.. 2000. Neuronal Ca2+-activated Cl− channels—homing in on an elusive channel species. Prog. Neurobiol. 60:247–289. 10.1016/S0301-0082(99)00027-1 [DOI] [PubMed] [Google Scholar]
- Galietta L.J.V. 2009. The TMEM16 protein family: a new class of chloride channels? Biophys. J. 97:3047–3053. 10.1016/j.bpj.2009.09.024 [DOI] [PMC free article] [PubMed] [Google Scholar]
- Hartzell C., Putzier I., Arreola J.. 2005. Calcium-activated chloride channels. Annu. Rev. Physiol. 67:719–758. 10.1146/annurev.physiol.67.032003.154341 [DOI] [PubMed] [Google Scholar]
- Hartzell H.C., Yu K., Xiao Q., Chien L.-T., Qu Z.. 2009. Anoctamin/TMEM16 family members are Ca2+-activated Cl− channels. J. Physiol. 587:2127–2139. 10.1113/jphysiol.2008.163709 [DOI] [PMC free article] [PubMed] [Google Scholar]
- Huang F., Wong X., Jan L.Y.. 2012. International Union of Basic and Clinical Pharmacology. LXXXV: calcium-activated chloride channels. Pharmacol. Rev. 64:1–15. 10.1124/pr.111.005009 [DOI] [PMC free article] [PubMed] [Google Scholar]
- Kleene S.J. 2008. The electrochemical basis of odor transduction in vertebrate olfactory cilia. Chem. Senses. 33:839–859. 10.1093/chemse/bjn048 [DOI] [PubMed] [Google Scholar]
- Kunzelmann K., Kongsuphol P., Chootip K., Toledo C., Martins J.R., Almaca J., Tian Y., Witzgall R., Ousingsawat J., Schreiber R.. 2011a. Role of the Ca2+-activated Cl− channels bestrophin and anoctamin in epithelial cells. Biol. Chem. 392:125–134. 10.1515/BC.2011.010 [DOI] [PubMed] [Google Scholar]
- Kunzelmann K., Tian Y., Martins J.R., Faria D., Kongsuphol P., Ousingsawat J., Thevenod F., Roussa E., Rock J., Schreiber R.. 2011b. Anoctamins. Pflugers Arch. 462:195–208. 10.1007/s00424-011-0975-9 [DOI] [PubMed] [Google Scholar]
- Kunzelmann K., Schreiber R., Kmit A., Jantarajit W., Martins J.R., Faria D., Kongsuphol P., Ousingsawat J., Tian Y.. 2012. Expression and function of epithelial anoctamins. Exp. Physiol. 97:184–192. [DOI] [PubMed] [Google Scholar]
- Lalonde M.R., Kelly M.E., Barnes S.. 2008. Calcium-activated chloride channels in the retina. Channels (Austin). 2:252–260. 10.4161/chan.2.4.6704 [DOI] [PubMed] [Google Scholar]
- Leblanc N., Ledoux J., Saleh S., Sanguinetti A., Angermann J., O’Driscoll K., Britton F., Perrino B.A., Greenwood I.A.. 2005. Regulation of calcium-activated chloride channels in smooth muscle cells: a complex picture is emerging. Can. J. Physiol. Pharmacol. 83:541–556. 10.1139/y05-040 [DOI] [PubMed] [Google Scholar]
- Patton C., Thompson S., Epel D.. 2004. Some precautions in using chelators to buffer metals in biological solutions. Cell Calcium. 35:427–431. 10.1016/j.ceca.2003.10.006 [DOI] [PubMed] [Google Scholar]
- Petersen O.H. 2005. Ca2+ signalling and Ca2+-activated ion channels in exocrine acinar cells. Cell Calcium. 38:171–200. 10.1016/j.ceca.2005.06.024 [DOI] [PubMed] [Google Scholar]
- Petersen O.H., Tepikin A.V.. 2008. Polarized calcium signaling in exocrine gland cells. Annu. Rev. Physiol. 70:273–299. 10.1146/annurev.physiol.70.113006.100618 [DOI] [PubMed] [Google Scholar]
- Pifferi S., Pascarella G., Boccaccio A., Mazzatenta A., Gustincich S., Menini A., Zucchelli S.. 2006. Bestrophin-2 is a candidate calcium-activated chloride channel involved in olfactory transduction. Proc. Natl. Acad. Sci. USA. 103:12929–12934. 10.1073/pnas.0604505103 [DOI] [PMC free article] [PubMed] [Google Scholar]
- Pifferi S., Dibattista M., Menini A.. 2009. TMEM16B induces chloride currents activated by calcium in mammalian cells. Pflugers Arch. 458:1023–1038. 10.1007/s00424-009-0684-9 [DOI] [PubMed] [Google Scholar]
- Pifferi S., Cenedese V., Menini A.. 2012. Anoctamin 2/TMEM16B: a calcium-activated chloride channel in olfactory transduction. Exp. Physiol. 97:193–199. [DOI] [PubMed] [Google Scholar]
- Rasche S., Toetter B., Adler J., Tschapek A., Doerner J.F., Kurtenbach S., Hatt H., Meyer H., Warscheid B., Neuhaus E.M.. 2010. Tmem16b is specifically expressed in the cilia of olfactory sensory neurons. Chem. Senses. 35:239–245. 10.1093/chemse/bjq007 [DOI] [PubMed] [Google Scholar]
- Rock J.R., Harfe B.D.. 2008. Expression of TMEM16 paralogs during murine embryogenesis. Dev. Dyn. 237:2566–2574. 10.1002/dvdy.21676 [DOI] [PubMed] [Google Scholar]
- Sagheddu C., Boccaccio A., Dibattista M., Montani G., Tirindelli R., Menini A.. 2010. Calcium concentration jumps reveal dynamic ion selectivity of calcium-activated chloride currents in mouse olfactory sensory neurons and TMEM16b-transfected HEK 293T cells. J. Physiol. 588:4189–4204. 10.1113/jphysiol.2010.194407 [DOI] [PMC free article] [PubMed] [Google Scholar]
- Sanders K.M., Zhu M.H., Britton F.C., Koh S.D., Ward S.M.. 2012. Anoctamins and gastrointestinal smooth muscle excitability. Exp. Physiol. 97:200–206. [DOI] [PMC free article] [PubMed] [Google Scholar]
- Schroeder B.C., Cheng T., Jan Y.N., Jan L.Y.. 2008. Expression cloning of TMEM16A as a calcium-activated chloride channel subunit. Cell. 134:1019–1029. 10.1016/j.cell.2008.09.003 [DOI] [PMC free article] [PubMed] [Google Scholar]
- Scudieri P., Sondo E., Ferrera L., Galietta L.J.. 2012. The anoctamin family: TMEM16A and TMEM16B as calcium-activated chloride channels. Exp. Physiol. 97:177–183. 10.1113/expphysiol.2011.058198 [DOI] [PubMed] [Google Scholar]
- Stephan A.B., Shum E.Y., Hirsh S., Cygnar K.D., Reisert J., Zhao H.. 2009. ANO2 is the cilial calcium-activated chloride channel that may mediate olfactory amplification. Proc. Natl. Acad. Sci. USA. 106:11776–11781. 10.1073/pnas.0903304106 [DOI] [PMC free article] [PubMed] [Google Scholar]
- Stöhr H., Heisig J.B., Benz P.M., Schöberl S., Milenkovic V.M., Strauss O., Aartsen W.M., Wijnholds J., Weber B.H.F., Schulz H.L.. 2009. TMEM16B, a novel protein with calcium-dependent chloride channel activity, associates with a presynaptic protein complex in photoreceptor terminals. J. Neurosci. 29:6809–6818. 10.1523/JNEUROSCI.5546-08.2009 [DOI] [PMC free article] [PubMed] [Google Scholar]
- Wray S., Burdyga T., Noble K.. 2005. Calcium signalling in smooth muscle. Cell Calcium. 38:397–407. 10.1016/j.ceca.2005.06.018 [DOI] [PubMed] [Google Scholar]
- Xiao Q., Yu K., Perez-Cornejo P., Cui Y., Arreola J., Hartzell H.C.. 2011. Voltage- and calcium-dependent gating of TMEM16A/Ano1 chloride channels are physically coupled by the first intracellular loop. Proc. Natl. Acad. Sci. USA. 108:8891–8896. 10.1073/pnas.1102147108 [DOI] [PMC free article] [PubMed] [Google Scholar]
- Yang Y.D., Cho H., Koo J.Y., Tak M.H., Cho Y., Shim W.-S., Park S.P., Lee J., Lee B., Kim B.-M., et al. 2008. TMEM16A confers receptor-activated calcium-dependent chloride conductance. Nature. 455:1210–1215. 10.1038/nature07313 [DOI] [PubMed] [Google Scholar]


