Abstract
It is generally accepted that globular proteins fold with a hydrophobic core and a hydrophilic exterior. Might the spatial distribution of amino acid hydrophobicity exhibit common features? The hydrophobic profile detailing this distribution from the protein interior to exterior has been examined for 30 relatively diverse structures obtained from the Protein Data Bank, for 3 proteins of the 30S ribosomal subunit, and for a simple set of 14 decoys. A second-order hydrophobic moment has provided a simple measure of the spatial variation. Shapes of the calculated spatial profiles of all native structures have been found to be comparable. Consequently, profile shapes as well as particular profile features should assist in validating predicted protein structures and in discriminating between different protein-folding pathways. The spatial profiles of the 14 decoys are clearly distinguished from the profiles of their native structures.
Keywords: second-order moment, quasiinvariant, hydrophobic ratio
It is generally observed and accepted that globular proteins involve a spatial transition between a hydrophobic core and a hydrophilic exterior (1). Might a detailed characterization of this transition reveal common features? The present paper describes such characterization and identifies two features that are essentially comparable for all of the native structures examined. One is the overall shape or profile of the second-order ellipsoidal hydrophobic moment calculated from protein interior to exterior. The other is a simple ratio of distances at which the second- and zero-order moments of the amino acid distribution of hydrophobicity vanish. Perhaps it should be no surprise that the transition from hydrophobic interior to hydrophilic exterior exhibits spatial characteristics that are common to many, if not to most, globular proteins. The interaction of the amino acid residues of varying hydrophobic attributes with the aqueous environment assists in the selection of the folding pathway that leads to the final protein structure.
The spatial variation of hydrophobicity has been calculated by a second-order ellipsoidal moment utilizing the hydrophobicity consensus scale of Eisenberg (2). Table 1 lists the values assigned to each of the amino acid residues. The hydrophobic moment (2, 3), a first-order moment, has provided a useful measure of the amphiphilicity of α-helical structures. Whereas the first-order moment provides a measure of amphiphilicity, the second-order moment enables the spatial profiling of protein hydrophobicity. The spatial variation arises simply from the spatial distribution of amino acid residues.
Table 1.
Eisenberg hydrophobicity consensus scale
| Residue | Consensus value |
|---|---|
| Arginine | −1.76 |
| Lysine | −1.10 |
| Aspartic acid | −0.72 |
| Glutamine | −0.69 |
| Asparagine | −0.64 |
| Glutamic acid | −0.62 |
| Histidine | −0.40 |
| Serine | −0.26 |
| Threonine | −0.18 |
| Proline | −0.07 |
| Tyrosine | 0.02 |
| Cysteine | 0.04 |
| Glycine | 0.16 |
| Alanine | 0.25 |
| Methionine | 0.26 |
| Tryptophan | 0.37 |
| Leucine | 0.53 |
| Valine | 0.54 |
| Phenylalanine | 0.61 |
| Isoleucine | 0.73 |
Protein structures can be approximated by all sorts of geometric shapes: spherical, ellipsoidal, cylindrical, conical, and other. Because this paper focuses on globular proteins, an ellipsoidal representation of shape will be used. The centroid of the spatial distribution of amino acid residue centroids provides an origin for the moment expansion. It will be shown that shifting the Eisenberg consensus scale of amino acid hydrophobicity such that the net value of protein hydrophobicity vanishes yields a second-order moment profile and hydrophobic ratio that are comparable for all the native structures examined. These features should assist in validating predicted tertiary protein structures and in discriminating between different protein-folding pathways.
A second-order hydrophobic moment had been previously proposed in connection with the description of protein hydrophobicity (2). A second-order moment, the electrostatic quadrupole, has been used as a molecular descriptor for drug discovery (4).
The paper is organized as follows:
A Two-Component Spherical Model treats an idealistic representation of the spatial transition of hydrophobicity from the interior to the exterior of a protein. It illustrates, in a transparent manner, several of the underlying features as well as the rationale of the detailed calculations. Molecular Moments and Hydrophobicity Profiling reviews several aspects of moment expansions relevant for the present calculations and provides a description of the computational procedure. Results of Profiling the Structures presents the results. Conclusions is a summary and discussion of the results.
A Two-Component Spherical Model
The following idealized simple two-component representation of protein hydrophobicity, although deficient in several respects, provides a simple frame of reference in the attempt to understand the regularities found by the detailed calculations presented in the next two sections. The simple model yields the two features alluded to in the Introduction that were found to be comparable for the native structures. It also suggests the interesting possibility of encapsulating the detailed results within the context of a two-component model. Even though this model is not used for the computational procedures described in the following sections, it clearly illustrates the objectives of these calculations within a simpler context.
Let us assume the protein to be represented by a sphere of radius RS. We further assume that two components, hydrophobic and hydrophilic, are distributed over the sphere. For example, residues with positive consensus value might be coalesced into a hydrophobic component, whereas residues of negative value might be coalesced into a hydrophilic component.
If the density of hydrophobicity, ρ(r), at r, a radial distance from the center of the sphere, is assumed to be
 |
1 |
the hydrophobic component will contribute an amount, 4παrηr2dr in a shell of width dr, and the hydrophilic component an amount −4πβrμr2dr.
At a distance, R ≤ RS from the center of the sphere, the accumulated hydrophobicity or zero-order moment, T0, of the distribution will be
 |
2 |
and the second-order radial moment will be
 |
3 |
where a = 4πα, n = η + 2 and b = 4πβ, m = μ + 2.
We further assume that n < m and a, b > 0. Therefore, at small radial distances, the hydrophobic component prevails, and T0 and T2 are positive. As the distance from the origin increases, T2 will change sign before T0 goes to zero. We further assume that T0 vanishes at RS, the surface of the sphere, and that T2 vanishes at R2.
From Eqs. 2 and 3, these distances are
 |
4 |
 |
5 |
Their ratio is given by
 |
6 |
Rtm−n can also be obtained by
 |
7 |
The ratio Rtm−n extracts the powers of the algebraic distribution of Eq. 1 and does not depend on the prefactors.
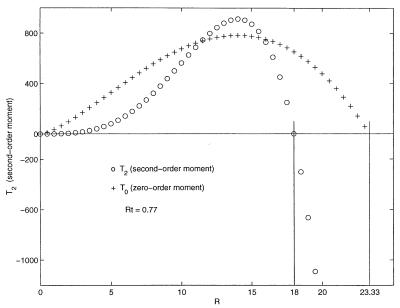
The spatial profiles of the moments T0 and T2 are illustrated as a function of R in Fig. 1. The second-order moment, T2, increases as the hydrophobic region is traversed. As the more hydrophilic region is entered and then traversed, the increase initially slows and then plunges through zero to negative values.
Figure 1.
The zero- and second-order moments, T0 and T2, plotted as a function of R. The prefactors of T0 have been multiplied by a factor of 40 to place it on the same vertical scale of values shown for T2. The values chosen are n = 0.5, m = 1.5, and b = 1. The zero crossing of T2 has been arbitrarily placed at R = 18. Rt = 0.77.
Profiles of the second-order hydrophobic moment for all native structures, calculated by the procedure described in the next section, approximate the profile shape shown in Fig. 1. Zero crossings of this moment can, therefore, be identified for each of the structures. The calculated range of values of the hydrophobic ratio, Rt, for all of the 30 structures is comparable to the range of values, 0.67 and 0.83, obtained by the two-component model for the values of m = 1, n = 0, and m = 2, n = 1, respectively.
Molecular Moments and Hydrophobicity Profiling
The zero- and first-order moments of the amino acid distribution of protein hydrophobicity are
 |
8 |
 |
9 |
r⃗i is a vector to the centroid of the ith amino acid residue with hydrophobicity consensus value hi. The sum is over all n amino acid residues.
Because the zero-order moment, H0, or net hydrophobicity of the protein, is generally nonvanishing, the first-order moment will depend on the origin of the calculation. In connection with the calculated moments of α helices, Eisenberg et al. (2, 3) had pointed out that the first-order moment would be invariant if hydrophobicity differences about the mean, h̄, were calculated with respect to an arbitrary origin,
 |
10 |
with, h̄ = H0/n. Using the protein centroid as the origin of the moment expansion yields this invariant value of the first-order moment, namely,
 |
11 |
 |
12 |
The first-order moment calculated about the centroid of the protein is, therefore, a measure of first-order hydrophobic imbalance about the mean. With the inclusion of values of the solvent-accessible surface area, si, for each of the residues, the surface-exposed first-order hydrophobic moment imbalance about the entire protein can then be written,
 |
13 |
This moment could provide useful information with respect to the three-dimensional spatial affinity of the tertiary protein structure and external structures with which it might interact.
Second-order moments provide the capability of spatially profiling the hydrophobicity distribution of amino acid residues. This is the primary focus of the present paper. Proteins come with all sorts of overall shape. A Two-Component Spherical Model used a spherical representation of shape. A representation that is the simplest generalization of this ideal shape is an ellipsoidal representation. This shape can be generated from the molecular moments of geometry, i.e., moments of inertia for which all amino acid residue centroids are weighted by unity instead of by residue mass. The calculation is performed with the centroid of the amino acid centroids of the protein as origin. The moments of geometry are designated g1, g2, and g3, with g1 < g2 < g3. The ellipsoidal representation generated by these moments is written as
 |
14 |
with g′2 = g2/g1, g′3 = g3/g1. The coordinates x, y, and z are written in the frame of the principal geometric axes.
The ellipsoidal surface obtained by the choice of a particular value of d enables the collection of the values of hydrophobicity for all amino acid residues of number nd lying within this surface. The consensus hydrophobicity scale of Table 1 has been used in all of the calculations. The distribution of amino acid hydrophobicity is, however, shifted such that the net hydrophobicity of each protein vanishes. The distribution is then normalized to yield a standard deviation of 1. Such shifting of the values of amino acid hydrophobicity eliminates the zero-order moment from the distribution and consequently the dependence of the second-order moment on differences in net protein hydrophobicity. This scaling provides a basis for comparison of the hydrophobic moment profiles of the different proteins and consequently a basis for comparison of their hydrophobic ratios.
The average hydrophobicity per residue collected within the ellipsoidal surface specified by d is then written,
 |
15 |
The superscript d indicates that the moment has been divided by the number of residues. The prime designates the value of hydrophobicity of each residue after shifting and normalizing the distribution. When the value of d is just large enough to collect all of the residues, the net hydrophobicity of the protein vanishes. This value of d assigns a “protein surface” as a location of common reference. Calculations performed for each of the proteins will examine increasing the value of d until all residues have been collected and the mean hydrophobicity vanishes.
The value of the second-order ellipsoidal moment per residue from residues lying within the ellipsoidal surface specified by d is written
 |
16 |
When all residues fall within the ellipsoidal surface and are collected, one finds:
 |
17 |
where
 |
18 |
The values of H (d) and
H
 (d) are calculated for each protein with
increasing values of d, and the ratio Rt =
d−/d0 obtained.
d− is the value of d for which
H
 (d) has changed sign, becoming negative,
and d0 the value for which
H
 (d) vanishes. We have adopted the
protocol that for d− to be chosen, all values
of H
 (d) at larger values of d
must be negative. The ratio, Rt, is what we have called the
hydrophobic ratio of distances or just the hydrophobic ratio. The next
section will show it to be quasiinvariant or roughly comparable in
value for all of the native protein structures examined.
Results of Profiling the Structures
Protein structures were selected by keyword searches of the Protein Data Bank (PDB) and by examination of entries in different SCOP (5) classes. The objective was to choose a selection representative of different sizes and different classes. Thirty protein structures were chosen in this manner. For an internal check, two of the proteins chosen included 1CTQ and 121P, the same protein with independently determined structures. Three additional proteins were also chosen from the recently determined structure of the 30S ribosomal subunit (6). The PDB identification numbers and number of amino acid residues for each are listed in Table 2. Finally, 14 simple decoys as well as their native structures were also chosen for examination (ref. 7; I am indebted to Richard Friesner for suggesting this calculation).
Table 2.
Protein structures profiled and number of residues
| PDB ID | Number | PDB ID | Number |
|---|---|---|---|
| 1ORC | 63 | 1BN1c | 257 |
| 1CDZ | 96 | 2DRI | 271 |
| 1NEU | 115 | 1AUA | 296 |
| 1DZOc | 120 | 1LDM | 329 |
| 1A4V | 123 | 1FSZ | 334 |
| 1AT0 | 125 | 1UBY | 348 |
| 1PDO | 129 | 1A26 | 351 |
| 2SNS | 141 | 1PHC | 405 |
| 1CQ2c | 153 | 1BGV | 449 |
| 1PHR | 154 | 3PBG | 468 |
| 1CTQ | 166 | 1GAIc | 472 |
| 121P | 166 | 3COXc | 500 |
| 1DZV | 206 | 1FEH | 574 |
| 1AUN | 208 | B_1FJFc | 234 |
| 1LBU | 213 | C_1FJFc | 206 |
| 2ACT | 218 | D_1FJFc | 208 |
| 1AKZ | 223 |
The superscript c indicates that hydrophobicity assignments have been made at the α-carbon locations; all others are made at the centroid of the amino acid residue.
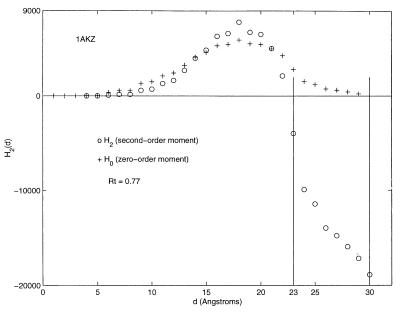
Detailed results of profiling one of the structures, 1AKZ, are shown in
Fig. 2 and Table
3. The figure shows the profile of the
accumulated zero-order moment, H0(d), and
second-order moment, H2(d). Table 3 lists the
moments per residue, H (d) and
H
 (d). As the distance, d, that
defines the extent of the ellipsoid is increased, the first residue
falls within the ellipsoidal surface at a value of d equal
to 4 Å. From Fig. 2, one sees the second-order moment increase in
value until it turns around rapidly, becoming negative. At the 1-Å
resolution of the calculation shown in Table 3, the first negative
value appears at d− = 23. The
hydrophobicity, H
 (d), of the protein
becomes zero at d0 = 30. Rt, the
hydrophobic ratio, has a value, therefore, of 23/30 = 0.77.
One notes that the second-order moment profile of Fig. 2 has a similar
shape to the second-order moment profile shown in Fig. 1, the profile
obtained for the idealized two-component model. The steep decrease of
the more realistic ellipsoidal model tapers off, however, in the final
range of 25–30 Å. Both zero- and second-order moments peak at the
same value of d, and this distance, at which the maximum
occurs, can also be used as a feature for comparison between different
proteins.
Figure 2.
The zero- and second-order ellipsoidal moment profiles of the protein 1AKZ. The zero-order moments have been multiplied by a factor of 120 to place them on the same vertical scale of values shown for the second-order moment.
Table 3.
Zero and second-order moments of 1AKZ
| d (Angstroms) | nd |
H (d) (d) |
H (d) (d) |
|---|---|---|---|
| 4 | 1 | 0.288 | 2.62 |
| 5 | 1 | 0.288 | 2.62 |
| 6 | 5 | 0.607 | 16.86 |
| 7 | 7 | 0.657 | 22.28 |
| 8 | 7 | 0.657 | 22.28 |
| 9 | 13 | 0.842 | 45.1 |
| 10 | 16 | 0.779 | 44.53 |
| 11 | 24 | 0.738 | 54.44 |
| 12 | 27 | 0.75 | 60.8 |
| 13 | 40 | 0.675 | 67.57 |
| 14 | 53 | 0.645 | 75.13 |
| 15 | 63 | 0.606 | 76.76 |
| 16 | 77 | 0.574 | 81.75 |
| 17 | 89 | 0.51 | 74.23 |
| 18 | 101 | 0.487 | 77.2 |
| 19 | 114 | 0.403 | 58.94 |
| 20 | 138 | 0.328 | 47.12 |
| 21 | 156 | 0.266 | 32.14 |
| 22 | 168 | 0.211 | 12.68 |
| 23 | 184 | 0.127 | −21.54 |
| 24 | 200 | 0.063 | −49.53 |
| 25 | 208 | 0.048 | −54.96 |
| 26 | 215 | 0.029 | −64.99 |
| 27 | 218 | 0.023 | −67.81 |
| 28 | 220 | 0.016 | −72.45 |
| 29 | 221 | 0.008 | −77.65 |
| 30 | 223 | 0 | −84.67 |
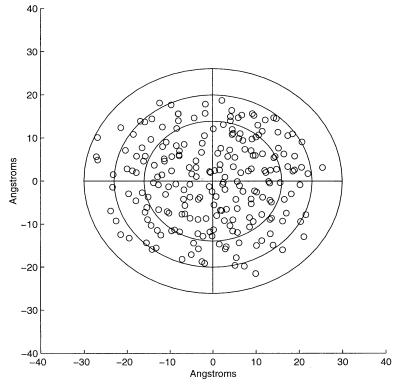
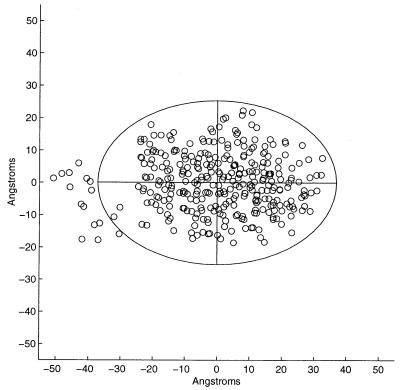
Fig. 3 shows a view along one of the three principal axes of 1AKZ. The projections of the amino acid centroids have been plotted as well as the elliptical boundaries in the plane containing two of the principal axes. The ellipses have been plotted for the value d = 16, where the second-order moment is greatest, the value of d− = 23, the value at which H2 has just changed sign, and the value d0 = 30, the value for which all amino acid residue centroids fall just within the ellipsoidal surface, the protein hydrophobicity vanishing. The region of increasing H2 reflects the predominance of the spatial distribution of residues comprising the hydrophobic core. At larger d, the slowing of this increase and plunge to negative values reflect the spatially increasing prevalence of hydrophilic residues. Such regular behavior is required for the identification of d− and consequently for the calculation of Rt. Keeping the 1AKZ structure fixed and randomly shuffling the hydrophobicity values among the different residues yields the results shown in Table 4. It is evident from examination of this table that a value of d− cannot be assigned from this distribution of values of the second-order moment.
Figure 3.
A view along one of the principal axes of 1AKZ. The interior, intermediate, and exterior contours are drawn at the maximum value of H2, d = 16, and for d− = 23, d0 = 30.
Table 4.
Zero and second-order moments for a random residue distribution of 1AKZ
| d (Angstroms) | nd |
H (d) (d) |
H (d) (d) |
|---|---|---|---|
| 4 | 1 | −0.421 | −3.84 |
| 5 | 1 | −0.421 | −3.84 |
| 6 | 5 | −0.486 | −13.50 |
| 7 | 7 | −0.518 | −17.11 |
| 8 | 7 | −0.518 | −17.11 |
| 9 | 13 | −0.238 | −6.41 |
| 10 | 16 | −0.187 | −3.92 |
| 11 | 24 | −0.025 | 8.41 |
| 12 | 27 | 0.011 | 11.64 |
| 13 | 40 | 0.041 | 12.76 |
| 14 | 53 | 0.040 | 10.66 |
| 15 | 63 | 0.058 | 14.02 |
| 16 | 77 | −0.074 | −17.48 |
| 17 | 89 | −0.003 | 1.23 |
| 18 | 101 | −0.008 | −0.24 |
| 19 | 114 | −0.024 | −5.92 |
| 20 | 138 | −0.021 | −4.35 |
| 21 | 156 | −0.009 | −0.19 |
| 22 | 168 | −0.008 | −0.19 |
| 23 | 184 | 0.004 | 5.15 |
| 24 | 200 | 0.009 | 7.99 |
| 25 | 208 | 0.018 | 13.58 |
| 26 | 215 | 0.034 | 23.84 |
| 27 | 218 | 0.024 | 16.36 |
| 28 | 220 | 0.015 | 10.03 |
| 29 | 221 | 0.011 | 6.64 |
| 30 | 223 | 0.000 | −2.56 |
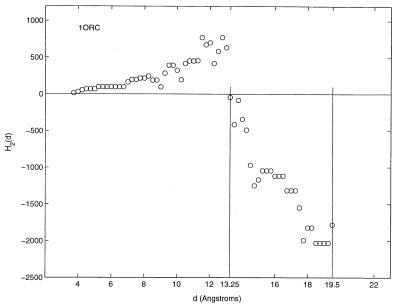
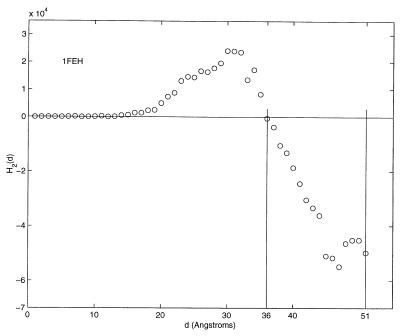
Figs. 4 and 5 show the second-order ellipsoidal moment profiles obtained for the smallest protein, 1ORC, and the largest, 1FEH. 1ORC has been profiled with a resolution of 0.25 Å in Fig. 4. At this resolution, Rt = 0.68. Even though the scales of the axes of both figures differ significantly, the overall profile shapes over the extent of the proteins are similar. Again, there is an initial increase in the value of the second-order moment before plunging to negative values. The hydrophobic ratios, Rt, of 1ORC and 1FEH are 0.70 and 0.71, respectively, for the 1-Å resolution used to obtain the entries listed in Table 5. These two examples highlight the relative independence of the overall second-order moment profile shape and hydrophobic ratio with respect to differences in protein size.
Figure 4.
The second-order ellipsoidal moment profile of the protein 1ORC.
Table 5.
Hydrophobic ratios of 30 PDB protein structures and 3 ribosomal proteins
| PDB ID | d_/d0 | Rt | Spherical | PDB ID | d_/d0 | Rt | Spherical |
|---|---|---|---|---|---|---|---|
| 1ORC | 14/20 | 0.70 | 0.68 | 1BN1c | 23/30 | 0.77 | 0.72 |
| 1CDZ | 18/23 | 0.78 | 0.73 | 2DRI | 31/37 | 0.84 | 0.94 |
| 1NEU | 18/28 | 0.64 | 0.64 | 1AUA | 28/34 | 0.82 | 0.79 |
| 1DZOc | 21/29 | 0.72 | 0.68 | 1LDM | 30/37 | 0.81 | 0.71 |
| 1A4V | 20/29 | 0.69 | 0.63 | 1FSZ | 25/34 | 0.74 | 0.70 |
| 1AT0 | 19/25 | 0.76 | 0.74 | 1UBY | 30/43 | 0.70 | 0.70 |
| 1PDO | 18/23 | 0.78 | 0.70 | 1A26 | 29/41 | 0.71 | 0.68 |
| 2SNS | 20/28 | 0.71 | 0.63 | 1PHC | 29/38 | 0.76 | 0.73 |
| 1CQ2c | 17/25 | 0.68 | 0.70 | 1BGV | 30/38 | 0.79 | 0.76 |
| 1PHR | 19/26 | 0.73 | 0.69 | 3PBG | 29/37 | 0.78 | 0.77 |
| 1CTQ | 19/25 | 0.76 | 0.79 | 1GAIc | 27/37 | 0.73 | 0.66 |
| 121P | 19/25 | 0.76 | 0.75 | 3COXc | 30/38 | 0.79 | 0.68 |
| 1DZV | 26/34 | 0.76 | 0.74 | 1FEH | 36/51 | 0.71 | 0.63 |
| 1AUN | 22/29 | 0.76 | 0.71 | B_1FJFc | 25/43 | 0.58 | 0.49 |
| 1LBU | 22/29 | 0.76 | 0.58 | C_1FJFc | 26/36 | 0.72 | 0.73 |
| 2ACT | 22/28 | 0.79 | 0.70 | D_1FJFc | 29/33 | 0.89 | 0.81 |
| 1AKZ | 23/30 | 0.77 | 0.72 |
All 30 protein structures exhibit similar spatial behavior for
either the accumulated second-order hydrophobic moment,
H2(d), or H (d), the
moment per residue. The accumulated profiles are, however, somewhat
smoother and accentuate the plunge to negative values as the surface of
the protein is approached. The results for the 30 protein structures
and 3 ribosomal proteins are published as supplemental data on the PNAS
web site, www.pnas.org. Table 5 lists the value of the hydrophobic
ratio for each of the protein structures. All 30 structures yield a
mean value of the ratio equal to 0.75, with a standard deviation of
0.045. The numerator and denominator of Rt, d−
and d0, are also listed. This clearly shows how
d− increases with increasing protein size to
provide comparable values of the ratio for all 30 proteins. The value
of d0 scales roughly as a factor of two between
the largest and smallest proteins examined. This increase in
d0 is as expected, because the ratio of the
number of amino acid residues of the largest to smallest protein
structures is approximately equal to 600/70, and consequently
(600/70)
 ≈ 2. d0 can be
considered an approximate measure of the linear extent of the protein.
Consequently, the values of d− are then equal
to a comparable fraction of the extent of each of the proteins, for all
of the structures.
Table 5 also shows the results of profiling the distribution with a spherical instead of ellipsoidal contour. The crossover between the positive and negative values of H2 is still well defined. Consequently, a value for the hydrophobic ratio, Rt, can be calculated. One notes its greater variability with spherical profiling.
A few of the proteins require special attention. Three of the structures, 1PDO, 1LDM, and 1FSZ, have extended arms that are away from the main body of the protein. Collecting all residues to determine the value of d0 yields a value that is not representative of the protein bulk. Shifting the scale of residue hydrophobicity such that the net hydrophobicity of the protein is zero when all residues of the bulk are collected yields the values given in Table 5. Fig. 6 shows a view along one of the principal axes of 1LDM with the ellipsoidal intercept in the plane of the two other principal axes. The intercept has been drawn for the value d = 37, a value that does not include the contribution from the structural arm.
Figure 6.
A view along one of the principal axes of 1LDM showing the contour at d = 37, which truncates the arm of the protein.
Structure 1LBU exhibits slightly deviant behavior of H2. There is a rapid crossover to a negative value of the second-order moment at a value of d equal to 20. This value remains negative until, at d = 23, it becomes marginally positive before becoming negative again at d = 24 and thereafter. The two zero crossovers at d = 20 and d = 24 yield a hydrophobic-ratio average of 0.76.
Two of the ribosomal proteins, B_1FJF (chain B; protein S2) and D_1FJF (chain D; protein S4), are the largest deviants with respect to the values of Rt for the nonribosomal proteins. On the other hand, C_1FJF (chain C; protein S3) yields a value of Rt that is within the range of the other 30 values. C_1FJF makes no contact with RNA at all and exhibits an α/β domain frequently found in different proteins with α helices packed against a β sheet (6).
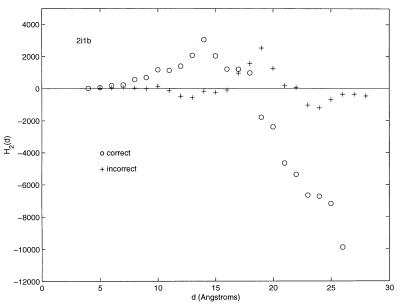
Finally, ellipsoidal moment profiling has been performed on a simple decoy set (7). Fourteen decoys and native structures of this set, with a number of residues greater than 100, were downloaded from the web (structures were downloaded from http://dd.stanford.edu/download.shtml). Twenty-eight moment calculations were, therefore, performed. A typical result is shown in Fig. 7. Visual inspection of the figure clearly delineates the difference between the correct or native structure and the decoy structure. Figures for all 14 structures look essentially the same. The results for the 28 decoy and native structures are available as supplementary material, www.pnas.org. All native structures exhibit a second-order moment profile similar to what had been obtained for the 30 PDB structures. Consequently, hydrophobic ratios can be calculated, and they span the range of values previously found for the 30. The spatial transition to the hydrophilic exterior of the native structures is significantly amplified by the second-order moment. The decoys do not exhibit this plunge to negative values of the second-order moment, nor is the relatively regular behavior in the protein interior reproduced. Hydrophobic ratios cannot, therefore, be assigned to any of the decoy structures.
Figure 7.
The second-order ellipsoidal profile of the native and decoy structures of 2i1b.
Conclusions
This paper has focused on the spatial region of transition between the hydrophobic core and hydrophilic exterior of globular proteins. The moment calculations have identified two features, apparently independent of protein size and fold, that are comparable for the 30 protein structures obtained from the PDB and for the 14 native structures of the decoy set. One, a global feature, is the overall shape or profile of the second-order ellipsoidal moment calculated from protein interior to exterior. The other, a specific feature, the hydrophobic ratio, is the ratio of distances at which the second- and zero-order moments of the distribution vanish. Such correspondence of features over the set of proteins examined had not been initially expected.
Although it might seem surprising that the profile shapes and hydrophobic ratios are comparable over a set of diverse protein sizes and structures, the origin of this correspondence might be inferred by examination of the relative increase of the cumulative hydrophobic and hydrophilic moments with increasing distance from the protein interior. Consequently, the results of the two-component spherical model indicate that, with a power law fit to these cumulative increases, this simple model would yield values of the hydrophobic ratio that would be comparable to those obtained by the detailed calculations.
The comparison between the second-order moment profiles of the native with the decoy structures is revealing. The second-order moment amplifies differences about the mean protein hydrophobicity. Profiles of the native structures reflect the significant separation between the hydrophobic residues comprising the core and the hydrophilic residues of the protein exterior. The decoy residue distribution fails to mirror this separation. This suggests that moment profiling should play an important role in recognizing the difference between native and decoy folds. It should also play a role in validating predicted protein structures.
With respect to molecular dynamics and protein-folding pathways, profiling could be done at various points in the folding trajectory. One would then look for trajectories that begin to exhibit a relatively smooth monotonic increase of the second-order moment in the structural interior, with the onset of a transition to negative values near the exterior. It would then be of interest to see how close such identification would appear with respect to the final native structure achieved. After identification or selection of such trajectory, fine tuning could be observed or directed by examination of the hydrophobic ratio. Considering the native structure as the endpoint in the folding trajectory, perhaps the moment regularities will provide not only constraints with respect to the pathways selected but also a clue to the underlying processes responsible for such selection.
To conclude, the procedure described in this paper need not be restricted to examination of globular proteins but can be used in connection with the profiling of proteins of diverse overall structure, with the choice of an appropriate overall profiling geometry.
Supplementary Material
Figure 5.
The second-order ellipsoidal moment profile of the protein 1FEH.
Acknowledgments
I thank Bruce Berne, Ruhong Zhou, and Ajay Royyuru for valuable discussions.
Abbreviation
- PDB
Protein Data Bank
References
- 1.Meirovitch H, Scheraga H A. Macromolecules. 1981;14:340–345. [Google Scholar]
- 2.Eisenberg D, Weiss R M, Terwilliger T C, Wilcox W. Faraday Symp Chem Soc. 1982;17:109–120. [Google Scholar]
- 3.Eisenberg D, Weiss R M, Terwilliger T C. Nature (London) 1982;299:371–374. doi: 10.1038/299371a0. [DOI] [PubMed] [Google Scholar]
- 4.Silverman B D, Platt D E. J Med Chem. 1996;39:2129–2140. doi: 10.1021/jm950589q. [DOI] [PubMed] [Google Scholar]
- 5.Murzin A G, Brenner S E, Hubbard T, Chothia C. J Mol Biol. 1995;247:536–540. doi: 10.1006/jmbi.1995.0159. [DOI] [PubMed] [Google Scholar]
- 6.Wimberly B T, Brodersen D E, Clemons W M, Jr, Morgan-Warren R J, Carter A P, Vonrhein C, Hartsch T, Ramakrishnan V. Nature (London) 2000;407:327–339. doi: 10.1038/35030006. [DOI] [PubMed] [Google Scholar]
- 7.Holm L, Sander C. J Mol Biol. 1992;225:93–105. doi: 10.1016/0022-2836(92)91028-n. [DOI] [PubMed] [Google Scholar]
Associated Data
This section collects any data citations, data availability statements, or supplementary materials included in this article.


