Abstract
The leucine-rich repeat kinase 2 (LRRK2) mutations are the most common cause of autosomal-dominant Parkinson disease (PD). Mitochondrial dysfunction represents a critical event in the pathogenesis of PD. We demonstrated that wild-type (WT) LRRK2 expression caused mitochondrial fragmentation along with increased mitochondrial dynamin-like protein (DLP1, also known as DRP1), a fission protein, which was further exacerbated by expression of PD-associated mutants (R1441C or G2019S) in both SH-SY5Y and differentiated primary cortical neurons. We also found that LRRK2 interacted with DLP1, and LRRK2–DLP1 interaction was enhanced by PD-associated mutations that probably results in increased mitochondrial DLP1 levels. Co-expression of dominant-negative DLP1 K38A or WT Mfn2 blocked LRRK2-induced mitochondrial fragmentation, mitochondrial dysfunction and neuronal toxicity. Importantly, mitochondrial fragmentation and dysfunction were not observed in cells expressing either GTP-binding deficient mutant LRRK2 K1347A or kinase-dead mutant D1994A which has minimal interaction with DLP1 and did not increase the mitochondrial DLP1 level. We concluded that LRRK2 regulates mitochondrial dynamics by increasing mitochondrial DLP1 through its direct interaction with DLP1, and LRRK2 kinase activity plays a critical role in this process.
INTRODUCTION
Leucine-rich repeat kinase 2 (LRRK2) is a large multi-domain protein kinase that can be found in the cytoplasm as well as associated with the mitochondrial membrane (1). Its normal function is unclear, yet pathogenic mutations in LRRK2 have been identified in both autosomal-dominant familial Parkinson disease (PD) and sporadic PD (2,3). The LRRK2 mutations are considered the most common cause of autosomal-dominant PD (4). Since most patients with LRRK2 mutations exhibit clinical symptoms typical of idiopathic or sporadic PD (2,3), an understanding of LRRK2 pathogenesis will probably provide new insights into the pathogenesis of disease.
Compelling evidence suggests that mitochondrial dysfunction could represent a critical event in the pathogenesis of PD (5,6). Several recently identified genes present in familial PD including PINK1, Parkin and DJ-1 are localized to, and involved in the function of mitochondria (5). Mitochondrial function is highly dependent on its continual fission and fusion dynamics which is regulated by several proteins, i.e. Fis1 and dynamin-like protein 1 (DLP1, also referred to as Drp1, DVLP, dimple, HdynIV and DNM1L) for fission and OPA1, Mfn1 and Mfn2 for fusion (6). Increasing evidence supports the important role of mitochondrial fission/fusion dynamics in the pathogenesis of neurodegenerative disease (7,8). Interestingly, most recent studies demonstrate that α-synuclein, PINK1, Parkin and DJ-1 are involved in the regulation of mitochondrial dynamics (9–15). Excessive mitochondrial fission might be mediating neurotoxicity induced by complex I inhibition in toxin models of PD (16), suggesting that altered mitochondrial fission/fusion dynamics is probably a common pathogenic pathway of PD.
LRRK2 is present in mitochondria (17,18), predominantly in the outer membrane, indicating a possible mitochondria-centered mechanism of LRRK2 action. Indeed, LRRK2 plays an important role in modulating the response to mitochondrial inhibition (19). Recent studies reported a genetic interaction between LRRK2 and PINK1/Parkin (20,21), and PINK1 deficiency-induced mitochondrial morphological abnormalities can be prevented by lrk-1 (C. elegans LRRK2 homolog) deficiency (22). Furthermore, primary human fibroblasts derived from PD patients carrying LRRK2 G2019S mutant demonstrated impaired mitochondria function and morphology (23), further indicating that the mitochondrial dynamic changes might underlie the phenotype presentations in LRRK2-associated PD patients. Therefore, in this study, we investigated the involvement of LRRK2 in the regulation of mitochondrial dynamic and function and the underlying mechanism(s).
RESULTS
Effect of LRRK2 on mitochondrial morphology
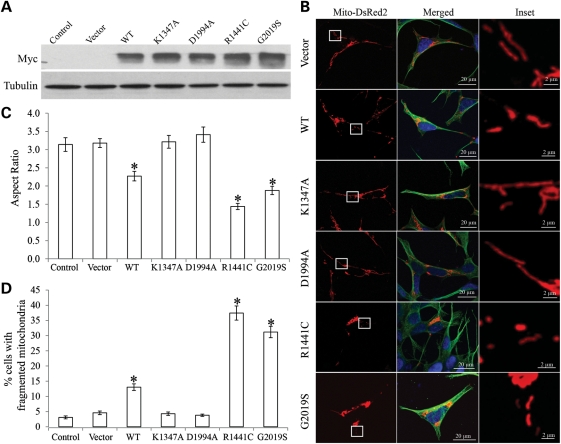
To investigate the effects of PD-associated LRRK2 mutations on mitochondrial dynamics, we established a panel of human dopaminergic neuroblastoma SH-SY5Y clonal lines that stably overexpress myc-tagged wild-type LRRK2 (WT cells), PD-associated mutant LRRK2 R1441C (R1441C cells) or G2019S (G2019S cells). Three independent clonal lines of these LRRK2 variants with equal transgene expression were selected. Overexpression of LRRK2 in these cell lines was confirmed by immunoblot (Fig. 1A). No significant changes in basal levels of cell death were noted in any of these cell lines compared with non-transfected control cells or empty-vector transfected cells (not shown). To visualize mitochondria, these stable cell lines were transiently transfected with mito-DsRed2. After 2 days, cells were fixed, stained and imaged by laser confocal microscopy. As reported previously (16), in most (>95%) control cells and vector cells, mitochondria showed tubular and filamentous morphology with a mean aspect ratio (a ratio between the major and the minor axes of the ellipse equivalent to the mitochondria as an index for mitochondrial morphology) of 3.1 ± 0.2 and 3.2 ± 0.1, respectively (Fig. 1B–D). Overexpression of WT LRRK2 significantly increased the percentage of cells with fragmented mitochondria as evidenced by the appearance of small round structures and significantly decreased the mean aspect ratio of 2.3 ± 0.1. Mitochondria fragmentation became more severe in PD-associated LRRK2 G2019S or R1441C cells where 31.2 ± 1.9% (G2019S cells) or 37.4 ± 2.3% cells (R1441C cells) demonstrated fragmented mitochondria with a mean aspect ratio of 1.9 ± 0.1 (G2019S cells) or 1.4 ± 0.1 (R1441C cells), respectively (Fig. 1B–D).
Figure 1.
Effect of LRRK2 on mitochondrial morphology. (A) Representative immunoblot shows LRRK2 levels in human dopaminergic neuroblastoma SH-SY5Y clonal lines that stably overexpress WT or mutant LRRK2. An aliquot of 20 μg/lane was loaded and tubulin used as an internal loading control. (B) SH-SY5Y cells were transfected with mito-DsRed2 to label mitochondria, fixed 2 days after transfection, immunostained with tubulin and evaluated. Representative pictures of positively transfected cells are shown. Green, tubulin; red, mito-DsRed2; blue, DAPi. Insets show enlargements of boxed areas. (C and D) Quantification of mitochondrial morphology revealed a significant decrease in the aspect ratio (C), and increase in the percentage of cells displaying fragmented mitochondria (D) compared with controls. For each cell line, at least 500 cells were analyzed in each experiment and experiments were repeated three times (*P < 0.001, Student's t-test).
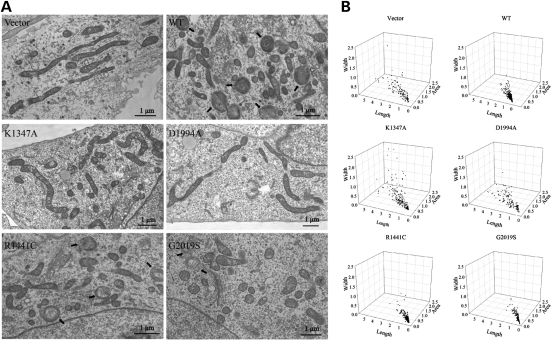
Consistent with our confocal microscopic results, electron microscopic analysis of mitochondria revealed abundant long and thin mitochondrial tubules with intact cristae in the control cells and vector cells (Fig. 2A). In contrast, round and significantly shorter and smaller mitochondria dominated in the WT and PD-associated G2019S and R1441C LRRK2 cells (Fig. 2A and B). Abnormal mitochondria with damaged cristae or with multilamellar onion-like structure were also found in these cell lines (Fig. 2A).
Figure 2.
Electron microscopy analysis of mitochondrial morphology. (A) Representative EM micrographs of vector, LRRK2 WT, K1347A, D1994A, R1441C and G2019S cells are shown. Arrows mark mitochondria with abnormal multilamellar onion-like structures that are only found in WT, R1441C and G2019S LRRK2 cells. (B) Quantitative analysis of mitochondrial morphology (width, length and number) in these cells based on EM micrographs. At least 500 mitochondria were analyzed in each cell line.
LRRK2-induced mitochondrial fragmentation requires kinase activity
G2019S and R1441C mutations stimulate kinase activity, and it is suggested that kinase activity plays a critical role in the pathogenic action of LRRK2 (24–26). To investigate the contribution of kinase activity to LRRK2-induced mitochondrial fragmentation, we generated SH-SY5Y clonal lines that stably overexpress myc-tagged GTP-binding deficient mutant LRRK2 K1347A or kinase-dead mutant LRRK2 D1994A, both of which completely inhibit kinase activity. Three independent clonal lines overexpressing each of these LRRK2 variants with equal transgene expression comparable with the G2019S and R1441C cells were selected (Fig. 1A). No significant changes in basal levels of cell death were noted in any of these cell lines (not shown). Interestingly, similar to control and vector cells, confocal microscopy revealed filamentous and tubular mitochondria in the majority of cells in both K1347A cells and D1994A cells with a mean aspect ratio of 3.2 ± 0.17 and 3.4 ± 0.21, respectively (Fig. 1B–D). Electron microscopy and quantification confirmed thin and long mitochondrial tubules were abundant in K1347A cells and D1994A cells, essentially similar to controls (Fig. 2A and B).
LRRK2 slows mitochondrial fusion
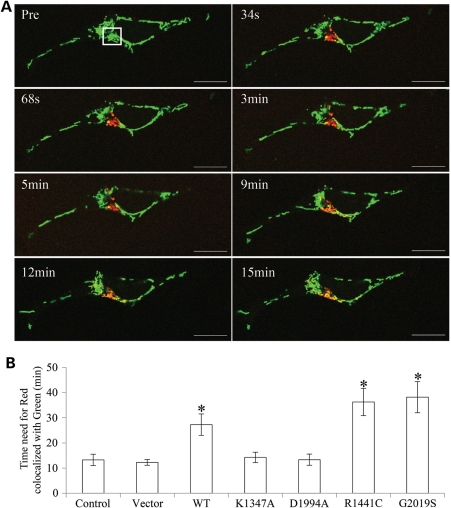
To explore the role of LRRK2 in regulating mitochondrial dynamics, we measured the effect of LRRK2 overexpression on mitochondrial fusion events by using a photo-convertible fluorescence protein, Mito-Dendra2, which can be irreversibly converted from a green (non-activated) to a red fluorescent state (activated) upon laser activation, as described before (27). Briefly, stable SH-SY5Y cells seeded on glass-bottomed culture dishes were transfected with Mito-Dendra2. Two days after transfection, cells were imaged in a well-equipped live imaging station with controlled CO2, humidity and temperature using lower power laser. The positively transfected cells were identified by the presence of bright green signal (Fig. 3A, Pre). Several positively transfected cells with similar shape were chosen and laser activation was applied to a defined region of interest (ROI) of the same size in these cells to allow full photo-conversion, from green to red, of all the mitochondria within the ROI. Thereafter, we were able to track for 60 min the rate of lateral diffusion and the merger of photo-converted red mitochondrial fluorescence with non-activated green signals of the neighboring mitochondria which resulted in a yellow signal as an overall index for fusion events (Fig. 3B). It took 13.2 ± 2.3 min for all the red mitochondria to become yellow in control cells (Fig. 3B). It took longer in WT LRRK2 cells (27.3 ± 4.3 min) and even longer in PD-associated LRRK2 R1441C (36.3 ± 5.4 min) or G2019S (38.2 ± 6.1 min) cells. There was no significant change in mitochondrial fusion observed in vector, K1347A, or D1994A cells compared with control cells (Fig. 3B).
Figure 3.
LRRK2 slows mitochondrial fusion. (A) SH-SY5Y cells were transfected with mito-Dendra2 to label mitochondria. Before photo-conversion (Pre), Dendra2 emits green fluorescence. At time 0, laser activation is applied to ROI (square box) to allow full photo-conversion, from green to red, of all of the mitochondria within the ROI. Thereafter, the lateral diffusion and merger of all the photo-converted red mitochondrial fluorescence with non-activated green signals of the neighboring mitochondria was monitored for 60 min. Scale bar: 20 µm. (B) Quantitative analysis of time needed for the red signal to be completely co-localized with green signal in control, vector, LRRK2 WT, K1347A, D1994A, R1441C and G2019S cells. For each cell line, at least 10 cells were analyzed in each experiment and experiments were repeated three times (*P< 0.05, Student's t-test).
LRRK2 increases mitochondrial recruitment of DLP1
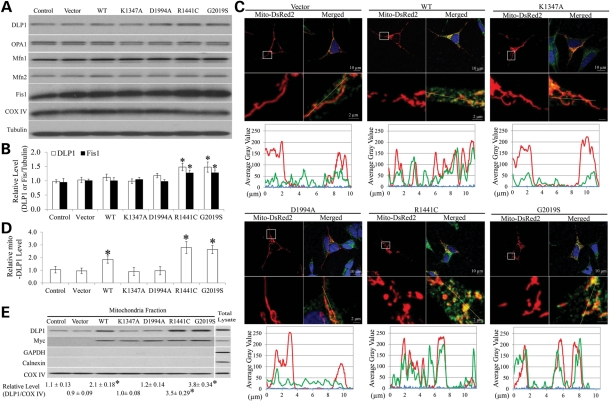
We next investigated the effect of LRRK2 on the expression levels of mitochondrial fission (i.e. DLP1 and Fis1) and fusion proteins (i.e. OPA1, Mfn1, and Mfn2) in these cell lines. Compared with control cells or vector cells, a slight but significant increase in DLP1 and Fis1 levels was noted in R1441C and G2019S cells, while OPA1, Mfn1 and Mfn2 levels remained unchanged (Fig. 4A and B). Overexpression of WT, K1347A or D1994A LRRK2 had no effect on the expression of mitochondrial fission and fusion proteins (Fig. 4A and B).
Figure 4.
LRRK2 increased mitochondrial recruitment of DLP1. Representative immunoblot (A) and quantification analysis (B) of the expression levels of mitochondria fission and fusion proteins in SH-SY5Y cells demonstrated slight but significant increase in DLP1 and Fis1 in R1441C and G2019S cells compared with controls. There was no change in other mitochondria fission and fusion proteins and mitochondrial marker protein COX IV. Equal protein amounts (10 μg) were loaded and tubulin was used as an internal loading control. (C) Representative confocal pictures with line scan (yellow line) of DAPI (blue), DLP1 (green) and mitochondria (red) in SH-SY5Y cell lines demonstrated increased mitochondrial co-localization of DLP1 with mitochondria in WT, R1141C and G2019S cells but not in K1347A and D1994A cells. Boxed areas enlarged immediately below images. (D) Quantification of the immunoreactivity of DLP1 localized to mitochondria. The relative mito-DLP1 level was defined as the relative ratio (control is set as 1) between the intensity of green signal that co-localizes with red signal and the intensity of total red signal. At least 20 cells were analyzed in each experiment (*P< 0.05, when compared with the control cells; Student's t-test). (E) Representative immunoblot and quantification of the relative level of DLP1 in the mitochondria fraction from SH-SY5Y cell lines. myc-immunoreactivity (LRRK2 expression) is also noted in the mitochondrial fraction. The presence of COX IV and absence of GAPDH (cytosolic marker) and calnexin (ER marker) confirm the purity of the mitochondrial fraction preparations. All experiments were repeated three times (*P< 0.05, when compared with the control cells; Student's t-test).
DLP1 recruitment to mitochondria represents a critical step for mitochondrial fission (28). Immunofluorescence revealed that DLP1 only sparsely co-localized with mitochondria in control cells or vector cells (Fig. 4C and D). Overexpression of WT, G2019S or R1441C LRRK2 significantly increased the levels of DLP1 co-localizing with mitochondria (Fig. 4C and D). Notably, overexpression of K1347A or D1994A LRRK2 had no effect on mitochondrial recruitment of DLP1 (Fig. 4C and D). This is also confirmed by immunoblot analysis of DLP1 levels in the subcellular mitochondrial fraction (Fig. 4E). The purity of mitochondrial fraction preparation was confirmed by the lack of GAPDH and calnexin immunoreactivity. Immunoblot and quantitative analyses revealed that mitochondrial DLP1 was increased significantly in WT LRRK2 cells and was further increased in G2019S or R1441C cells compared with control or vector cells (Fig. 4E). Mitochondrial DLP1 levels remained unchanged in K1347A or D1994A cells (Fig. 4E). Correlation analysis revealed that the levels of mitochondrial DLP1 were negatively correlated with mitochondria length (P< 0.001) and positively correlated with the percentage of cells displaying abnormal mitochondrial morphology (P< 0.001) (not shown), suggesting that mitochondrial DLP1 underlies mitochondria fragmentation observed in WT and PD-associated mutant LRRK2 cells.
LRRK2 interacts with DLP1
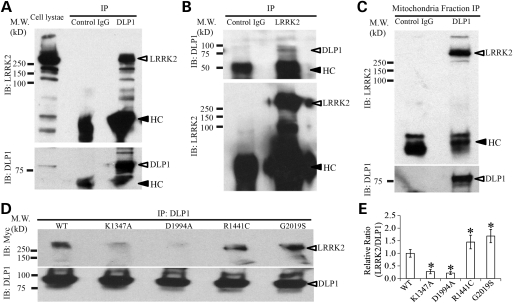
Significant myc-immunoreactivity is noted in the mitochondrial fraction (Fig. 4E), suggesting the presence of LRRK2 in mitochondrial fraction, which is consistent with prior studies (17,18). We hypothesize that LRRK2 expression causes increased mitochondrial DLP1 recruitment through direct interaction. To test this hypothesis, a co-immunoprecipitation (co-IP) was performed using WT LRRK2 cell lysate as described before (29). Immunoprecipitation of DLP1 with anti-DLP1 antibody in radioimmunoprecipitation assay (RIPA) buffer using protein-G magnetic beads could co-IP LRRK2 as detected by anti-LRRK2 antibody (Fig. 5A). Similarly, IP of LRRK2 with anti-LRRK2 could also co-IP DLP1 (Fig. 5B), suggesting that LRRK2 interacts with DLP1. As a negative control, non-specific mouse or rabbit immunoglobulin G (IgG) isotope control antibodies could not co-IP either LRRK2 or DLP1 under identical conditions. Further, using subcellular mitochondrial fraction prepared from WT cells, IP of DLP1 with anti-DLP1 antibody could co-IP LRRK2 in mitochondrial fraction (Fig. 5C), which suggests that DLP1–LRRK2 interaction occurs at mitochondrial membrane. We further compared LRRK2–DLP1 interaction in cell lysates prepared from different LRRK2 cells and found significantly increased levels of LRRK2 co-immunoprecipitated with DLP1 in R1441C and G2019S cells but significantly decreased the levels in K1347A and D1994A cells compared with WT LRRK2 cells (Fig. 5D and E).
Figure 5.
LRRK2 interacts with DLP1. (A and B) Co-immunoprecipitation (co-IP) assay in WT LRRK2 SH-SY5Y cells. Cells were lysed by RIPA buffer and immunoprecipitated (IP) with indicated antibodies and analyzed by immunoblot (IB). Bottom panels show re-probing of upper blots. HC denotes heavy chain. (C) co-IP assay in subcellular mitochondrial fraction prepared from WT SH-SY5Y cells. Mouse mAb IgG isotope control (A and C) or rabbit mAb IgG isotope control (B) was also used as a non-specific negative control (Control IgG). (D and E) Representative co-IP assay and quantification in LRRK2 cells demonstrated significantly increased levels of LRRK2 co-precipitated with DLP1 in R1441C and G2019S cells but significantly decreased levels of LRRK2 co-IP with DLP1 in K1347A and D1994A cells comparing with WT LRRK2 cells. All experiments were repeated three times (*P< 0.05, when compared with WT cells; Student's t-test).
LRRK2-induced mitochondria fragmentation could be completely restored by dominant-negative DLP1
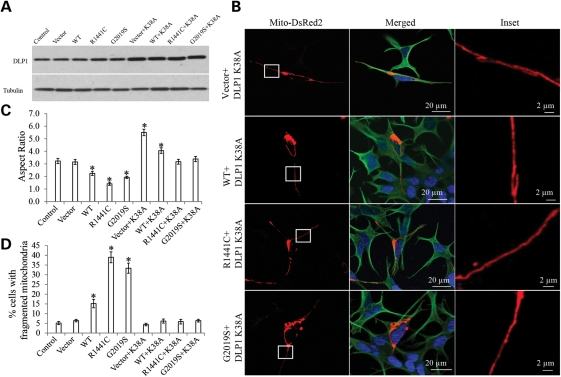
To test whether DLP1 is causally involved in LRRK2-induced mitochondrial fragmentation, we transfected LRRK2 cells with a dominant-negative DLP1 mutant, DLP1 K38A, and generated double-transgenic stable clonal cell lines. Overexpression of DLP1 K38A was verified by immunoblot (Fig. 6A). No significant changes in basal-level cell death in these double-transgenic lines were noted (not shown). Mitochondria morphology was visualized by mito-DsRed2 signal using confocal microscopy (Fig. 6B). Consistent with previous study (27), dominant-negative DLP1 K38A overexpression in vector cells caused obvious mitochondrial elongation as indicated by significant increase in the mitochondrial aspect ratio to 5.5 ± 0.3 (Fig. 6C). Importantly, DLP1 K38A overexpression in WT, R1441C and G2019S cells significantly increased the mitochondria aspect ratio to 4.1 ± 0.2, 3.2 ± 0.2 and 3.4 ± 0.2, respectively (Fig. 6C), which are more comparable with that of control or of vector cells. Indeed, DLP1 K38A overexpression also restored the percentage of cells with fragmented mitochondria to the level comparable with control cells, suggesting the complete restoration of mitochondria morphological abnormality (Fig. 6D).
Figure 6.
LRRK2 induced mitochondria fragmentation could be completely restored by dominant-negative DLP1. (A) Representative immunoblot confirmed the overexpression of DLP1 K38A in double-transgenic stable clonal cell lines. Equal protein amounts (10 μg) were loaded and tubulin was used as an internal loading control. (B) Representative pictures show that overexpression of DLP1 K38A mutant restores LRRK2-induced mitochondria fragmentation in double-transgenic cell lines. Green, tubulin; red, mito-DsRed2; blue, DAPi. Insets represent boxed areas. Quantification of mitochondria morphology showed a significant increase in the aspect ratio (C) and a decrease in the percentage of cells displaying fragmented mitochondria (D) in LRRK2 WT, R1441C and G2019S cells also expressing DLP1 K38A. For each cell line, at least 500 cells were analyzed in each experiment and experiments were repeated three times (*P< 0.05, when compared with the control cells; Student's t-test).
LRRK2-induced mitochondrial dysfunction and cell vulnerability to stress could be rescued by dominant-negative DLP1
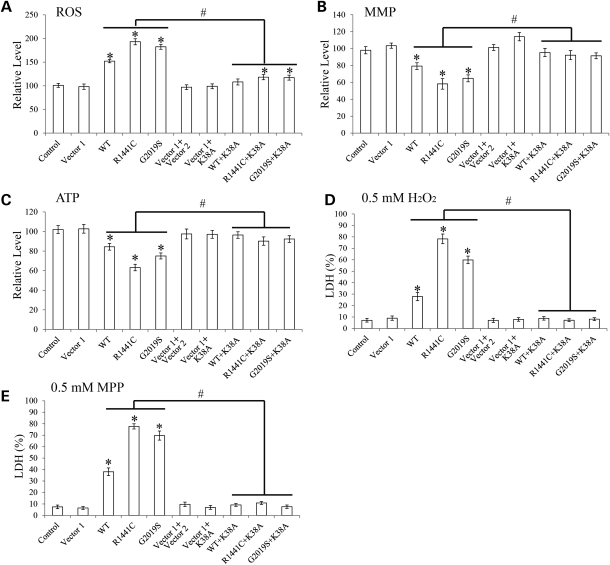
Because changes in mitochondrial morphology could affect mitochondrial function (27), we measured intracellular levels of reactive oxygen species (ROS), mitochondria membrane potential (MMP) and ATP in stable LRRK2 cell lines (Fig. 7A–C). Compared with control or vector cells, the ROS levels were significantly elevated in WT LRRK2 cells and more so in R1441C and G2019S cells (Fig. 7A) while they remained unchanged in K1347A and D1994A cells. Likewise, ATP and MMP were reduced in WT LRRK2 cells and more so in R1441C and G2019S cells (Fig. 7B and C) while they remain unchanged in K1347A and D1994A cells. Interestingly, along with the blockage of mitochondrial fragmentation by overexpression of DLP1 K38A, ROS, ATP and MMP levels in WT LRRK2/DLP1 K38A, R1441C/DLP1 K38A and G2019S/DLP1 K38A double-transgenic clonal lines were restored to the level comparable with that of control cells or vector cells (Fig. 7A–C), suggesting that LRRK2-induced mitochondria dysfunction was dependent on mitochondria fragmentation.
Figure 7.
LRRK2-induced mitochondrial dysfunction and cell vulnerability to stress could be rescued by dominant-negative DLP1. SH-SY5Y cells were seeded on 96-well plates, and the intracellular levels of reactive oxygen species (ROS) (A), mitochondrial membrane potential (MMP) (B) and ATP (C) were measured. SH-SY5Y cells seeded on 96-well plates were treated with 0.5 mm H2O2 (D) or 0.5 mm MPP+ (E) for 24 h. Cell death was measured by LDH release assay. All experiments were repeated three times (asterisk represents P< 0.05 when compared with the control neurons and hash symbol represents P< 0.05 when compared with neurons with only LRRK2 overexpression; Student's t-test).
Overexpression of WT or PD-associated LRRK2 mutants was reported to render neurons vulnerable to oxidative stress and PD-specific toxins (24). We found that although 24 h treatment with 0.5 mm H2O2 did not induce cell death as measured by lactate dehydrogenase (LDH) release assay in control or vector cells, it induced significant cell death in 28% WT LRRK2 cells, 78% R1441C cells and 60% G2019S cells (Fig. 7D). Similarly, 24 h treatment of 0.5 mm 1-methyl-4-phenylpyridinium (MPP+) did not induce cell death in control or vector cells but caused significant cell death in 38% WT LRRK2 cells, 78% R1441C cells and 70% G2019S cells (Fig. 7E). Notably, H2O2- and MPP+-induced cell death was completely prevented in WT LRRK2/DLP1 K38A, R1441C/DLP1 K38A and G2019S/DLP1 K38A double-transgenic clonal lines, suggesting that inhibition of LRRK2-induced mitochondrial fragmentation almost completely prevented LRRK2-induced vulnerability to stress.
LRRK2-induced mitochondrial fragmentation in primary neurons
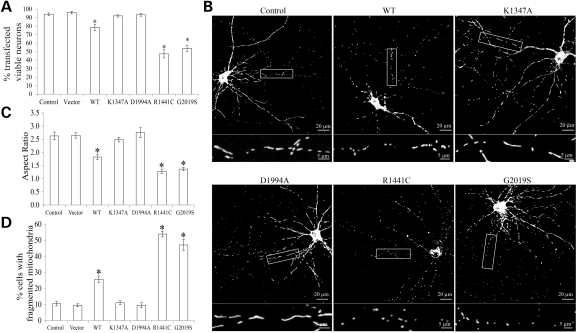
To determine whether PD-associated mutant LRRK2 has similar effect on mitochondria in well-differentiated neuronal cells, rat E18 primary cortical neurons [days in vitro (DIV) = 7] were transiently co-transfected with myc-tagged LRRK2 (WT, K1347A, D1994A, R1441C or G2019S) and mito-DsRed2 at a ratio of 9:1. Two to 3 days after transfection, neurons were fixed, stained and imaged by laser confocal microscopy. Positively co-transfected cells were selected by the presence of both myc-staining and DsRed2 fluorescence. No difference in viability of control and transfected cells was noted 2 days after transfection. However, while vector-transfected neurons maintained 94 ± 1.5% viability 3 days after transfection, consistent with previous study (24), exogenous expression of WT LRRK2 for 3 days caused significantly reduced viability to 79 ± 3.7%, while PD-associated LRRK2 mutants R1441C and G2019S expression resulted in further decrease of neuronal viability after 3 days to 47 ± 4.8 and 54 ± 3.6%, respectively (Fig. 8A). GTP-binding-deficient mutant LRRK2 K1347A and kinase-dead mutant LRRK2 D1994A had no effect on neuronal viability 3 days post-transfection. Therefore, to rule out the effect of neuronal death, mitochondria morphology was investigated in neurons 2 days post-transfection. At this time, >90% of control or empty-vector-transfected neurons demonstrated heterogeneous but predominantly tubular mitochondrial morphology with a mean mitochondrial aspect ratio of 2.6 ± 0.2 (Fig. 8B and C). Expression of WT LRRK2 caused significantly decreased mean mitochondria aspect ratio (1.8 ± 0.1), and significantly increased percentage of neurons with fragmented mitochondria (26 ± 2.0%). The mean mitochondria aspect ratio was further decreased to 1.3 ± 0.1 and 1.4 ± 0.06 in neurons expressing R1441C or G2019S LRRK2, respectively (Fig. 8C), and the percentage of neurons with fragmented mitochondria was also further increased (Fig. 8D). Expression of K1347A or D1994A LRRK2 had no effect on mitochondrial morphology (Fig. 8B–D).
Figure 8.
LRRK2-induced mitochondrial fragmentation in primary neurons. Rat E18 primary cortical neurons (DIV = 7) were transiently co-transfected with myc-tagged LRRK2 (WT, K1347A, D1994A, R1441C or G2019S) and mito-DsRed2 at a ratio of 9:1. Two or three days after transfection, neurons were fixed, stained and imaged by laser confocal microscopy. (A) Quantification of neuronal viability in positively transfected neurons 3 days after transfection. (B–D) Mitochondrial morphology was evaluated 2 days after transfection. Representative images (B) and quantification of mitochondria morphology (C and D) in primary neurons transfected with indicated plasmids. Boxed areas enlarged immediately below. At least 20 cells were analyzed in each experiment and experiments were repeated three times (*P< 0.001, when compared with the control neurons; Student's t-test).
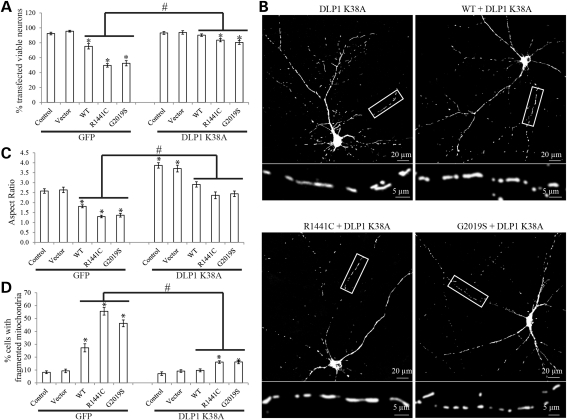
To determine the causal involvement of mitochondrial fission in LRRK2-induced abnormalities in primary neurons, rat primary E18 cortical neurons (DIV = 7) were co-transfected with myc-tagged LRRK2, GFP-tagged DLP1 K38A and mito-DsRed2 at a ratio of 9:1:1. Cell viability was determined 3 days after transfection. GFP-DLP1 K38A co-expression completely blocked cell death in WT LRRK2-transfected cells and also significantly alleviated cell death in R1441C or G2019S LRRK2-transfected neurons, while coexpression with GFP alone had no effect (Fig. 9A). Mitochondrial morphology was determined 2 days after transfection. Co-expression of DLP1 K38A completely blocked WT LRRK2-induced decreased mitochondrial aspect ratio and increased percentage of neurons with fragmented mitochondria and also significantly alleviated changes in these parameters in R1441C or G2019S LRRK2-transfected neurons (Fig. 9B–D). These data suggest that the decrease in mitochondrial fission could rescue LRRK2-induced abnormalities in primary neurons.
Figure 9.
Dominant-negative DLP1 rescued LRRK2-induced mitochondrial abnormalities in primary neurons. Rat E18 primary cortical neurons (DIV = 7) were transiently co-transfected with myc-tagged LRRK2 (WT, R1441C or G2019S), GFP/GFP-tagged DLP1 K38A and mito-DsRed2 at a ratio of 9:1:1. (A) Quantification of neuronal viability in positive transfected neurons 3 days after transfection. Mitochondrial morphology was evaluated 2 days after transfection (B–D). (B) Representative pictures show that co-overexpression of DLP1 K38A mutant prevents LRRK2-induced mitochondria fragmentation in rat E18 primary cortical neurons 2 days after transfection. The boxed area was enlarged immediately below the picture. (C and D) Quantification of mitochondria morphology in primary neurons transfected with indicated plasmids. At least 20 cells were analyzed in each experiment and experiments were repeated three times (asterisk represents P< 0.05 when compared with the control neurons and hash symbol represents P< 0.05 when compared with neurons with only LRRK2 overexpression; Student's t-test).
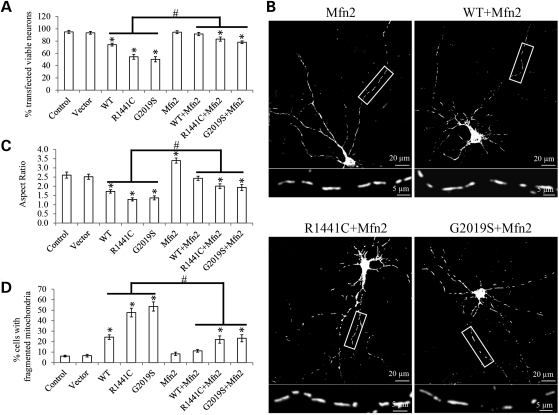
Since we also demonstrated that reduced fusion is involved in LRRK2-induced mitochondrial fragmentation (Fig. 3), we further tested whether increased fusion could rescue LRRK2-induced abnormalities in primary neurons. Rat primary E18 cortical neurons (DIV = 7) were co-transfected with myc-tagged LRRK2, flag-tagged Mfn2 and mito-DsRed2 at a ratio of 9:1:1. Cell viability was measured 3 days after transfection (Fig. 10A) while mitochondrial morphology was determined 2 days after transfection (Fig. 10B and D). Indeed, co-expression of Mfn2 significantly prevented WT, R1441C or G2019S LRRK2-induced cell death (Fig. 10A), decreased mitochondrial aspect ratio (Fig. 10C) and increased percentage of neurons with fragmented mitochondria (Fig. 10D). These studies suggest that enhanced fusion could also alleviate LRRK2-induced abnormalities, thus further confirming the causal involvement of mitochondrial fragmentation in mediating toxic effects of LRRK2.
Figure 10.
Mfn2 overexpression rescued LRRK2-induced mitochondrial abnormalities in primary neurons. Rat E18 primary cortical neurons (DIV = 7) were transiently co-transfected with myc-tagged LRRK2 (WT, R1441C or G2019S), Flag-tagged Mfn2 and mito-DsRed2 at a ratio of 9:1:1. (A) Quantification of neuronal viability in positive transfected neurons 3 days after transfection. Mitochondrial morphology was evaluated 2 days after transfection (B–D). (B) Representative pictures show that co-overexpression of Mfn2 prevents LRRK2-induced mitochondria fragmentation in rat E18 primary cortical neurons. The boxed area was enlarged immediately below the picture. (C and D) Quantification of mitochondria morphology in primary neurons transfected with indicated plasmids. At least 20 cells were analyzed in each experiment, and experiments were repeated three times (asterisk represents P< 0.05 when compared with the control neurons and hash symbol represents when compared with neurons with only LRRK2 overexpression; Student's t-test).
DISCUSSION
In this study, we investigated the effect of LRRK2 expression on mitochondria dynamics, mitochondrial and neuronal functions in SH-SY5Y neuronal cells and primary cortical neurons and reported several major findings: (i) WT LRRK2 expression caused mitochondrial fragmentation that was further exacerbated in neurons expressing PD-associated LRRK2 R1441C or G2019S mutants. Mitochondrial fragmentation was almost completely blocked in neurons expressing GTP-binding deficient mutant K1347A or kinase dead mutant D1994A; (ii) LRRK2-induced mitochondrial fragmentation mediates LRRK2-induced mitochondrial dysfunction and neuronal toxicity; (iii) LRRK2 expression slowed down the mitochondrial fusion process; (iv) LRRK2 caused increased mitochondrial DLP1 recruitment; (v) LRRK2 directly interacted with DLP1 and (vi) LRRK2-induced mitochondrial fragmentation could be blocked by DLP1 K38A or WT Mfn2. Collectively, these results suggest that LRRK2 regulates mitochondrial dynamics through the fission/fusion pathway in neurons and support the notion that defects in the regulation of mitochondrial fission/fusion probably contribute to the pathogenesis of PD.
LRRK2-induced mitochondrial fragmentation could be due to enhanced fission, reduced fusion or both. By using the photo-convertible fluorescent labeling, we were able to demonstrate that a reduced fusion is involved. Indeed, enhanced mitochondrial fusion by overexpressing Mfn2 could alleviate LRRK2-induced mitochondrial fragmentation and toxicity. Along this line, it is of interest to note that alterations in the inner structure of mitochondria as observed in LRRK2-expressing cells (i.e. multilamellar onion-like structure) usually involve mitochondrial fusion proteins (30–32). However, we found no change in the expression in any of the fusion proteins in LRRK2-expressing cells and mechanism(s) underlying reduced fusion remains to be determined. On the other hand, we found increased DLP1 and Fis1 expression in neurons expressing PD-associated LRRK2 mutants. More importantly, increased mitochondrial DLP1 recruitment positively correlated with increased fragmentation in these cells, suggesting that the fission process is likely also affected. Indeed, our study revealed a direct interaction between LRRK2 and DLP1, implicating that LRRK2 may be specifically involved in the regulation of DLP1-dependent mitochondrial fission. Importantly, we demonstrated that PD-associated R1441C and G2019S LRRK2 have stronger interaction that correlates with increased mitochondrial DLP1 recruitment, a critical step during mitochondrial fission. Given that LRRK2 is present in mitochondrial outer membrane and that LRRK2–DLP1 interaction occurs in the mitochondrial fraction, our data suggest that PD-associated LRRK2 mutants probably enhance mitochondrial fission by increasing mitochondrial DLP1 recruitment through increased interaction with DLP1. It is of interest to note that DLP1 also interacts with Aβ in brains from Alzheimer disease patients and mutant huntingtin in brains from Huntington disease patients, which may also play a crucial role in mediating excessive mitochondrial fragmentation identified in these neurodegenerative diseases (33–35).
Most of the PD-associated mutations including the R1441C and G2019S mutations increase kinase activity, and both the kinase and GTPase activities of LRRK2 are required for inducing cell death, suggesting a critical role of the enzymatic activities of LRRK2 in the pathogenesis of PD (24,36). In this study, we found that mitochondrial fragmentation and dysfunction (increased ROS and reduced MMP and ATP) induced by overexpression of LRRK2 (WT or PD-associated mutants) is absent in neurons expressing GTP-binding-deficient mutant K1347A or kinase dead mutant D1994A where kinase activity is completely inhibited, suggesting that kinase activity is also important for LRRK2-induced abnormal mitochondrial dynamics and mitochondrial dysfunction. Indeed, our observations suggest that LRRK2 kinase activity may play an important role in the LRRK2–DLP1 interaction and/or mitochondrial DLP1 translocation since R1441C and G2019S with enhanced kinase activity had much stronger interaction with DLP1 and increased mitochondrial DLP1 recruitment while enzymatic dead K1347A and D1994A had minimal interaction with DLP1 and no effect on mitochondrial DLP1 recruitment. On the one hand, mitochondrial translocation of DLP1 is regulated by phosphorylation (37), and one possibility is that LRRK2 can regulate DLP1 translocation through phosphorylation. However, we failed to detect significant changes in the levels of DLP1 phosphorylated at Ser616 and Ser637, the two known sites involved in mitochondrial DLP1 translocation reported thus far (37), between neurons expressing enzyme-dead or PD-associated LRRK2 mutants (not shown), suggesting that these two sites were not involved. Nevertheless, we could not rule out the possibility that other potential phosphorylation sites at DLP1 may be involved. On the other hand, because LRRK2 kinase domain can phosphorylate the GTP-binding Ras of complex proteins domain and modulate GTPase activity (38) and thus potentially the overall LRRK2 conformation and function, it remains to be determined whether LRRK2 kinase activity affects LRRK2–DLP1 interaction through autophosphorylation or through DLP1 phosphorylation at other potential sites.
We observed that PD-associated LRRK2 mutants cause an increased mitochondrial fragmentation in neurons. However, a prior study demonstrated an increased mitochondrial elongation and interconnectivity in fibroblasts from skin biopsy taken from PD patients with the G2019S LRRK2 mutation (23). The discrepancy may be due to cell-type difference since other studies on PD or Alzheimer disease also noted the difference between fibroblasts and neurons. For example, mitochondria of fibroblasts from patients carrying Parkin mutations demonstrated more branching networks (39) while Parkin-deficiency causes mitochondrial fragmentation in neuronal cells (40). Similarly, elongated mitochondria were observed in fibroblasts from AD patients (41) whereas fragmented mitochondria were found in AD brain and cell models (29).
It is known that mitochondria function is highly dependent on mitochondrial morphology (42,43). In this regard, we found that co-expression of dominant-negative DLP1 K38A restored mitochondrial morphology, and also almost completely rescued mitochondrial functional parameters such as ROS production, MMP and ATP levels in LRRK2-expressing cells, suggesting that enhanced mitochondrial fragmentation contributes to LRRK2-induced mitochondrial dysfunction. Overexpression of LRRK2, especially PD-associated LRRK2 mutants, leads to increased neuronal vulnerability or toxicity which is also rescued by the co-expression of DLP1 K38A or Mfn2 and blockage of mitochondrial fragmentation, suggesting the pivotal role of mitochondria dynamics in LRRK2-induced neuronal vulnerability or toxicity. These studies also suggest that inhibition of mitochondrial fission and/or enhancement of mitochondrial fusion could be beneficial in LRRK2-affected models.
Recent studies demonstrated that abnormal mitochondrial dynamics mediates toxic effects of complex I inhibitors such as MPP and rotenone in toxin models of PD (16). Moreover, α-synuclein, PINK1, Parkin and DJ-1 are all shown to affect mitochondrial morphology (9–15). Interestingly, recent studies also indicated a potential functional interaction between LRRK2, PINK1/Parkin, α-synuclein and mitochondria: Parkin overexpression protects against LRRK2 G2019S mutant-induced and rotenone-enhanced dopaminergic neurodegeneration in the drosophila model (20); PINK1 deficiency-induced neuronal deficit including mitochondrial abnormalities can be suppressed by lrk-1 (i.e. the C. elegans homolog of LRRK2) deficiency and vice versa in a C. elegans model (22). It remains to be determined whether LRRK2 regulate mitochondrial dynamics through the same pathways of α-synuclein and/or PINK1/Parkin.
MATERIALS AND METHODS
Cell culture and transfection
The human dopaminergic neuroblastoma SH-SY5Y cells were grown in Opti-MEM I medium (Invitrogen), supplemented with 5 or 10% (v/v) fetal bovine serum and 1% penicillin–streptomycin. Cells were transfected using Attractene (QIAGEN) according to the manufacturer's instructions. Opti-MEM I culture medium containing 600 μg/ml geneticin (Invitrogen) and/or 300 μg/ml of hygromycin B (Calbiochem) was used for stable cell line selection. The selective medium was replaced every 3 days until the appearance of foci, each apparently derive from a single stably transfected cell. Stable cell lines were then picked and maintained with 300 μg/ml geneticin and/or 200 µg/ml of hygromycin.
Primary neurons from E18 rat cortex (BrainBits) were seeded at 30 000–40 000 cells per well on eight-well chamber slides coated with poly-d-lysine/laminin (BD) in neurobasal medium supplemented with 2% B27 (Invitrogen)/0.5 mm glutamine. Half the culture medium was changed every 3 days. All cultures were kept at 37°C in a humidified 5% CO2-containing atmosphere. More than 90% of the cells were neurons after they were cultured for seven DIV, which was verified by positive staining for the neuronal-specific markers microtubule-associated protein-2 (MAP2, dendritic marker) and Tau-1 (axonal marker). At DIV7, neurons were transfected using Neurofect (Genlantis) according to manufacturer's protocol. For co-transfection, a 9:1 or 9:1:1 ratio (LRRK2: mito-DsRed2 or LRRK2:DLP1 K38A: mito-DsRed2) was applied.
Expression vectors, antibodies, chemicals and measurements
Mito-DsRed2 construct (Clontech), GFP-tagged mutant DLP1 K38A constructs (from Dr. Yisang Yoon, University of Rochester) and myc-tagged LRRK2 (Addgene, deposited by Dr. Mark Cookson, National Institutes of Health) were obtained. The expression plasmid for DLP1 K38A and Mfn2 were constructed based on the pCMV-Tag3 Vector (Stratagene). Mito-Dendra2 was used as described before (41). Primary antibodies used included rabbit anti-LRRK2 monoclonal antibody (Epitomics, MJFF3), mouse anti-DLP1/OPA1 (BD), mouse anti-Mfn1 (Novus Biologicals), mouse anti-Mfn2/COX I (Sigma), rabbit anti-Fis1 (Imgenex), mouse anti-GAPDH (Chemicon), rabbit anti-α-tubulin (Epitomics), rabbit anti-phospho-DLP1 (Ser616 or Ser637) (Cell Signaling), mouse anti-α-tubulin/Myc/COX IV (Cell Signaling) and anti-calnexin (Millipore). Rabbit mAb IgG isotype control (DA1E) and mouse mAb IgG1 isotype control (G3A1) (Cell Signaling) were not directed against any known antigen and were used for negative controls in immunoprecipitation experiments. 1-Methyl-4-phenylpyridinium/N-aetyl-l-cysteine (Sigma) and H2O2 (Sigma) were also obtained.
Cell death and viability in SH-SY5Y cells was measured by Cytotoxicity Detection Kit (LDH; Roche) and Cell Proliferation Kit (MTT; Roche), respectively. ATP levels were measured by the ATP Colorimetric/Fluorometric Assay Kit (Biovision). The ROS level and mitochondrial membrane potential was measured as described before (27). Neuronal viability propidium iodide assay in cultured primary neurons was performed as described previously (44). Neurons with propidium iodide-positive nuclei and/or obvious fragmented nuclear/neurites were counted as non-viable neurons. Neurons without propidium iodide-positive nuclei and clear nuclear contour/neurites were also counted as viable neurons.
Western blot analysis, immunoprecipitation and mitochondria isolation
Cells were lysed with 1× Cell Lysis Buffer (Cell Signaling) or RIPA buffer, plus 1 mm phenylmethylsulfonyl fluoride (Sigma) and Protease Inhibitor Cocktail (Sigma). Equal amounts of total protein extract (5 or 20 μg) were resolved by sodium dodecyl sulfate polyacrylamide gel electrophoresis and transferred to Immobilon-P (Millipore). Following blocking with 10% nonfat dry milk, primary and secondary antibodies were applied as described previously (41), and the blots were developed with Immobilon western Chemiluminescent HRP Substrate (Millipore). Immunoprecipitation was performed with anti-DLP1/myc/LRRK2 antibodies in RIPA buffer using Dynabeads® Protein G—IP Kit (Invitrogen) and analyzed by western blot as described previously (29). Mitochondria were isolated from cells using a mitochondrial isolation kit (Pierce) following the manufacturer's protocol. Isolated mitochondria were lysed with Cell Lysis Buffer (Cell Signaling) or RIPA buffer, and then underwent direct western blot analysis or immunoprecipitation.
Immunofluorescence, electron microscopy and time-lapse imaging
For immunofluorescence, neuronal cells cultured on four- or eight-well chamber slides were fixed and stained as described previously (41). All fluorescence images were captured at room temperature with a Zeiss LSM 510 inverted laser-scanning confocal fluorescence microscope (controlled through Zeiss LSM 510 confocal software, Zeiss) equipped with an Alpha-Plan Fluor 100× NA 1.45 oil objective (working distance: 0.11 mm; Zeiss) as described previously (29). Confocal images of far-red fluorescence were collected using 633 nm excitation light from a HeNe laser and a 650 nm long-pass filter; images of red fluorescence were collected using 543 nm excitation light from an argon laser and a 560 nm long-pass filter; and green fluorescence images were collected using 488 nm excitation light from an argon laser and a 500–550 nm bandpass barrier filter. For electron microscopy analysis, cells cultured on the Aclar embedding film (2 mil thickness, Electron Microscopy Sciences) were fixed in 2.5% glutaraldehyde and 4% sucrose in a 0.05 mol/l phosphate buffer, pH 7.4, and examined with a JEOL 1200EX electron microscope (Tokyo, Japan) as described previously (41). For time-lapse imaging, neuronal cells were seeded in glass-bottomed dishes (MatTek) and then transfected with LRRK2 and mito-DsRed2. Forty-eight or 72 h after transfection, cells were placed in a well-equipped environmental chamber with controlled CO2 content, humidity and temperature and imaged at 37°C by the Zeiss LSM 510 inverted laser-scanning confocal fluorescence microscope (controlled through Zeiss LSM 510 confocal software, Zeiss) also with the Alpha-Plan Fluor 100× NA 1.45 oil objective (working distance: 0.11 mm, Zeiss). During time-lapse imaging, frames were captured every 5 or 10 s for at least 1 h without phototoxicity or photobleaching.
Image analysis
Image analysis was also performed with open-source image-analysis programs WCIF ImageJ (developed by W. Rasband). Mitochondria morphology was quantified as described previously (45). Taken briefly, raw images were background corrected, linearly contrast optimized, applied with a 7 × 7 ‘top hat’ filter, subjected to a 3 × 3 median filter and then thresholded to generate binary images. Most mitochondria were well separated in binary images and large clusters of mitochondria were excluded automatically. All binary images were analyzed by Image J to provide information of the mitochondria aspect ratio (ratio between major and minor axes of an ellipse equivalent to the mitochondrion). The researchers counting mitochondria abnormalities or cell death were all blinded to the identity of the experiment.
Conflict of Interest statement. G.P. is a consultant for Takeda Pharmaceuticals and Neurotez and owns stock options in Neurotez and Voyager. X.Z. was a consultant for and received grant support from Medivation.
FUNDING
This work was supported by the National Institutes of Health (R21 NS071184 to X.Z.), the American Parkinson's Disease Association to X.Z. and the Dr Robert M. Kohrman Memorial Fund to X.Z.
REFERENCES
- 1.Mata I.F., Wedemeyer W.J., Farrer M.J., Taylor J.P., Gallo K.A. LRRK2 in Parkinson's disease: protein domains and functional insights. Trends Neurosci. 2006;29:286–293. doi: 10.1016/j.tins.2006.03.006. [DOI] [PubMed] [Google Scholar]
- 2.Zimprich A., Biskup S., Leitner P., Lichtner P., Farrer M., Lincoln S., Kachergus J., Hulihan M., Uitti R.J., Calne D.B., et al. Mutations in LRRK2 cause autosomal-dominant parkinsonism with pleomorphic pathology. Neuron. 2004;44:601–607. doi: 10.1016/j.neuron.2004.11.005. [DOI] [PubMed] [Google Scholar]
- 3.Paisan-Ruiz C., Jain S., Evans E.W., Gilks W.P., Simon J., van der Brug M., Lopez de Munain A., Aparicio S., Gil A.M., Khan N., et al. Cloning of the gene containing mutations that cause PARK8-linked Parkinson's disease. Neuron. 2004;44:595–600. doi: 10.1016/j.neuron.2004.10.023. [DOI] [PubMed] [Google Scholar]
- 4.Lesage S., Brice A. Parkinson's disease: from monogenic forms to genetic susceptibility factors. Hum. Mol. Genet. 2009;18:R48–R59. doi: 10.1093/hmg/ddp012. [DOI] [PubMed] [Google Scholar]
- 5.Henchcliffe C., Beal M.F. Mitochondrial biology and oxidative stress in Parkinson disease pathogenesis. Nat. Clin. Pract. Neurol. 2008;4:600–609. doi: 10.1038/ncpneuro0924. [DOI] [PubMed] [Google Scholar]
- 6.Chan D.C. Mitochondria: dynamic organelles in disease, aging, and development. Cell. 2006;125:1241–1252. doi: 10.1016/j.cell.2006.06.010. [DOI] [PubMed] [Google Scholar]
- 7.Knott A.B., Perkins G., Schwarzenbacher R., Bossy-Wetzel E. Mitochondrial fragmentation in neurodegeneration. Nat. Rev. Neurosci. 2008;9:505–518. doi: 10.1038/nrn2417. [DOI] [PMC free article] [PubMed] [Google Scholar]
- 8.Su B., Wang X., Zheng L., Perry G., Smith M.A., Zhu X. Abnormal mitochondrial dynamics and neurodegenerative diseases. Biochim. Biophys. Acta. 2010;1802:135–142. doi: 10.1016/j.bbadis.2009.09.013. [DOI] [PMC free article] [PubMed] [Google Scholar]
- 9.Irrcher I., Aleyasin H., Seifert E.L., Hewitt S.J., Chhabra S., Phillips M., Lutz A.K., Rousseaux M.W., Bevilacqua L., Jahani-Asl A., et al. Loss of the Parkinson's disease-linked gene DJ-1 perturbs mitochondrial dynamics. Hum. Mol. Genet. 2010;19:3734–3746. doi: 10.1093/hmg/ddq288. [DOI] [PubMed] [Google Scholar]
- 10.Sandebring A., Thomas K.J., Beilina A., van der Brug M., Cleland M.M., Ahmad R., Miller D.W., Zambrano I., Cowburn R.F., Behbahani H., et al. Mitochondrial alterations in PINK1 deficient cells are influenced by calcineurin-dependent dephosphorylation of dynamin-related protein 1. PLoS ONE. 2009;4:e5701. doi: 10.1371/journal.pone.0005701. [DOI] [PMC free article] [PubMed] [Google Scholar]
- 11.Yang Y., Ouyang Y., Yang L., Beal M.F., McQuibban A., Vogel H., Lu B. Pink1 regulates mitochondrial dynamics through interaction with the fission/fusion machinery. Proc. Natl Acad. Sci. USA. 2008;105:7070–7075. doi: 10.1073/pnas.0711845105. [DOI] [PMC free article] [PubMed] [Google Scholar]
- 12.Deng H., Dodson M.W., Huang H., Guo M. The Parkinson's disease genes pink1 and parkin promote mitochondrial fission and/or inhibit fusion in Drosophila. Proc. Natl Acad. Sci. USA. 2008;105:14503–14508. doi: 10.1073/pnas.0803998105. [DOI] [PMC free article] [PubMed] [Google Scholar]
- 13.Poole A.C., Thomas R.E., Andrews L.A., McBride H.M., Whitworth A.J., Pallanck L.J. The PINK1/Parkin pathway regulates mitochondrial morphology. Proc. Natl Acad. Sci. USA. 2008;105:1638–1643. doi: 10.1073/pnas.0709336105. [DOI] [PMC free article] [PubMed] [Google Scholar]
- 14.Kamp F., Exner N., Lutz A.K., Wender N., Hegermann J., Brunner B., Nuscher B., Bartels T., Giese A., Beyer K., et al. Inhibition of mitochondrial fusion by alpha-synuclein is rescued by PINK1, Parkin and DJ-1. EMBO J. 2010;29:3571–3589. doi: 10.1038/emboj.2010.223. [DOI] [PMC free article] [PubMed] [Google Scholar]
- 15.Exner N., Treske B., Paquet D., Holmstrom K., Schiesling C., Gispert S., Carballo-Carbajal I., Berg D., Hoepken H.H., Gasser T., et al. Loss-of-function of human PINK1 results in mitochondrial pathology and can be rescued by parkin. J. Neurosci. 2007;27:12413–12418. doi: 10.1523/JNEUROSCI.0719-07.2007. [DOI] [PMC free article] [PubMed] [Google Scholar]
- 16.Wang X., Su B., Liu W., He X., Gao Y., Castellani R.J., Perry G., Smith M.A., Zhu X. DLP1-dependent mitochondrial fragmentation mediates 1-methyl-4-phenylpyridinium toxicity in neurons: implications for Parkinson's disease. Aging Cell. 2011;10:807–823. doi: 10.1111/j.1474-9726.2011.00721.x. [DOI] [PMC free article] [PubMed] [Google Scholar]
- 17.Biskup S., Moore D.J., Celsi F., Higashi S., West A.B., Andrabi S.A., Kurkinen K., Yu S.W., Savitt J.M., Waldvogel H.J., et al. Localization of LRRK2 to membranous and vesicular structures in mammalian brain. Ann. Neurol. 2006;60:557–569. doi: 10.1002/ana.21019. [DOI] [PubMed] [Google Scholar]
- 18.West A.B., Moore D.J., Biskup S., Bugayenko A., Smith W.W., Ross C.A., Dawson V.L., Dawson T.M. Parkinson's disease-associated mutations in leucine-rich repeat kinase 2 augment kinase activity. Proc. Natl Acad. Sci. USA. 2005;102:16842–16847. doi: 10.1073/pnas.0507360102. [DOI] [PMC free article] [PubMed] [Google Scholar]
- 19.Saha S., Guillily M.D., Ferree A., Lanceta J., Chan D., Ghosh J., Hsu C.H., Segal L., Raghavan K., Matsumoto K., et al. LRRK2 modulates vulnerability to mitochondrial dysfunction in Caenorhabditis elegans. J. Neurosci. 2009;29:9210–9218. doi: 10.1523/JNEUROSCI.2281-09.2009. [DOI] [PMC free article] [PubMed] [Google Scholar]
- 20.Ng C.H., Mok S.Z., Koh C., Ouyang X., Fivaz M.L., Tan E.K., Dawson V.L., Dawson T.M., Yu F., Lim K.L. Parkin protects against LRRK2 G2019S mutant-induced dopaminergic neurodegeneration in Drosophila. J. Neurosci. 2009;29:11257–11262. doi: 10.1523/JNEUROSCI.2375-09.2009. [DOI] [PMC free article] [PubMed] [Google Scholar]
- 21.Venderova K., Kabbach G., Abdel-Messih E., Zhang Y., Parks R.J., Imai Y., Gehrke S., Ngsee J., Lavoie M.J., Slack R.S., et al. Leucine-rich repeat kinase 2 interacts with Parkin, DJ-1 and PINK-1 in a Drosophila melanogaster model of Parkinson's disease. Hum. Mol. Genet. 2009;18:4390–4404. doi: 10.1093/hmg/ddp394. [DOI] [PubMed] [Google Scholar]
- 22.Samann J., Hegermann J., von Gromoff E., Eimer S., Baumeister R., Schmidt E. Caenorhabditits elegans LRK-1 and PINK-1 act antagonistically in stress response and neurite outgrowth. J. Biol. Chem. 2009;284:16482–16491. doi: 10.1074/jbc.M808255200. [DOI] [PMC free article] [PubMed] [Google Scholar]
- 23.Mortiboys H., Johansen K.K., Aasly J.O., Bandmann O. Mitochondrial impairment in patients with Parkinson disease with the G2019S mutation in LRRK2. Neurology. 2010;75:2017–2020. doi: 10.1212/WNL.0b013e3181ff9685. [DOI] [PubMed] [Google Scholar]
- 24.West A.B., Moore D.J., Choi C., Andrabi S.A., Li X., Dikeman D., Biskup S., Zhang Z., Lim K.L., Dawson V.L., et al. Parkinson's disease-associated mutations in LRRK2 link enhanced GTP-binding and kinase activities to neuronal toxicity. Hum. Mol. Genet. 2007;16:223–232. doi: 10.1093/hmg/ddl471. [DOI] [PubMed] [Google Scholar]
- 25.Liu Z., Hamamichi S., Dae Lee B., Yang D., Ray A., Caldwell G.A., Caldwell K.A., Dawson T.M., Smith W.W., Dawson V.L. Inhibitors of LRRK2 kinase attenuate neurodegeneration and Parkinson-like phenotypes in Caenorhabditis elegans and Drosophila Parkinson's disease models. Hum. Mol. Genet. 2011;20:3933–3942. doi: 10.1093/hmg/ddr312. [DOI] [PMC free article] [PubMed] [Google Scholar]
- 26.Smith W.W., Pei Z., Jiang H., Dawson V.L., Dawson T.M., Ross C.A. Kinase activity of mutant LRRK2 mediates neuronal toxicity. Nat. Neurosci. 2006;9:1231–1233. doi: 10.1038/nn1776. [DOI] [PubMed] [Google Scholar]
- 27.Wang X., Su B., Siedlak S.L., Moreira P.I., Fujioka H., Wang Y., Casadesus G., Zhu X. Amyloid-beta overproduction causes abnormal mitochondrial dynamics via differential modulation of mitochondrial fission/fusion proteins. Proc. Natl Acad. Sci. USA. 2008;105:19318–19323. doi: 10.1073/pnas.0804871105. [DOI] [PMC free article] [PubMed] [Google Scholar]
- 28.Yoon Y., Pitts K.R., Dahan S., McNiven M.A. A novel dynamin-like protein associates with cytoplasmic vesicles and tubules of the endoplasmic reticulum in mammalian cells. J. Cell Biol. 1998;140:779–793. doi: 10.1083/jcb.140.4.779. [DOI] [PMC free article] [PubMed] [Google Scholar]
- 29.Wang X., Su B., Lee H.G., Li X., Perry G., Smith M.A., Zhu X. Impaired balance of mitochondrial fission and fusion in Alzheimer's disease. J. Neurosci. 2009;29:9090–9103. doi: 10.1523/JNEUROSCI.1357-09.2009. [DOI] [PMC free article] [PubMed] [Google Scholar]
- 30.Santel A., Frank S., Gaume B., Herrler M., Youle R.J., Fuller M.T. Mitofusin-1 protein is a generally expressed mediator of mitochondrial fusion in mammalian cells. J. Cell Sci. 2003;116:2763–2774. doi: 10.1242/jcs.00479. [DOI] [PubMed] [Google Scholar]
- 31.Olichon A., Baricault L., Gas N., Guillou E., Valette A., Belenguer P., Lenaers G. Loss of OPA1 perturbates the mitochondrial inner membrane structure and integrity, leading to cytochrome c release and apoptosis. J. Biol. Chem. 2003;278:7743–7746. doi: 10.1074/jbc.C200677200. [DOI] [PubMed] [Google Scholar]
- 32.Rojo M., Legros F., Chateau D., Lombes A. Membrane topology and mitochondrial targeting of mitofusins, ubiquitous mammalian homologs of the transmembrane GTPase Fzo. J. Cell Sci. 2002;115:1663–1674. doi: 10.1242/jcs.115.8.1663. [DOI] [PubMed] [Google Scholar]
- 33.Song W., Chen J., Petrilli A., Liot G., Klinglmayr E., Zhou Y., Poquiz P., Tjong J., Pouladi M.A., Hayden M.R., et al. Mutant huntingtin binds the mitochondrial fission GTPase dynamin-related protein-1 and increases its enzymatic activity. Nat. Med. 9999;17:377–382. doi: 10.1038/nm.2313. [DOI] [PMC free article] [PubMed] [Google Scholar]
- 34.Manczak M., Calkins M.J., Reddy P.H. Impaired mitochondrial dynamics and abnormal interaction of amyloid beta with mitochondrial protein Drp1 in neurons from patients with Alzheimer's disease: implications for neuronal damage. Hum. Mol. Genet. 2011;20:2495–2509. doi: 10.1093/hmg/ddr139. [DOI] [PMC free article] [PubMed] [Google Scholar]
- 35.Shirendeb U., Reddy A.P., Manczak M., Calkins M.J., Mao P., Tagle D.A., Reddy P.H. Abnormal mitochondrial dynamics, mitochondrial loss and mutant huntingtin oligomers in Huntington's disease: implications for selective neuronal damage. Hum. Mol. Genet. 2011;20:1438–1455. doi: 10.1093/hmg/ddr024. [DOI] [PMC free article] [PubMed] [Google Scholar]
- 36.Cookson M.R. The role of leucine-rich repeat kinase 2 (LRRK2) in Parkinson's disease. Nat. Rev. Neurosci. 2010;11:791–797. doi: 10.1038/nrn2935. [DOI] [PMC free article] [PubMed] [Google Scholar]
- 37.Chang C.R., Blackstone C. Dynamic regulation of mitochondrial fission through modification of the dynamin-related protein Drp1. Ann. N. Y. Acad. Sci. 2010;1201:34–39. doi: 10.1111/j.1749-6632.2010.05629.x. [DOI] [PMC free article] [PubMed] [Google Scholar]
- 38.Greggio E., Taymans J.M., Zhen E.Y., Ryder J., Vancraenenbroeck R., Beilina A., Sun P., Deng J., Jaffe H., Baekelandt V., et al. The Parkinson's disease kinase LRRK2 autophosphorylates its GTPase domain at multiple sites. Biochem. Biophys. Res. Commun. 2009;389:449–454. doi: 10.1016/j.bbrc.2009.08.163. [DOI] [PMC free article] [PubMed] [Google Scholar]
- 39.Mortiboys H., Thomas K.J., Koopman W.J., Klaffke S., Abou-Sleiman P., Olpin S., Wood N.W., Willems P.H., Smeitink J.A., Cookson M.R., et al. Mitochondrial function and morphology are impaired in parkin-mutant fibroblasts. Ann. Neurol. 2008;64:555–565. doi: 10.1002/ana.21492. [DOI] [PMC free article] [PubMed] [Google Scholar]
- 40.Lutz A.K., Exner N., Fett M.E., Schlehe J.S., Kloos K., Lammermann K., Brunner B., Kurz-Drexler A., Vogel F., Reichert A.S., et al. Loss of parkin or PINK1 function increases Drp1-dependent mitochondrial fragmentation. J. Biol. Chem. 2009;284:22938–22951. doi: 10.1074/jbc.M109.035774. [DOI] [PMC free article] [PubMed] [Google Scholar]
- 41.Wang X., Su B., Fujioka H., Zhu X. Dynamin-like protein 1 reduction underlies mitochondrial morphology and distribution abnormalities in fibroblasts from sporadic Alzheimer's disease patients. Am. J. Pathol. 2008;173:470–482. doi: 10.2353/ajpath.2008.071208. [DOI] [PMC free article] [PubMed] [Google Scholar]
- 42.Chen H., Chomyn A., Chan D.C. Disruption of fusion results in mitochondrial heterogeneity and dysfunction. J. Biol. Chem. 2005;280:26185–26192. doi: 10.1074/jbc.M503062200. [DOI] [PubMed] [Google Scholar]
- 43.Chen H., Detmer S.A., Ewald A.J., Griffin E.E., Fraser S.E., Chan D.C. Mitofusins Mfn1 and Mfn2 coordinately regulate mitochondrial fusion and are essential for embryonic development. J. Cell Biol. 2003;160:189–200. doi: 10.1083/jcb.200211046. [DOI] [PMC free article] [PubMed] [Google Scholar]
- 44.Aras M.A., Hartnett K.A., Aizenman E. Assessment of cell viability in primary neuronal cultures. Curr. Protoc. Neurosci. 2008 doi: 10.1002/0471142301.ns0718s44. Chapter 7, Unit 7.18. [DOI] [PubMed] [Google Scholar]
- 45.Koopman W.J., Distelmaier F., Esseling J.J., Smeitink J.A., Willems P.H. Computer-assisted live cell analysis of mitochondrial membrane potential, morphology and calcium handling. Methods. 2008;46:304–311. doi: 10.1016/j.ymeth.2008.09.018. [DOI] [PubMed] [Google Scholar]


