


Abstract
With the availability of next-generation sequencing (NGS) technology, it is expected that sequence variants may be called on a genomic scale. Here, we demonstrate that a deeper understanding of the distribution of the variant call frequencies at heterozygous loci in NGS data sets is a prerequisite for sensitive variant detection. We model the crucial steps in an NGS protocol as a stochastic branching process and derive a mathematical framework for the expected distribution of alleles at heterozygous loci before measurement that is sequencing. We confirm our theoretical results by analyzing technical replicates of human exome data and demonstrate that the variance of allele frequencies at heterozygous loci is higher than expected by a simple binomial distribution. Due to this high variance, mutation callers relying on binomial distributed priors are less sensitive for heterozygous variants that deviate strongly from the expected mean frequency. Our results also indicate that error rates can be reduced to a greater degree by technical replicates than by increasing sequencing depth.
INTRODUCTION
Second-generation DNA sequencing has revolutionized many biomedical areas. It especially accelerated the discovery of disease genes in medical genetics (1,2) and is now about to enter diagnostics (3). In order to translate this technology into a reliable tool for molecular diagnostics for human genetics and other fields, it will be necessary to further reduce error rates of sequence variant detection. Understanding the process of how the high-throughput sequencing data arise is crucial for the development of sensitive genotype calling algorithms. It is well known in the field that especially the error rates in detecting heterozygous mutations in diploid genomes are still considerably higher than the comparable error rates of homozygous variants—even at high levels of sequence coverage (4,5).
It is currently widely assumed that the frequencies of calls at heterozygous sites in NGS data are binomially distributed, an assumption that has been incorporated into many variant calling programs for NGS data (6–8). We were motivated to question this assumption by observations of more extreme probability distributions in whole-exome sequencing (WES) data sets, as we will demonstrate in this article. We therefore analyzed the key steps in NGS data generation from a stochastic point of view and identified the amplification of sequence fragments during library preparation before measurement as crucial for the distribution of allele frequencies at heterozygous genomic loci.
We reasoned that the generation of fragments can be described as a Bienaymé–Galton–Watson branching process with discrete time steps, which is a model that has been widely used by physicists and mathematicians in population genetics (9–11). In this work, we provide a detailed description of the fragment amplification process. We then show that our model accurately reflects allele frequencies in real WES data sets. One prediction of our model is that technical replication is more effective in reducing error rates than merely sequencing more reads from the same library, which we confirmed on a data set with nine technical WES replicates. Our results have important implications for understanding the causes of false-negative errors in NGS diagnostics.
MATERIALS AND METHODS
Exome sequencing and variant detection
Human blood or tissue samples of 17 anonymized donors were used for exome sequencing. For one of these individuals, nine technical replicates were generated. This means nine independent samples of the same individual were collected and further processed independently. For each sample, genomic DNA was enriched for the target region of all human CCDS exons (12) with Agilent's SureSelect Human All Exon Kit and subsequently sequenced on a Illumina Genome Analyzer II with 100 bp single end reads. The enrichment of adapter-modified DNA fragments before sequencing includes an amplification step of 18 cycles of polymerase chain reaction (PCR) in the standard protocol. For one exome, 36 cycles of PCR were run to analyze the effect of the cycle number onto the allele frequency distribution. The cluster generation step follows after the library preparation. Its purpose is to increase the fluorescent signal of a fragment on the sequencing flow cell, so that it becomes detectable. The cluster generation includes another 35 PCR cycles in the standard protocol. The raw data of ∼5 GB per exome was mapped to the haploid human reference sequence hg19 with novoalign (13) resulting in a mean coverage of the exome target region of 50x. In this study, heterozygous sequence variant detection was restricted to positions of high human variability as defined by dbSNP132 positions, in order to decrease the probability of false positive calling errors. A genomic position was called as a heterozygous variant if >20 sequence reads covered this position in the reference-based sequence alignment and if the ratio of the non-reference allele to the sum of the non-reference allele and the reference allele was between 0.14 and 0.86. This heterozygous detection algorithm was shown to be highly sensitive for a coverage >20 (14). For the replicates we classified a locus as truly heterozygous, if it was classified as heterozygous by the above described calling criterion and by SAMtools (15) in at least six out of nine replicates.
Heterozygous allele frequencies
The reference allele frequency at a genomic position that was classified as heterozygous as described above is defined as the number of fragments that map to this position, cover the variable base and show the reference allele, divided by all fragments covering this site. There are two well-known biases that shift the detected mean reference allele frequency from the expected value of 0.5 to slightly higher values: (i) SureSelect baits that were used for exon enrichment are designed as 120 bp antisense oligonucleotides to the haploid reference sequence of the latest Human Genome Build. This means DNA hybridization between sample DNA fragments containing common variants, that differ from the reference sequence, may be weaker as compared with hybrids without mismatches. This may lead to a slightly more effective enrichment of sequence fragments containing the reference allele. (ii) After sequencing, all short sequence reads are mapped to the haploid reference sequence. Sequence fragments containing non-reference allele variants have a lower mapping quality. For short read lengths, reads with low base quality and low sequence complexity, this may result in a slightly reduced mapping ratio of non-reference allele fragments (16,17). Due to this in vitro enrichment as well as in silico read mapping-bias, the allele frequency distribution shifted toward the reference allele (in our analyzed exome data sets from 0.5 to 0.54). However, as these biases are systematic and not stochastic in nature they do not influence the variance of the allele frequency distribution.
Distributions of heterozygous allele frequencies are position- and individual independent
The dependence of the allele frequency distribution on genomic position as well as on the individual was tested on human exome data sets. Position dependence was tested by comparing the distribution of all heterozygous allele frequencies in an individual to a smaller random subset of these positions (Supplementary Figure S3). The comparison between these distributions did not show significant differences by chi-squared testing. The dependence on the individual was tested by comparing the differences of heterozygous allele distributions between different individuals and technical replicates of the same individual. The difference in frequency distributions between different individuals is statistically not significant and fluctuations in these distributions are comparable to those observed in technical replicates of the same individual. Since allele frequencies are position- and individual independent, we computed the heterozygous allele frequency distribution from SNP loci pooled from all sequenced exomes.
RESULTS AND DISCUSSION
Fragment amplification as a stochastic branching process
Suppose that we have a tube that initially contains a set of different alleles such as illustrated in Figure 1A. We now perform K cycles of a PCR on these alleles, which basically means adding a certain number of copies of these alleles to the tube in discrete time steps. This is an essential part of current NGS library preparation protocols that are used to enrich adapter-ligated DNA fragments (18).
Figure 1.
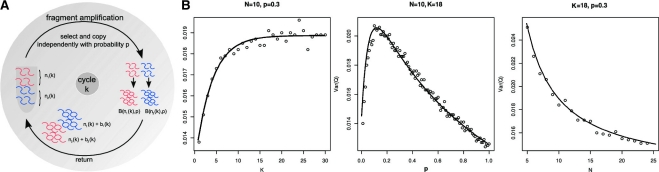
The fragment amplification as a stochastic branching process. (A) The distribution of the allele frequencies depends on a parameter P that represents the efficiency of the PCR and the probability that an allele is amplified, the cycle number K, and on the initial number of alleles N. (B) The variance of the allele frequency after amplification was sampled from simulations for P ranging from 0 (no amplification) to 1 (perfect duplication in each PCR cycle), for different cycle numbers K and numbers of starting alleles N. The measurement process of sequencing was simulated for a read coverage of 20×. The variance sampled from 10 000 simulated heterozygous SNPs and depicted as black circles (o), is well approximated by the analytical results of Equation (4) (black line). For a cycle number of K > 20, the variance does not change significantly. The variance reaches its maximum for an amplification probability around P=0.2. For an increasing number of alleles before amplification, the variance approximates a fixed level, explained solely by the variance introduced by the measurement process of sequencing.
For the mathematical description of this process, we will introduce a Markov chain, that corresponds to a Galton–Watson branching process consisting of two populations. Although we will study this process in our work only for biallelic single nucleotide polymorphisms (SNPs), it may be generalized to all sequence variants.
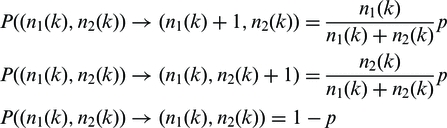
The preparation of a genomic DNA sample starts by shearing the chromosomal DNA into sequence fragments of a few hundred base pairs. We will discuss in the following only fragments that contain a variable base of an SNP, which means we can distinguish between two possible classes of fragments, those containing the base of allele A1 and those that contain the base of allele A2. We consider the fragmentation as random and unbiased. This means that the extensions into both directions from the variable position is uniform and only limited by fragment size. We also assume that the numbers n1 and n2 of the fragments containing allele A1 and A2 are of the same order of magnitude after fragmentation, as the DNA originates from many cells of a single diploid genome (see Supplementary Figure S4 for exceptions from this assumption). Before sequencing (at time step k = 0), adaptor oligomers are ligated to the fragments and a PCR is run for K cycles. For successful amplification, adaptors must be attached to both ends of the fragment. The initial number of amplifiable fragments, n1 = n1(0) and n2 = n2(0), is in the order of dozens. For each such fragment, the attachment of the polymerase to the adaptor is a prerequisite for amplification. We assume that the probability of this event depends only on the total number of polymerase molecules, which remains the same in every PCR cycle k, and the sum of amplifiable fragments, n1(k) + n2(k), but is independent of the variant itself. For not too large K, we may assume that polymerase is always in excess of n1(k) + n2(k), and thus a constant fraction of fragments will be bound by polymerase. We will use the parameter p in the main manuscript to describe the cycle and allele-independent probability that a fragment is copied (in the Supplementary methods we perform the calculations for allele-specific amplification probabilities, p1 and p2). We now describe the probabilities of the three possible transitions of a random allele in PCR cycle k, assuming that the Markov condition holds:
 |
(1) |
The whole system thus transits to:
| (2) |
where (b1(k), b2(k)) are realizations of binomially distributed random variables B(n1(k), p) and B(n2(k), p) (Figure 1A).
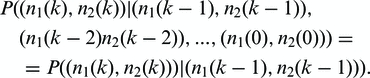
The ratio 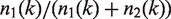 describes the proportion of allele A1 after the k-th amplification cycle and this is the allele frequency that we expect to measure by sequencing multiple read fragments of this pool. Note that sequencing itself will contribute to the totally measured variance. Sequencing itself may be understood as a random sample of finite size, which is the sequencing depth, on the allele pool after amplification. We are thus primarily interested in the distribution of the random variable Q(k) describing the ratio of alleles after amplification. The distribution of alleles after step k solely depends on the distribution of alleles in step k − 1:
 |
(3) |
The entire process is determined by the probability generating function of the offspring distribution. Appropriately scaled, the law of Q(k) approaches a normal distribution (10). We derived the first and second moments of the offspring distribution (see Supplementary Methods for a detailed calculus) to compute the asymptotic variance of Q(k):
| (4) |
assuming that n1(0) = n2(0) = N.
According to a standard NGS protocol, we simulated the amplification process of our model depicted in Figure 1A for K = [1, 30], N = [5, 25], for P ranging from 0 to 1 and a sequencing depth of 20×. We computed the variance of the resulting allele frequency ratio for 10 000 SNPs (Figure 1B) which is the expected order of magnitude for heterozygous variant calls in a human exome. The behavior of the variances sampled from our simulations is well described by function (4) adapted by the additional contribution of variance introduced by sequencing. For fixed P and N, the variance increases with a growing number of PCR cycles K and approaches a constant level for K > 15. This also means that increasing the number of cycles in the library preparation above the default value of K > 18, as well as amplification of the cluster generation step that succeeds the library preparation will only contribute marginally to the total variance. For fixed K and N, the variance has its maximum around P = 0.2 and decreases for P tending to 1. This is clear as with perfect amplification, we expect the initial ratio of  to remain constant. For fixed K and P, the variance decreases with an increasing number of alleles before amplification. It is easier for one allele to gain predominance in the pool that is sequenced if the initial allele set is small, the amplification efficiency is low and enough PCR cycles are run.
High variance of heterozygous allele frequencies in real human exome data sets
After modeling the amplification step as stochastic process, we analyzed the distribution of allele frequencies at heterozygous genomic loci in real human exome data that were generated following a standard protocol with 18 PCR amplification cycles. In order to compare the empirically measured frequencies with our simulated data, all heterozygous SNP positions that were covered by more than 20 reads were downsampled to 20 reads per position. The allele frequencies were derived from these read sets. The variance of the measured reference allele distribution is 0.017 and thus markedly larger than the variance of 0.012 that is expected for hypothetical sequencing before amplification (this is the variance of a binomial distribution where n represents the sequencing depth and the success parameter is the ratio of the alleles in the starting solution, Figure 2A). Thus, the sequence fragments in a short read alignment, on which the variant call is performed, are not properly represented by a random sample of the initial ratio of 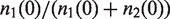 , but the effect of the amplification process on this distribution has to be taken into account.
Figure 2.
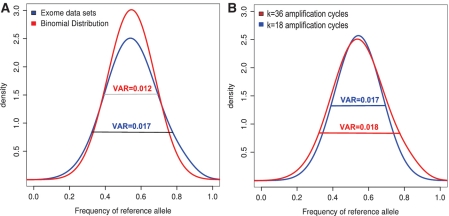
Variance of the measured allele frequency at heterozygous genomic positions in NGS exome data sets. (A) The distribution of heterozygous allele frequencies measured in exome data sets at 20× coverage (blue) compared to the theoretical distribution expected before amplification (red). The variance of the real distribution after amplification is significantly larger. (B) An exome of the same individual was sequenced following 18 and 36 cycles of amplification. As expected from theory, the variance of the allele frequencies only slightly increases after the additional 18 cycles of amplification.
Our model assumes a constant amplification efficiency over all PCR cycles, which seems to be a reasonable simplification given the relatively low number of PCR cycles used in NGS library preparation protocols. A value of P ∈ [0.3, 0.5] yielded a variance for the allele frequencies that is close to the value determined on the real exome data (Figures 1B and 2A). We measured the amount of fragmented DNA used as input in our WES experiments at k = 0 (5 ng) and measured about 5 − 10 μg after K = 18 cycles of amplification. This corresponds to an amplification by a factor of 1 − 2×10³, and thus values of P ∈ [0.3, 0.5] are realistic.
As already discussed, with fixed P and N the variation is approaching a limit for increasing K and for K > 15 it hardly changes. To check this experimentally, we sequenced the exome of the same individual that was amplified with 36 PCR cycles instead of 18. As expected by Equation (4), no significant increase in the variance could be detected (Figure 2B). We also studied the effect of the succeeding cluster amplification step by analyzing the variance of the difference of heterozygous allele frequencies of a library preparation that was sequenced after two different cluster generations. In contrast to the library preparation, the effect of the cluster generation on the total variance of the allele frequency is negligible (Supplementary Table S2).
Influence of allele frequency variance on error rates in heterozygous variant detection
Assuming comparable read qualities, the variant call is based on a random sample drawn from the set consisting of all alleles A1 and A2 after amplification which is of size n1(k) + n2(k). The coverage or sequencing depth at a variant site is equivalent to the size of the random sample on which the call is based. We hypothesized that a certain rate of true heterozygous alleles will not be called due to the high variance in allele frequencies after amplification (i.e. false-negative calls). To test this, we generated nine exome replicates of the same individual and classified genomic loci as heterozygous if they were called heterozygous in at least six out of nine replicates by two accepted calling algorithms (see ‘Material and Methods’ section). Figure 3A shows the common polymorphism rs539412, that was called as heterozygous variant in the first four replicates, but failed to be called as heterozygous variant in the fifth replicate due to low frequency. Using this as a gold standard, we then measured the false-negative rate for calls based on each of the single WES data sets. Over the whole exome, we measured a false-negative rate between 1% and 3% depending on the coverage with the default settings of a widely used variant caller (Figure 3B). In a usual exome, one expects between 10 000 and 15 000 heterozygous variants. Our results indicate that one will miss around a hundred heterozygous variants by sequencing an exome only once simply due to the stochastic fluctuation of the allele frequencies after amplification. Surprisingly a variant calling approach that is simply based on a heterozygous allele frequency interval f with [14% < f < 86%], as suggested in Ref. (14), has higher sensitivity at a comparable specificity (see ROC analysis in Supplementary Figure S2) than a more sophisticated variant calling algorithm that uses the wrong prior distribution for the allele frequencies independent of the coverage (Figure 3B). Additionally for a sequencing depth above 30× the false negative rate does not decrease further. Thus, once a sufficient sequencing depth has been reached, only technical replication is able to further reduce the total error rates substantially (Figure 3B and Supplementary Table S1).
Figure 3.

Influence of variance in measured allele frequency on variant calling. (A) The genotype at the SNP position rs539412 has been called as heterozygous variant in the first four replicates, but was not detected in the fifth replicate due to low frequency. (B) The false negative error rate decreases with increasing sequencing depth. At low total sequencing depth, the error rate is markedly reduced by considering pools of technical replicates. The classification of a genotype as heterozygous based on a simple frequency interval (heterozygous if the non-reference allele frequency is between 14% and 86%) is more sensitive than a calling algorithm that uses a binomial prior distribution as default setting for the allele distribution. The false negative error can be further reduced by considering an additional technical replicate (see also Supplementary Table S1).
Final remarks
In this work, we studied the distribution of alleles at heterozygous genomic positions as measured in NGS data sets. A solid knowledge of distribution and variance of allele calls at heterozygous loci is important as it is an essential prior information for many variant calling approaches. Besides, the distribution of the allele frequency also plays a role in algorithms used to detect copy number variations or sample contaminations.
We have demonstrated that amplification steps contribute considerably to the total variance of this distribution. We modeled the fragment generation process as a Bienaymé–Galton–Watson branching process and showed that the variance is accurately described by Equation (4). For typical values of the efficiency P of the amplification process and sequencing depth, this is substantially higher than the variance of the corresponding binomial distribution (Figure 2A). Clearly, the higher the variance of allele calls at heterozygous loci, the higher the false negative error will be. Ultimately, calling errors arising from random events during library preparation and fragment amplification could be avoided in single molecule sequencing techniques of the future (19) and we are eager to see these data.
From our analytical results, one may draw some conclusions about how to reduce the stochastic fluctuactions coming from the amplification step: increasing the efficiency of the adaptor ligation (which is increasing N), increasing p and reducing the number of PCR cycles K in a second-generation protocol will help to reduce the variance of heterozygous alleles.
NGS technologies such as whole-exome and genome sequencing are beginning to be used for diagnostic purposes. In this setting, it is critical to provide an estimation of the sensitivity of these approaches. Clearly, it is important to report regions of the exome that are not sufficiently covered for reliable variant calling. In addition, our results suggest that it is also important to evaluate the variance at heterozygous SNP positions as it might serve as an indicator of the quality of an experiment and thus for the overall false-negative error rate. The sensitivity of an exome screen that is based on data of a second-generation sequencing platform is not only bound by the coverage of the target region but is also affected by amplification which is inherent to the method.
SUPPLEMENTARY DATA
Supplementary Data is available at NAR Online: Supplementary Tables 1 and 2, Supplementary Figures 1–4, Supplementary Methods.
FUNDING
Funding for open access charge: Deutsche Forschungsgemeinschaft (DFG KR 3985/1-1 to P.M.K.).
Conflict of interest statement. None declared.
Supplementary Material
ACKNOWLEDGEMENTS
P.M.K. wishes to thank Claudia Bickenbach for her invaluable support.
REFERENCES
- 1.Ng SB, Buckingham KJ, Lee C, Bigham AW, Tabor HK, Dent KM, Huff CD, Shannon PT, Jabs EW, Nickerson DA, et al. Exome sequencing identifies the cause of a Mendelian disorder. Nat. Genet. 2010;42:30–35. doi: 10.1038/ng.499. [DOI] [PMC free article] [PubMed] [Google Scholar]
- 2.Robinson PN, Krawitz P, Mundlos S. Strategies for exome and genome sequence data analysis in disease gene discovery projects. Clin. Genet. 2011;80:127–132. doi: 10.1111/j.1399-0004.2011.01713.x. [DOI] [PubMed] [Google Scholar]
- 3.Choi M, Scholl UI, Ji W, Liu T, Tikhonova IR, Zumbo P, Nayir A, Bakkalolu A, zen S, Sanjad S, et al. Genetic diagnosis by whole exome capture and massively parallel DNA sequencing. Pro. Natl Acad. Sci. USA. 2009;106:19096–19101. doi: 10.1073/pnas.0910672106. [DOI] [PMC free article] [PubMed] [Google Scholar]
- 4.Nothnagel M, Herrmann A, Wolf A, Schreiber S, Platzer M, Siebert R, Krawczak M, Hampe J. Technology specific error signatures in the 1000 Genomes Project data. Hum. Genet. 2010;130:505–516. doi: 10.1007/s00439-011-0971-3. [DOI] [PubMed] [Google Scholar]
- 5.Harismendy O, Ng PC, Strausberg RL, Wang X, Stockwell TB, Beeson KY, Schork NJ, Murray SS, Topol EJ, Levy S, et al. Evaluation of next generation sequencing platforms for population targeted sequencing studies. Genome Bio. 2009;10:R32. doi: 10.1186/gb-2009-10-3-r32. [DOI] [PMC free article] [PubMed] [Google Scholar]
- 6.Li H, Ruan J, Durbin R. Mapping short DNA sequencing reads and calling variants using mapping quality scores. Genomes Res. 2008;18:1851–1858. doi: 10.1101/gr.078212.108. [DOI] [PMC free article] [PubMed] [Google Scholar]
- 7.Li R, Li Y, Kristiansen K, Wang J. SOAP: short oligonucleotide alignment program. Bioinformatics. 2008;24:713–714. doi: 10.1093/bioinformatics/btn025. [DOI] [PubMed] [Google Scholar]
- 8.Goya R, Sun MGF, Morin RD, Leung G, Ha G, Wiegand KC, Senz J, Crisan A, Marra MA, Hirst M, et al. SNVMix: predicting single nucleotide variants from next-generation sequencing of tumors. Bioinformatics. 2010;26:730–736. doi: 10.1093/bioinformatics/btq040. [DOI] [PMC free article] [PubMed] [Google Scholar]
- 9.Athreya KB, Ney PE. Branching Processes. Berlin: Springer; 1972. [Google Scholar]
- 10.Yakovlev AY, Yanev NM. Relative frequencies in multitype branching processes. Ann. Appl. Probab. 2009;19:1–14. [Google Scholar]
- 11.Polya G, Szegö G. Problems and Theorems in Analysis I. Berlin: Springer; 1970. [Google Scholar]
- 12.Pruitt KD, Harrow J, Harte RA, Wallin C, Diekhans M, Maglott DR, Searle S, Farrell CM, Loveland JE, Ruef BJ, et al. The consensus coding sequence (CCDS) project: identifying a common protein-coding gene set for the human and mouse genomes. Genome Res. 2009;19:1316–1323. doi: 10.1101/gr.080531.108. [DOI] [PMC free article] [PubMed] [Google Scholar]
- 13. Hercus, C. (2011) Novoalign V2.07. www.novocraft.com (3 August 2011, date last accessed) [Google Scholar]
- 14.Bell CJ, Dinwiddie DL, Miller NA, Hateley SL, Ganusova EE, Mudge J, Langley RJ, Zhang L, Lee CC, Schilkey FD, et al. Carrier testing for severe childhood recessive disease by next generation sequencing. Sci. Trans. Med. 2011;3:64–69. doi: 10.1126/scitranslmed.3001756. [DOI] [PMC free article] [PubMed] [Google Scholar]
- 15.Li H, Handsaker B, Wysoker A, Fennell T, Ruan J, Homer N, Marth G, Abecasis G, Durbin R. The Sequence Alignment/Map format and SAMtools. Bioinformatics. 2010;25:2078–2079. doi: 10.1093/bioinformatics/btp352. [DOI] [PMC free article] [PubMed] [Google Scholar]
- 16.Degner JF, Marioni JC, Pai A, Pickrell JK, Nkadori E, Gilad Y, Pritchard JK. Effect of read-mapping biases on detecting allele-specific expression from RNA-sequencing data. Bioinformatics. 2009;25:3207–3212. doi: 10.1093/bioinformatics/btp579. [DOI] [PMC free article] [PubMed] [Google Scholar]
- 17.Krawitz P, Rdelsperger C, JŁger M, Jostins L, Bauer S, Robinson PN. Microindel detection in short-read sequence data. Bioinformatics. 2010;26:722–729. doi: 10.1093/bioinformatics/btq027. [DOI] [PubMed] [Google Scholar]
- 18.Bentley DR, Balasubramanian S, Swerdlow HP, Smith GP, Milton J, Brown CG, Hall KP, Evers DJ, Barnes CL, Bignell HR, et al. Accurate whole human genome sequencing using reversible terminator chemistry. Nature. 2008;456:53–59. doi: 10.1038/nature07517. [DOI] [PMC free article] [PubMed] [Google Scholar]
- 19.Timp W, Mirsaidov UM, Wang D, Comer J, Aksimentiev A, Timp G. Nanopore sequencing: electrical measurements of the code of life. IEEE Trans. Nanotechnol. 2010;9:281–294. doi: 10.1109/TNANO.2010.2044418. [DOI] [PMC free article] [PubMed] [Google Scholar]
Associated Data
This section collects any data citations, data availability statements, or supplementary materials included in this article.