


Abstract
Peptide recognition domains and transcription factors play crucial roles in cellular signaling. They bind linear stretches of amino acids or nucleotides, respectively, with high specificity. Experimental techniques that assess the binding specificity of these domains, such as microarrays or phage display, can retrieve thousands of distinct ligands, providing detailed insight into binding specificity. In particular, the advent of next-generation sequencing has recently increased the throughput of such methods by several orders of magnitude. These advances have helped reveal the presence of distinct binding specificity classes that co-exist within a set of ligands interacting with the same target. Here, we introduce a software system called MUSI that can rapidly analyze very large data sets of binding sequences to determine the relevant binding specificity patterns. Our pipeline provides two major advances. First, it can detect previously unrecognized multiple specificity patterns in any data set. Second, it offers integrated processing of very large data sets from next-generation sequencing machines. The results are visualized as multiple sequence logos describing the different binding preferences of the protein under investigation. We demonstrate the performance of MUSI by analyzing recent phage display data for human SH3 domains as well as microarray data for mouse transcription factors.
INTRODUCTION
The wiring diagram of cellular signaling pathways is formed by specific molecular interactions involving proteins, DNA and other molecules (1,2). Among these, signaling protein–protein interactions typically consist of protein domains [such as kinases (3–5), SH3 (6) or PDZ (7,8)] binding short unstructured regions on their target proteins. These regions are characterized by very specific linear sequence motifs that are recognized by the domain they bind to. For instance, SH3 domains are known to target PxxP motifs with a positively charged residue either on the left (Class I, [R/K]xxPxxP), or on the right (Class II, PxxP[R/K]) of the proline-rich region (6). Similarly, DNA binding domains of transcription factors (TF) make direct contact with short stretches of nucleotides that display high sequence specificity (9). This specificity is crucial for enabling proteins to interact selectively with their cognate partners within the crowded intra-cellular environment. Detailed understanding of binding specificity encoded in these motifs is very powerful to accurately predict novel interactions (4,10–13) and for the design of new inhibitor compounds (14).
Various technologies, such as microarrays (12,15,16), SPOT arrays (17), phospho-proteomics arrays (18), or phage display (19), have been designed to characterize the binding specificity of protein domains and transcription factors. Data from these experiments enable computational models to describe binding specificity. One well-known such model is the Position Weight Matrix (PWM, also known as Position-Specific Scoring Matrix). This model has been widely applied to characterize the binding specificity of both peptide recognition domains and transcription factors (20–23). However, several recent studies suggest that the use of single PWMs leads to a reductive view of binding specificity, since a PWM does not consider correlations between different ligand positions (5,16,24,25). To overcome this limitation, different strategies have been developed based on neural networks (5), hidden Markov models (25) or clustering (24,26). The latter describes binding specificity with multiple PWMs corresponding to clusters of ligands that follow the same specificity. The results of such analysis can be readily visualized as multiple sequence logos. Clear examples of multiple specificity were encountered in several peptide recognition domain families (24), as well as in transcription factors (16).
Most of these computational tools work efficiently with up to a few hundred ligands. However, recent technological advances have increased the throughput of the aforementioned experimental methods by several orders of magnitude. In particular, combining the power of phage display with next-generation sequencing currently enables the retrieval of thousands of different ligands binding to the same domain (27,28). This deluge of data represents both a challenge and an opportunity. On the one hand, it requires more efficient and faster processing systems. On the other hand, it enables analysis at greater resolution, such as distinguishing between different multiple binding specificities. Here, we introduce the integrated system MUltiple Specificity Identifier (MUSI) that addresses both these issues, enabling high-throughput analysis of large data sets and detecting novel multiple specificity. MUSI provides a simple interface for processing short peptide or nucleic acid sequence data. Starting from a set of sequences observed to bind to a given target, it automatically generates an optimal number of PWMs based on the different specificity patterns present in the data. The results are graphically displayed in a table of sequence logos (Figure 1). These are useful for visualizing the different binding specificities. The numerical values of the different PWMs are also provided so that the user can quantitatively compare them, or use them to predict protein–protein or protein–DNA interactions. We expect MUSI to be particularly relevant to researchers working with phage-display, peptide arrays, protein binding microarrays or similar high-throughput technologies to map binding specificity of protein interaction domains, RNA-binding proteins or transcription factors.
Figure 1.

General diagram of MUSI describing the steps from sequence files to multiple sequence logos. With typical FASTA input, MUSI optionally removes redundant sequences, then runs multiple sequence alignment. It then predicts multiple binding specificity. Finally, it generates logos (Examples: Src SH3 domain, and smad3 TF). When handling raw and barcoded sequencing reads (FASTQ) (for multiplexed applications), it begins by filtering and sorting by barcodes. The red arrows indicate different starting points that can be selected by the user depending on the kind of input data.
MATERIALS AND METHODS
MUSI aims to provide a robust and user-friendly interface to identify multiple specificity within a set of sequences (either peptides or nucleic acids). Usually, these sequences would share some common property, such as binding to the same target. The algorithm behind MUSI is based on the idea of fitting several linear probabilistic models (in our case, PWMs) to a set of sequences to optimally describe the different specificity classes. It relies on the mathematical tools of mixture models and uses a Maximum Likelihood approach with Dirichlet priors for fitting. It accepts a variety of input formats from raw Illumina sequencing reads (FASTQ) to peptide or nucleotide sequences in standard FASTA files. The program can be executed from the command line or with a Graphical User Interface (GUI).
Preprocessing of the data
First, a set of N unique sequences is generated by removing duplicates, since multiple occurrences of the same sequence are often not very informative in terms of specificity and could originate from experimental biases (e.g. artificial amplification of the same ligand along experimental procedure). These sequences are then aligned using MAFFT, a sequence alignment tool (29). In the case of short ligands binding to a linear epitope, internal gaps are not very structurally meaningful and may even prevent relavant specificities from being distinguished. Hence, we use a large gap opening penalty that is iteratively increased until internal gaps are eliminated. Both the redundancy removal and alignment steps can be optionally skipped in MUSI. Special options are available for FASTQ data pre-processing (described later).
Algorithm
Starting from a set of N aligned sequences, we use a mixture model to identify multiple PWMs (24). Aligned sequences are modeled as strings of M letters, taken from an alphabet of size S (S = 20 for proteins and S = 4 for DNA or RNA). In this model, the specificity is described with K different PWMs where  corresponds to the probability of residue or nucleotide i at position l according to the kth PWM. A weight πk is also associated with each PWM. The goal of the algorithm is therefore to identify the optimal parameters
  and πk. For a given K, this optimization is carried out using standard Maximum Likelihood with the Expectation-Maximization (EM) algorithm (24,26). For each optimization, we generate 10 random initial configurations (i.e. 10 random assignments of the sequences to K groups) and keep the one that gives the highest log-likelihood value.
The problem of finding an optimal value for K is more challenging and several different methods have been designed, such as the Bayesian Inference Criterion or Kolmogorov–Smirnov tests (30). Here, the number of PWMs is automatically determined by the algorithm in the following way. Starting from K = 1 PWM, we iteratively increment K by one and run the mixture model as described previously. The new configuration with K + 1 PWMs is accepted if:
Each PWM has a weight πk larger than P = 0.01 and larger than 5/N (if N > 5).
For any pair of PWMs the Euclidean distance between the probabilities of at least two positions is larger than a cut-off distance D. In other words, for all (k, k′), k ≠ k′, there exist at least two distinct positions l1 and l2 such that
 and
and 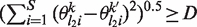 .
.K < Kmax
Condition (i) ensures that each specificity is represented by the minimal number of sequences in the input data. This is important to prevent spurious PWMs supported by only one or two sequences that most likely result from sub-optimal maxima in the EM optimization or false-positives in the experimental data. Condition (ii) prevents redundancy among the different specificities identified by the algorithm by ensuring that any pair of PWMs has at least two positions with significantly different specificities. This typically results from positional correlations between these positions, which are known to underlie multiple specificity (24). The maximal number of PWMs (Kmax) in condition (iii) is set to 10 by default, but can be modified by the user. To prevent the algorithm from terminating too early because of criterion (ii), we chose a relatively small value of D = 0.5. As a last post-processing step, we merge pairs of PWMs with less than two positions with a Euclidean distance larger than D′ = 0.63. These cut-off values were manually chosen based on our experience with the method in order to ensure that multiple PWMs are not redundant. Different choices for P, D and D′ do not significantly affect the performance of the algorithm, as shown in Supplementary Table S1. Alternatively, the number of PWMs can also be fixed by the user.
The time complexity of this algorithm scales as O(NMK) if the number of PWMs is fixed and O(NMK2) if it is decided by the algorithm. In particular, it runs much faster than a previous method (24) that relied on a clustering of the ligands scaling typically as O(N2). As such it can be applied to very large data sets consisting of thousands of sequences in a few seconds (see ‘Results’ section).
Output
The results of the mixture model are used to draw sequence logos corresponding to each specificity and these can be displayed in a table such as the one shown in Figure 1. Additionally, the numerical values of both the single and multiple PWMs, together with their weights, can be exported for subsequent analysis, such as genome or proteome scanning to predict protein–DNA or protein–protein interactions. For each sequence in the input set, we also provide its probability with respect to each of the PWMs (so-called responsibilities). These are useful to estimate which of the different specificity classes each ligand belongs to.
Pipeline requirements
MUSI is written in Perl and C++. It uses the Biologically Relevant Analysis of Interaction Networks (BRAIN) library, which is built on top of Biojava (31), to generate the sequence logos (PDF and PNG files) (32). It uses MAFFT (29) to align the sequences. Both are integrated in the system. The Graphical User Interface (GUI) for Mac OS X is a Cocoa wrapper for perl scripts, written in Objective C. For PDF table generation, pdfLaTeX is required.
The pipeline is available for download (http://www.kimlab.org/software/musi) and runs locally on most platforms (Mac OS X, Linux and UNIX, the GUI version is only available on Mac OS X). Detailed installation instructions are provided on the website.
Processing raw reads from an Illumina sequencer
A set of special input options is included in MUSI to process FASTQ sequence data labeled by barcodes. These features enable straightforward processing of data obtained from Illumina sequencing. Supplementary Figure S1 summarizes the different steps described here.
Filtering reads using the Phred quality score
To obtain high-quality results with minimal noise from sequencing, the sequences are filtered based on quality scores. To measure sequencing quality, our system averages the Phred scores within each sequence (33). Users can select separate minimum average Phred scores for the sequence, forward barcode and reverse barcode. This is because the quality of reads tends to decrease toward the end of each sequence. The default threshold for all three sections is 25 (99.7% sequencing accuracy)
Sort by barcodes
Multiplexing using barcodes is commonly used to make optimal use of sequencing capacity. Hence, MUSI supports multiplexing, by sorting processed reads according to a user-supplied list of barcodes. In this step, the system sorts reads from different barcodes into separate files to process many domains at once.
After sorting and filtering, MUSI continues processing as described earlier for FASTA files.
Experimental data sets
All sets of nucleotides binding to 305 different transcription factors and homeodomains come from three studies based on protein binding microarrays (16,34,35) and were downloaded from the UniPROBE website (36). By testing all possible 8-mers, this technique generates both positive and negative data. We used a cut-off values of 0.35 on the enrichment score to define positives and of −0.3 to define negative data, To map the specificity of the human Src SH3 domain, we used phage-display technology (19), where very large libraries of random peptides can be expressed on the surface of phage particles. The phage colonies were then sequenced with Illumina deep sequencing. In this way, a total of 2457 unique peptides were identified to bind to Src SH3 domain (raw data for this domain can be downloaded from http://www.kimlab.org/software/musi).
Comparison with BEEML
To compare MUSI with BEEML (37), we have downloaded intensity information (normalized intensities and 60-mer probe sequences) and seed PWMs from UniPROBE (36) for each protein from Berger et al. (35). After running BEEML on each pair of inputs, we have used the PWMs from BEEML to perform cross-validation in the same way as cross-validation of PWMs from UniPROBE.
RESULTS
Cross-validation
To probe the accuracy of the different PWMs generated by MUSI, we performed standard 10-fold cross-validation. We used the data from UniPROBE (36) consisting of in vitro DNA sequences binding to different transcription factors generated with protein binding microarrays (16,34,35). We split the positives and negatives into 10 groups for cross-validation. The multiple PWMs were generated with MUSI based on 9 of the 10 groups (training set), and used to compute the score of the sequences in the last group (testing set). As MUSI does not incorporate information about negative data sets, only positive examples were used to build the multiple PWMs. The procedure was repeated 10 times for each domain, each time using a different group of positives and negatives for the testing set. Figure 2 shows the average of Receiver Operating Curve (ROC) over all transcription factors and all 10 cross-validation runs. We compared MUSI results with the PWMs generated by the BEEML method (37), the MEME software (with the maximum number of motifs set to five) (38), as well as the ones provided on the UniPROBE website itself. Both MEME and UniPROBE methods are able to detect cases of multiple specificity. All four methods performed well in terms of cross-validation, with MUSI still giving statistically significantly higher Area Under the ROC (AUC) values (Figure 2 and Supplementary Figures S2–S4).
Figure 2.

Averaged ROC from 305 test sets [transcription factor binding sites from (16,34,35)] for 3 algorithms, (MUSI, UniPROBE and MEME) (Mean AUC: 0.9721, 0.9167 and 0.9192, respectively).
CPU performance
A crucial requirement for MUSI is to perform efficiently with large data sets. Figure 3 shows the results in CPU time for different sets of nucleic acids and peptides. Each point represents either a nucleotide or peptide data set (MUSI is blue and MEME is red). The CPU time of MUSI including all steps from redundancy removal and alignment to logo generation grows linearly with the size of the input, enabling the processing of tens of thousands of unique sequences in a short time. Comparison with the MEME and the method of (24) (Figure 3) as well as BEEML (Supplementary Figure S4) software shows that MUSI runs orders of magnitude faster than these two methods.
Figure 3.

Performance comparison. CPU time for MUSI, MEME and the method of (24) (blue, red, magenta, respectively) measured on the standard UNIX system. Genomic data sets (305 in total) from UniPROBE are used as inputs. Other unpublished proteomic data sets obtained from phage display (451 different domains) were used as inputs for MUSI (inset, green points). The number of sequences in the proteomic data sets varies from 1 (0.59 s) to 12 323 (301 s). The black curve in the inset represents logged linear curve fitted to MUSI runtimes for proteomic data sets.
Using MUSI as a denoising tool
A common issue with high-throughput experimental techniques is the high rate of false positives. It is therefore useful to understand how MUSI performs on noisier data sets. To investigate this, we used the experimental phage display data for the human SH3 domain and mixed them with increasingly higher numbers of randomly generated peptides (excluding random peptides that by chance were already present in the initial set). We observed that, in general, the presence of false-positives yields one additional completely unspecific PWM (Supplementary Figure S5) that contains almost all randomly generated peptides.
Using MUSI with longer sequences
Another important issue can arise with the length of the input sequences, since motifs spread out within long sequences are much more difficult to automatically identify. To test this possible limitation, we added random flanking sequences on both sides of the phage display peptide data for the human SH3 domain. We observed that multiple specificity is correctly detected as long as the total size of the flanking sequences remains <40 (Supplementary Figure S6). This clearly exceeds the size of the motif itself. However, we stress that MUSI works optimally with sequences that are relatively short to enable the motifs to be accurately detected.
Human SH3 domain multiple specificity
The novel phage display data obtained for Src SH3 domain reveal how several interesting features can be detected with MUSI (Figure 4A). SH3 domains have long been classified into two main specificity classes summarized with the motifs [R/K]xxPxxP (Class I) and PxxPx[R/K] (Class II) (6). From biochemical and crystallographic studies, SRC SH3 domain is known to accommodate ligands of both classes. This can also be seen in the multiple specificity profiles of Figure 4A. Interestingly, SRC SH3 domain binds ASAP1 and this interaction is critical for the ASAP1 phosphorylation and membrane trafficking role (39). Although ASAP1 contains several proline rich regions, only two of them are known to bind SRC SH3 domains (39). The sequences of these two regions [(UniProt identifier: Q9ULH1) 791–797: PPLPPRN and 892–898: RVLPKLP] match exactly the two specificity profiles predicted by MUSI (see Figure 4a) and correspond to the two best hits of the multiple PWMs model along the ASAP1 sequence, while the single PWM failed to identify the first binding site. This further highlights how careful distinction between different specificities can improve biological insights.
Figure 4.

Example sequence logos. The logo on the left is generated from a single PWM and the logos on the right are generated from multiple PWMs using MUSI. (A) MUSI output for SH3 domain (Src). Even though a single logo can visualize certain binding specificity of SH3 domain (Class I), multiple PWMs using MUSI reveal both class I and class II binding specificities. (B) MUSI output for Smad3 transcription factor. MUSI detects two motifs that are already reported in UniPROBE (PWM1 and PWM3) as well as their reverse complements (PWM2 and PWM4).
Transcription factor multiple specificity
MUSI can also detect multiple binding specificity from protein binding microarray data on transcription factors (Figure 4B). For example, Smad3 (Mothers against decapentaplegic homolog3) is a well-known transcription factor, which is one of the modulators in the TGF-β signaling pathway (40). The Smad protein family plays an essential role in the intracellular signaling of transforming growth factor-β (TGF-β), which initiates various cellular responses (41). In particular, Smad3 is known to bind CAGA box [AG(C/A)CAGACA] within the human PAI-1 promoter as its binding sites, which mediates TGF-β-transcriptional induction and other down-stream stimulations (41). Furthermore, its other known binding motif is a GC-rich motif (42,43). MUSI is able to detect the two previously reported motifs.
DISCUSSION
Efficient analysis and visualization of large-scale experimental data is a crucial way of gaining novel insights into biological systems. For large data sets of peptides or nucleotides interacting with proteins, sequence logos enable very useful and intuitive visualization. Multiple logos, such as the ones used in (24) and (16) provide a natural extension to the widely used single logos that can be applied in many instances to better describe the specificity of peptide recognition or DNA-binding domains. With MUSI, we aim to provide a standalone system for rapidly processing this kind of data. The algorithm takes standard sequence files as input and generates multiple PWMs together with the corresponding graphical sequence logos. For the use case of mapping peptide recognition specificity, MUSI supports a full input pre-processing stage for standard 96-well plate data labeled by barcodes. As phage-display technology combined with next-generation sequencing is currently one of the most powerful techniques for identifying peptide-binding motifs, we believe that this tool will be very useful for researchers in the field.
The high efficiency and speed of MUSI derives from new development and optimization of the method initially proposed in (24). In particular, the replacement of the clustering step used to identify multiple specificity with a mixture model based method to determine the optimal number of PWMs allowed us to reduce the complexity of the algorithm from O(N2MK2) to O(NMK2), where N is the number of sequences, M their length and K the number of PWMs. This enables MUSI to rapidly process tens of thousands of sequences.
Compared with existing motif discovery tools, such as YMF (44), and Weeder Web (45), MUSI is optimized for short ligands and, consequently, it can handle much larger data sets. As such, it is not designed to identify over-represented motifs spread out in long sequences, as this is for instance the case when looking for a motif within long upstream regions of co-expressed genes. Questions like this would require more involved and computationally more expensive strategies, such as Gibbs sampling (46), which does not easily scale with the current data set size. This limitation in sequence lengths might prevent straightforward application of MUSI on data generated from ChIP-Seq experiments (47), unless peaks can be defined at a resolution of 40–50 bp or shorter. So, it would be recommended to pre-process the ChIP-Seq data with peak finding algorithms such as QuEST (48) to obtain as short peaks as possible. However, our tests on different benchmarks indicate that MUSI can accommodate sequences that are significantly longer than the motif itself. The observed limit in sequence length (around 40) might also depend on the motif length. Indeed longer motifs convey more information and thus are more likely to be correctly recognized in both the alignment and the mixture model steps. Yet, since most biologically relevant motifs are quite short, it is clear that MUSI is particularly suited for experimental data consisting of relatively short sequences, such as the ones coming from phage display or protein binding microarrays.
To summarize, MUSI addresses a need in high-throughput and high-resolution data analysis capability thus far missing. By mapping all instances of multiple specificity, it is not only useful for predicting better protein interactions, but reveals some of the fundamental mechanisms of encoding specificity in biological interaction networks. Moreover its speed and accuracy ensures that it can be used for new data that will be generated in future projects relying on high-throughput sequencing. Applications may range from synthetic data, such as the one produced with phage display technology, to in vivo data such as extensive sequencing of variable regions found on viral proteins, antibodies or T-cell receptors. We expect MUSI to become increasingly useful as DNA sequencing and microarray technology continues to improve and be applied to identify new protein or DNA binding motifs.
SUPPLEMENTARY DATA
Supplementary Data are available at NAR Online: Supplementary Table 1 and Supplementary Figures 1–6.
FUNDING
EMBO long-term fellowship (ALTF 241-2010 financial support to D.G.), Natural Sciences and Engineering Research Council, (Grant 386671) the Ontario Research Fund and the Canada Foundation for Innovation (CFI-LOF Project 23834 to P.M.K.) and Canadian Institutes of Health Research (grant MOP-84324). Funding for open access charge: NSERC (grant 386671).
Conflict of interest statement. None declared.
Supplementary Material
ACKNOWLEDGEMENTS
The authors would like to thank Shirley Hui for modifying BRAIN library to be used with MUSI and Dr Matt Weirauch for helpful suggestions and discussions.
REFERENCES
- 1.Pawson T, Nash P. Assembly of cell regulatory systems through protein interaction domains. Science. 2003;300:445–452. doi: 10.1126/science.1083653. [DOI] [PubMed] [Google Scholar]
- 2.Mitchell PJ, Tjian R. Transcriptional regulation in mammalian cells by sequence-specific DNA binding proteins. Science. 1989;245:371–378. doi: 10.1126/science.2667136. [DOI] [PubMed] [Google Scholar]
- 3.Hutti JE, Jarrell ET, Chang JD, Abbott DW, Storz P, Toker A, Cantley LC, Turk BE. A rapid method for determining protein kinase phosphorylation specificity. Nat. Methods. 2004;1:27–29. doi: 10.1038/nmeth708. [DOI] [PubMed] [Google Scholar]
- 4.Lam HYK, Kim PM, Mok J, Tonikian R, Sidhu SS, Turk BE, Snyder M, Gerstein MB. MOTIPS: automated motif analysis for predicting targets of modular protein domains. BMC Bioinformatics. 2010;11:243. doi: 10.1186/1471-2105-11-243. [DOI] [PMC free article] [PubMed] [Google Scholar]
- 5.Miller ML, Jensen LJ, Diella F, Jørgensen C, Tinti M, Li L, Hsiung M, Parker SA, Bordeaux J, Sicheritz-Ponten T, et al. Linear motif atlas for phosphorylation-dependent signaling. Sci. Signal. 2008;1:ra2. doi: 10.1126/scisignal.1159433. [DOI] [PMC free article] [PubMed] [Google Scholar]
- 6.Mayer BJ. SH3 domains: complexity in moderation. J. Cell. Sci. 2001;114:1253–1263. doi: 10.1242/jcs.114.7.1253. [DOI] [PubMed] [Google Scholar]
- 7.Doyle DA, Lee A, Lewis J, Kim E, Sheng M, MacKinnon R. Crystal structures of a complexed and peptide-free membrane protein-binding domain: molecular basis of peptide recognition by PDZ. Cell. 1996;85:1067–1076. doi: 10.1016/s0092-8674(00)81307-0. [DOI] [PubMed] [Google Scholar]
- 8.Harris BZ, Lim WA. Mechanism and role of PDZ domains in signaling complex assembly. J. Cell. Sci. 2001;114:3219–3231. doi: 10.1242/jcs.114.18.3219. [DOI] [PubMed] [Google Scholar]
- 9.Garvie CW, Wolberger C. Recognition of specific DNA sequences. Mol. Cell. 2001;8:937–946. doi: 10.1016/s1097-2765(01)00392-6. [DOI] [PubMed] [Google Scholar]
- 10.Chen JR, Chang BH, Allen JE, Stiffler MA, MacBeath G. Predicting PDZ domain-peptide interactions from primary sequences. Nat. Biotechnol. 2008;26:1041–1045. doi: 10.1038/nbt.1489. [DOI] [PMC free article] [PubMed] [Google Scholar]
- 11.Carlson CD, Warren CL, Hauschild KE, Ozers MS, Qadir N, Bhimsaria D, Lee Y, Cerrina F, Ansari AZ. Specificity landscapes of DNA binding molecules elucidate biological function. Proc. Natl Acad. Sci. USA. 2010;107:4544–4549. doi: 10.1073/pnas.0914023107. [DOI] [PMC free article] [PubMed] [Google Scholar]
- 12.Stiffler MA, Chen JR, Grantcharova VP, Lei Y, Fuchs D, Allen JE, Zaslavskaia LA, MacBeath G. PDZ domain binding selectivity is optimized across the mouse proteome. Science. 2007;317:364–369. doi: 10.1126/science.1144592. [DOI] [PMC free article] [PubMed] [Google Scholar]
- 13.Tonikian R, Xin X, Toret CP, Gfeller D, Landgraf C, Panni S, Paoluzi S, Castagnoli L, Currell B, Seshagiri S, et al. Bayesian modeling of the yeast SH3 domain interactome predicts spatiotemporal dynamics of endocytosis proteins. PLoS Biol. 2009;7:e1000218. doi: 10.1371/journal.pbio.1000218. [DOI] [PMC free article] [PubMed] [Google Scholar]
- 14.Zhang Y, Appleton BA, Wiesmann C, Lau T, Costa M, Hannoush RN, Sidhu SS. Inhibition of Wnt signaling by Dishevelled PDZ peptides. Nat. Chem. Biol. 2009;5:217–219. doi: 10.1038/nchembio.152. [DOI] [PubMed] [Google Scholar]
- 15.Mukherjee S, Berger MF, Jona G, Wang XS, Muzzey D, Snyder M, Young RA, Bulyk ML. Rapid analysis of the DNA-binding specificities of transcription factors with DNA microarrays. Nat. Genet. 2004;36:1331–1339. doi: 10.1038/ng1473. [DOI] [PMC free article] [PubMed] [Google Scholar]
- 16.Badis G, Berger MF, Philippakis AA, Talukder S, Gehrke AR, Jaeger SA, Chan ET, Metzler G, Vedenko A, Chen X, et al. Diversity and complexity in DNA recognition by transcription factors. Science. 2009;324:1720–1723. doi: 10.1126/science.1162327. [DOI] [PMC free article] [PubMed] [Google Scholar]
- 17.Wiedemann U, Boisguerin P, Leben R, Leitner D, Krause G, Moelling K, Volkmer-Engert R, Oschkinat H. Quantification of PDZ domain specificity, prediction of ligand affinity and rational design of super-binding peptides. J. Mol. Biol. 2004;343:703–718. doi: 10.1016/j.jmb.2004.08.064. [DOI] [PubMed] [Google Scholar]
- 18.Olsen JV, Vermeulen M, Santamaria A, Kumar C, Miller ML, Jensen LJ, Gnad F, Cox J, Jensen TS, Nigg EA, et al. Quantitative phosphoproteomics reveals widespread full phosphorylation site occupancy during mitosis. Sci. Signal. 2010;3:ra3. doi: 10.1126/scisignal.2000475. [DOI] [PubMed] [Google Scholar]
- 19.Tonikian R, Zhang Y, Boone C, Sidhu SS. Identifying specificity profiles for peptide recognition modules from phage-displayed peptide libraries. Nat. Protoc. 2007;2:1368–1386. doi: 10.1038/nprot.2007.151. [DOI] [PubMed] [Google Scholar]
- 20.Ben-Gal I, Shani A, Gohr A, Grau J, Arviv S, Shmilovici A, Posch S, Grosse I. Identification of transcription factor binding sites with variable-order Bayesian networks. Bioinformatics. 2005;21:2657–2666. doi: 10.1093/bioinformatics/bti410. [DOI] [PubMed] [Google Scholar]
- 21.Salzberg SL. A method for identifying splice sites and translational start sites in eukaryotic mRNA. Comput. Appl. Biosci. 1997;13:365–376. doi: 10.1093/bioinformatics/13.4.365. [DOI] [PubMed] [Google Scholar]
- 22.Portales-Casamar E, Thongjuea S, Kwon AT, Arenillas D, Zhao X, Valen E, Yusuf D, Lenhard B, Wasserman WW, Sandelin A. JASPAR 2010: the greatly expanded open-access database of transcription factor binding profiles. Nucleic Acids Res. 2010;38:D105–D110. doi: 10.1093/nar/gkp950. [DOI] [PMC free article] [PubMed] [Google Scholar]
- 23.Obenauer JC, Cantley LC, Yaffe MB. Scansite 2.0: proteome-wide prediction of cell signaling interactions using short sequence motifs. Nucleic Acids Res. 2003;31:3635–3641. doi: 10.1093/nar/gkg584. [DOI] [PMC free article] [PubMed] [Google Scholar]
- 24.Gfeller D, Butty F, Wierzbicka M, Verschueren E, Vanhee P, Huang H, Ernst A, Dar N, Stagljar I, Serrano L, et al. The multiple-specificity landscape of modular peptide recognition domains. Mol. Syst. Biol. 2011;7:1–12. doi: 10.1038/msb.2011.18. [DOI] [PMC free article] [PubMed] [Google Scholar]
- 25.Noguchi H, Kato R, Hanai T, Matsubara Y, Honda H, Brusic V, Kobayashi T. Hidden Markov model-based prediction of antigenic peptides that interact with MHC class II molecules. J. Biosci. Bioeng. 2002;94:264–270. doi: 10.1263/jbb.94.264. [DOI] [PubMed] [Google Scholar]
- 26.Bailey TL, Elkan C. The value of prior knowledge in discovering motifs with MEME. Proc. Int. Conf. Intell. Syst. Mol. Biol. 1995;3:21–29. [PubMed] [Google Scholar]
- 27.Ernst A, Gfeller D, Kan Z, Seshagiri S, Kim PM, Bader GD, Sidhu SS. Coevolution of PDZ domain-ligand interactions analyzed by high-throughput phage display and deep sequencing. Mol. Biosyst. 2010;6:1782–1790. doi: 10.1039/c0mb00061b. [DOI] [PubMed] [Google Scholar]
- 28.Fowler DM, Araya CL, Fleishman SJ, Kellogg EH, Stephany JJ, Baker D, Fields S. High-resolution mapping of protein sequence-function relationships. Nat. Methods. 2010;7:741–746. doi: 10.1038/nmeth.1492. [DOI] [PMC free article] [PubMed] [Google Scholar]
- 29.Katoh K, Toh H. Parallelization of the MAFFT multiple sequence alignment program. Bioinformatics. 2010;26:1899–1900. doi: 10.1093/bioinformatics/btq224. [DOI] [PMC free article] [PubMed] [Google Scholar]
- 30.Schwarz G. Estimating the Dimension of a Model. Annals of Statistics. 1978;6:461–464. [Google Scholar]
- 31.Holland RCG, Down TA, Pocock M, Prlić A, Huen D, James K, Foisy S, Dräger A, Yates A, Heuer M, et al. BioJava: an open-source framework for bioinformatics. Bioinformatics. 2008;24:2096–2097. doi: 10.1093/bioinformatics/btn397. [DOI] [PMC free article] [PubMed] [Google Scholar]
- 32.Schneider TD, Stephens RM. Sequence logos: a new way to display consensus sequences. Nucleic Acids Res. 1990;18:6097–6100. doi: 10.1093/nar/18.20.6097. [DOI] [PMC free article] [PubMed] [Google Scholar]
- 33.Cock PJA, Fields CJ, Goto N, Heuer ML, Rice PM. The Sanger FASTQ file format for sequences with quality scores, and the Solexa/Illumina FASTQ variants. Nucleic Acids Res. 2010;38:1767–1771. doi: 10.1093/nar/gkp1137. [DOI] [PMC free article] [PubMed] [Google Scholar]
- 34.Wei G-H, Badis G, Berger MF, Kivioja T, Palin K, Enge M, Bonke M, Jolma A, Varjosalo M, Gehrke AR, et al. Genome-wide analysis of ETS-family DNA-binding in vitro and in vivo. EMBO J. 2010;29:2147–2160. doi: 10.1038/emboj.2010.106. [DOI] [PMC free article] [PubMed] [Google Scholar]
- 35.Berger MF, Badis G, Gehrke AR, Talukder S, Philippakis AA, Pena-Castillo L, Alleyne TM, Mnaimneh S, Botvinnik OB, Chan ET, et al. Variation in homeodomain DNA binding revealed by high-resolution analysis of sequence preferences. Cell. 2008;133:1266–1276. doi: 10.1016/j.cell.2008.05.024. [DOI] [PMC free article] [PubMed] [Google Scholar]
- 36.Newburger DE, Bulyk ML. UniPROBE: an online database of protein binding microarray data on protein-DNA interactions. Nucleic Acids Res. 2009;37:D77–D82. doi: 10.1093/nar/gkn660. [DOI] [PMC free article] [PubMed] [Google Scholar]
- 37.Zhao Y, Granas D, Stormo GD. Inferring binding energies from selected binding sites. PLoS Comput. Biol. 2009;5:e1000590. doi: 10.1371/journal.pcbi.1000590. [DOI] [PMC free article] [PubMed] [Google Scholar]
- 38.Elkan T. Proceedings of the Second International Conference on Intelligent Systems for Molecular Biology. 1994. Fitting a mixture model by expectation maximization to discover motifs in biopolymers. AAAI Press, pp. 28–36. [PubMed] [Google Scholar]
- 39.Brown MT, Andrade J, Radhakrishna H, Donaldson JG, Cooper JA, Randazzo PA. ASAP1, a phospholipid-dependent arf GTPase-activating protein that associates with and is phosphorylated by Src. Mol. Cell. Biol. 1998;18:7038–7051. doi: 10.1128/mcb.18.12.7038. [DOI] [PMC free article] [PubMed] [Google Scholar]
- 40.Hua X, Miller ZA, Wu G, Shi Y, Lodish HF. Specificity in transforming growth factor beta-induced transcription of the plasminogen activator inhibitor-1 gene: interactions of promoter DNA, transcription factor muE3, and Smad proteins. Proc. Natl Acad. Sci. USA. 1999;96:13130–13135. doi: 10.1073/pnas.96.23.13130. [DOI] [PMC free article] [PubMed] [Google Scholar]
- 41.Dennler S, Itoh S, Vivien D, ten Dijke P, Huet S, Gauthier JM. Direct binding of Smad3 and Smad4 to critical TGF beta-inducible elements in the promoter of human plasminogen activator inhibitor-type 1 gene. EMBO J. 1998;17:3091–3100. doi: 10.1093/emboj/17.11.3091. [DOI] [PMC free article] [PubMed] [Google Scholar]
- 42.Frederick JP, Liberati NT, Waddell DS, Shi Y, Wang X-F. Transforming growth factor beta-mediated transcriptional repression of c-myc is dependent on direct binding of Smad3 to a novel repressive Smad binding element. Mol. Cell. Biol. 2004;24:2546–2559. doi: 10.1128/MCB.24.6.2546-2559.2004. [DOI] [PMC free article] [PubMed] [Google Scholar]
- 43.Feng X-H, Derynck R. Specificity and versatility in tgf-beta signaling through Smads. Annu. Rev. Cell Dev. Biol. 2005;21:659–693. doi: 10.1146/annurev.cellbio.21.022404.142018. [DOI] [PubMed] [Google Scholar]
- 44.Sinha S, Tompa M. YMF: a program for discovery of novel transcription factor binding sites by statistical overrepresentation. Nucleic Acids Res. 2003;31:3586–3588. doi: 10.1093/nar/gkg618. [DOI] [PMC free article] [PubMed] [Google Scholar]
- 45.Pavesi G, Mereghetti P, Mauri G, Pesole G. Weeder Web: discovery of transcription factor binding sites in a set of sequences from co-regulated genes. Nucleic Acids Res. 2004;32:W199–W203. doi: 10.1093/nar/gkh465. [DOI] [PMC free article] [PubMed] [Google Scholar]
- 46.Thijs G, Marchal K, Lescot M, Rombauts S, De Moor B, Rouzé P, Moreau Y. A Gibbs sampling method to detect overrepresented motifs in the upstream regions of coexpressed genes. J. Comput. Biol. 2002;9:447–464. doi: 10.1089/10665270252935566. [DOI] [PubMed] [Google Scholar]
- 47.Farnham PJ. Insights from genomic profiling of transcription factors. Nat. Rev. Genet. 2009;10:605–616. doi: 10.1038/nrg2636. [DOI] [PMC free article] [PubMed] [Google Scholar]
- 48.Valouev A, Johnson DS, Sundquist A, Medina C, Anton E, Batzoglou S, Myers RM, Sidow A. Genome-wide analysis of transcription factor binding sites based on ChIP-Seq data. Nat. Methods. 2008;5:829–834. doi: 10.1038/nmeth.1246. [DOI] [PMC free article] [PubMed] [Google Scholar]
Associated Data
This section collects any data citations, data availability statements, or supplementary materials included in this article.