Abstract
Microarrays were done on the livers of mice fed DDC for 10 weeks, withdrawn 1 month (DDC primed livers) and refed 6 days,and compared with mice fed the control diet. The expression of a large number of genes changed when DDC was fed or refed. A Venn diagram analysis identified 649 genes where gene expression was changed in the same direction. The epigenetic memory of the DDC primed liver involved an increase in the expression of ubiquitin D, alpha fetoprotein, connective tissue growth factor, integrin beta 2, DNA methyl transferase 3a and DNA damage –inducible 45 gamma. DNA methyl transferase 3b was down regulated as was Cbp/p300. When DDC was refed, DNA methyltransferase and histone deacetylase were up regulated as shown by microarray analysis. Histone3 lysine9 acetylation was increased by DDC and DDC refeeding and DNA methyltransferases were not changed as shown by Western blot analysis. The data suggests the concept that the epigenetic memory that explains why DDC primed hepatocytes form MBs in 7 days of DDC refeeding is primarily the result of epigenetic modifications of gene expression through changes in histone acetylation and methylation, as well as DNA methylation.
Keywords: epigenetics, Mallory bodies, phenotypic change, genetic memory
Introduction
Mice fed diethyl-1,4-dihydro-2,4,6-trimethyl-3,5-pyridine decarboxylate (DDC) added to a normal mouse diet for 10 weeks form Mallory bodies (MBs) in clusters of hepatocytes. The MBs mostly disappear by one month of DDC withdrawal (DDC primed hepatocytes). Following 7 days of DDC refeeding MBs are again formed by groups of hepatocytes (Yuan et al., 1996). The gene expression associated with the induction of MBs in this model of MB formation includes the up regulation of integrins, laminin, I-Cam 1, Src, MEKK1, ERK and p38 (Wu et al., 2005; Nan et al., 2006a). When hepatocytes from DDC withdrawn mice, where MBs had disappeared, were cultured in vitro, MBs reformed in vitro spontaneously in 6 days. The gene expression of ERK, NFkB105, Src, MEKK1, JNK1/2 and p38 was up regulated during MB formation in vitro (Nan et al., 2005; Nan et al., 2006b). These results suggested that the DDC primed hepatocytes had a genetic “memory” which predisposed them to form MBs both in vitro and in vivo. It is possible that the mechanism which could account for this memory is epigenetic.
Epigenetic memory involves heritable changes in gene expression that do not involve changes in DNA sequences (Lu et al., 2006). However, histone methylation may be reversible, dynamic (di or mono) or at least more stable (trimethyl histone). The molecular basis of these changes typically involves DNA methylation and histone modifications such as methylation and acetylation. Both mechanisms act in concert to provide stability of gene expression as the result of gene silencing or up regulation.
To test this hypothesis mice were fed DDC for 10 weeks, withdrawn for 4 months, then refed DDC for 7 days. Controls were fed the diet without DDC. These 4 groups of mice were sacrificed and their livers were quick frozen in isopentane in liquid nitrogen. Microarray analysis was done on one mouse liver per group to determine the global changes in gene expression. A large number of changes in gene expression occurred when DDC was fed, and after refeeding. Liver homogenates and nuclear extracts were used for Western blot to determine changes in DNA and histone methylation and acetylation. Histone acetyltransferase, and DNA methyltransferase were also measured. The results were correlated with microarray data. Quantitative RT-PCR was done to validate the microarray results on two selective genes.
MATERIALS and METHODS
Animals
One month old C3H male mice (Harlan Sprague-Dawley, San Diego, CA) were divided into 4 groups. Group 1: 3 control mice fed a protein rich semisynthetic, complete standard control diet (Teklad, Madison, WI). Group 2: 3 mice were fed the control diet with 0.1% 1,4-dihydro-2, 4, 6,-trimethyl-3,5-pyridinedicarboxylate (DDC, Aldrich, St Louis, MO) for 10 weeks to induce MB formation in vivo. Group 3; 3 mice were fed DDC for 10 weeks then withdrawn from DDC for 5 weeks at which time the MBs had mostly disappeared. Group 4: 3 mice were fed DDC for 10 weeks, withdrawn 4 weeks, then refed the DDC diet plus chlormethiazole (80 mg/kg) for 7 days to enhance MB formation by inhibiting CYP2E1 (Bargag-Gorce et al, 2002). The mice used here were the same mice that have been used in previous studies (Wu et al. 2005). All mice were treated in a humane manner as approved by the Animal Care Committee at Harbor-UCLA LABiomed Research Institute according to the Guidelines of the National Academy of Science.
Microarray analysis
Liver tissue from one mouse of each of the 4 treatment groups was subjected to microarray analysis. Total liver RNAs are extracted with Ultraspec™ RNA Isolation Systemic (Biotecx Laboratories, Houston, TX) and are cleaned up with Rneasy columns (Qiagen, Valencia, CA). Five micrograms of total RNA were used for preparing biotin-labeled cRNA. Labeled and fragmented cRNA is subsequently hybridized to Mouse Genome 430 2.0 Array (Affymetrix, Santa Clara, CA). Labeling, hybridization, image scanning and initial data analysis are performed by the Microarray Core at Los Angeles Biomedical Research Institute.
Sample Preparation and loading
Equal amounts of RNA (5 mg) from each sample were used for Affymetrix GeneChip analysis. RNA was converted to cDNA using GeneChip® One-Cycle cDNA Synthesis Kit (Affymetrix) and then to biotinylated cRNA using GeneChip® IVT Labeling Kit (Affymetrix). The quality of labeled RNA was confirmed with the Affymetrix Test 3 Array. The biotinylated cRNA from all samples was hybridized to Affymetrix Mouse 430 2.0 GeneChip arrays.
Hybridization and staining
Hybridization cocktail was prepared, which includes controls at the fragmented cRNA. The samples were hybridized in the array at 45°C for 17 h using GeneChip Hybridization Oven 640. Immediately following hybridization, the array underwent an automated washing and staining protocol (R-Phycoerythin Streptavidin conjugated, Molecular Probes) on the GeneChip Fluidics Station 400. The arrays were then scanned with a GeneChip Scanner 3000 (Affymetrix).
Microarray Data Analysis
Data preparation, analysis, and integration were performed using Affymetrix's GeneChip Operating Software (GCOS). The software was used for perform image processing, evaluation of data quality, normalization, transformation, and filtering, so that data was ready for further analysis. Wilcoxon's signed rank test was used in comparison analysis to derive biologically significant results from the raw probe cell intensities on expression arrays. For comparison analysis, each probe set on the experiment array was compared with its counterpart on the control array to calculate the change in P value that was used to generate the difference call of increase (I; P<0.04), marginal increase (MI; P<0.04 to P<0.06), decrease (D; P>0.997), marginal decrease (MD; P>0.992 to P>0.997), or no change (NC: P>0.06 to P<0.997). Comparison analysis was used to generate a signal log ratio for each probe prior to the experimental array to the corresponding probe pair on the control array. This strategy cancels out differences resulting from different probe finding coefficients. Signal log ratio was computed by using a one-step Tukey's biweight method by taking a mean of the log ratio of probe pair intensities across the two arrays.
Once the absolute and comparison data files were created in GCOS, genes were identified with signal intensity differences using BULLFROG v12.3 TG (Lockhart and Lockhart) and GeneSpring (Silicon Genetics). In the BULLFROG analysis, the filtering criteria used to find genes unique to DDC 7 days was the following: a change call of increase/marginal increase or decrease/marginal decrease, fold change > 1.7, and a present call in at least one of the arrays. In GeneSpring the probes were first normalized using “Per Gene: Normalize to median”. Next, transcripts were determined to be differentially expressed based on the following criteria: a Change Call of Increase, Marginal Increase, Decrease, or Marginal Decrease with a Change P-value <0.006 or >0.994, a Signal Log Ratio <−0.8 or > 0.8, a Present Call for the probe set in either or both experimental conditions, and a minimum signal intensity of 50 of a probe in either or both of the experimental files.
After generating a list of differentially expressed genes, down stream analysis was performed. The filtered transcripts were clustered in GeneSpring using SOM, K-means and GeneTree to find similar patterns of gene expression. The lists of transcripts were also uploaded into GenMapp (Gene MicroArray Pathway Profiler, Gladstone Institutes University of California at San Francisco). GenMapp clusters the transcripts based on biological function.
The data illustrated was obtained by using the KEGG web site (http://www.genome.jp/kegg/pathway.html) and blasting the list of total changed genes issued from our experiment for analysis. The web site calculates the number of up regulated and down regulated genes for each pathway shown in the KEGG graph. To determine the percent gene change in each pathway, the number of changed genes present in each pathway was divided by the total number of genes in the same pathway.
The same calculation was performed in the ABI panther (http://www.pantherdb.org/genes/) web site to illustrate the pie chart. To determine the percent gene change in each pathway, the number of genes present in each pathway was divided by the total number of changed genes.
Subcellular fractionation
Rat liver homogenates were prepared by homogenizing 100mg of frozen liver tissues in 2 mL of 20mM Tris-HCl pH 7.5; glycerol 10%; EGTA 1mM; DTT 1mM; NaFluoride 50 mM; proteases and phosphatases inhibitor cocktail (Sigma). The tissues were homogenized using the Ultra-Turrax T25 homogenizer. The Nuclear extracts were prepared using the NE-PER Nuclear Extraction Reagents (Pierce Biotechnology, Rockford, IL). Protein concentrations were evaluated using the Bradford method (1976).
Western Blot Analysis
Proteins (50 μg) from liquid nitrogen frozen stored livers were separated by SDS-PAGE gels and transferred to a PVDF membrane (Bio-Rad, Hercules, CA) for 1 h in 25 mM Tris-HCl (pH 8.3), 192 mM glycine and 20% methanol. The membranes were stained using the primary antibodies listed in Table 1. Appropriate species anti polyclonal and monoclonal HRP-conjugated antibodies were used as the secondary antibodies. The membranes were subjected to chemiluminescence detection using luminal, according to the manufacturer's instructions (Amersham Pharmacia Biotech, Piscataway, NJ).
TABLE 1.
Primary Antibodies Used for Western blot
| Antigen | Company and Location | Host | Dilution |
|---|---|---|---|
| HDAC | BIOMOL, Plymouth Meeting, PA | Mouse | 1:1000 |
| HIF alpha | Santa Cruz Biotech, Santa Cruz, CA | Rabbit | 1:1000 |
| AcH3K9 | Cell Signaling Technology, Danvers, MA | Rabbit | 1:1000 |
| Histone 3 | Cell Signaling Technology, Danvers, MA | Rabbit | 1:1000 |
| Dnmt3a | Abcam Inc. Cambridge, MA | Mouse | 1 :1000 |
| Dnmt3b | Abcam Inc. Cambridge, MA | Rabbit | 1 :1000 |
| Dimethyl H3K9 | Abcam Inc. Cambridge, MA | Rabbit | 1 :500 |
| 5Methyl Cytosine | Diagenode, Liège (Sart Tilman) Belgium | Mouse | 1 :200 |
| Gadd45g | Proteintech Group, Inc Chicago, IL | Mouse | 1:1000 |
Quantitative real-time RT-PCR assay
Total liver RNAs were extracted with Trizol Plus RNA Purification Kit (Invitrogen, Carlsbad, CA). Synthesis of cDNAs was performed with 5 μg total RNA, 50ng random hexamer primers using SuperSriptIII RNase H− Reverse Transcriptase (Invitrogen, Carlsbad, CA). PCR primers were designed with the assistance of the Primer Express software (Applied Biosystems, Foster City, CA) [[the primers for mouse liver Gadd45g were: Sens: 5' TGAATGTGGACCCTGACAATGT 3' and the anti-sens: AATGGATCTGCAGCGCTATGT. The primers for CTGF were: Sens: CTGCCTACCGACTGGAAGACA3' and the anti-sens is 5' GATGCCCATTCCACAGGTCTTA3'. Quantitative PCR was achieved us ing the SYBR Green JumpStart™ Tag ReadyMix (Sigma, St. Louis, MO) on an ABI PRISM 7700 Sequence Detector System (Applied Biosystems, Foster City, CA). The thermal cycling consists of an initial step at 50°C for 2 min, followed by a denaturation step at 95°C for 10 min, then 40 cycles at 95°C for 15 s and 60°C for 1 min. Single PCR product was confirmed with the heat dissociation protocol at the end of the PCR cycles. Quantitative values were obtained from the threshold PCR cycle number (Ct) at which point the increase in signal associated with an exponential growth for PCR product starts to be detected. The target mRNA abundance in each sample was normalized to its 18S level as ?Ct = Cttarget gene − Ct18S. For each target gene, the highest ?Ct was assigned as ?Ctmax. The relative mRNA levels were calculated as 2??Ct , ??Ct = ?Ctmax − ?Ct.
Statistics
Statistical analysis was performed using ANOVA t test and Bonferoni for multiple group comparison (Sigma Stat software). Significance was defined as P < 0.05.
RESULTS
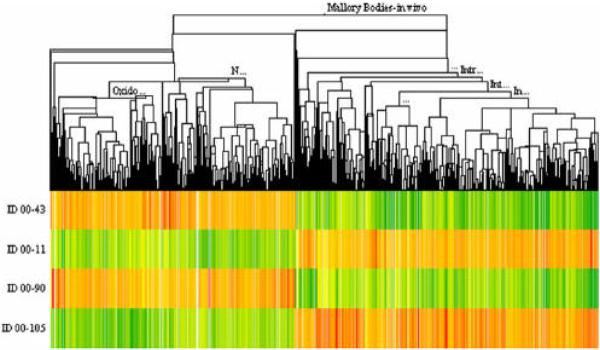
The heat map from 1 mouse liver per treatment group (group1 = 43; group 2 = 11; group 3 = 90; group 4 = 105) is shown in figure 1. The gene expression changed in a large number of genes when DDC was fed for 10 weeks and again when DDC was refed after a 4 week interval where DDC was withheld from the diet. Gene expression returned to control levels after one month withdrawal of the drug DDC. DDC refed for 7 days after withdrawal caused a return of gene expression seen after the initial 10 weeks of DDC feeding. When mouse 90 (DDC primed mouse) was compared to mouse 43 (control mouse), the expression of 2300 genes was changed using a + or – 1.6 cut off. When mouse 11 (DDC fed 10 weeks) was compared with mouse 43, the expression of over 5300 genes was changed. When mouse 105 (DDC refed) was compared with mouse 90, the expression of over 4600 genes was changed. To further analyze the data, the number of genes analyzed was reduced by changing the cut off fold change.
Fig. 1.
Heat map of 3147 genes clustered from the comparison between 00–43 (Control), 00–11 (DDC fed mouse), 00–90 (DDC fed and withdrawn mouse), and 00–105 (DDC fed mouse, withdrawn and refed DDC mouse). Mouse MB Model In vivo (n=1).
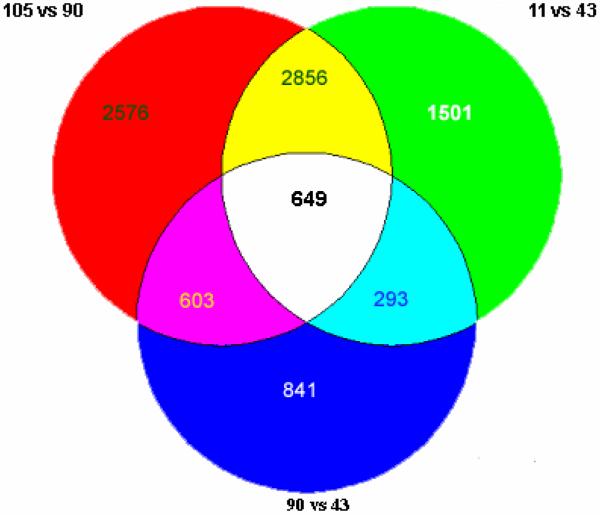
When the changes were analyzed by Venn to determine the shared gene expressions when the three mice treated with DDC were compared with the control or the mouse withdrawn from DDC for 5 weeks, 649 out of 9319 changes in gene expression were identified (Fig 2). The 649 changed genes identified, constituted the gene expression memory present in the DDC withdrawn mice livers.
Fig. 2.
Venn diagram of gene expression, when the control was compared with the DDC treated mice or the mouse fed DDC 10 wk and then DDC withdrawn for 5 weeks. The change in gene expression in the same direction shared by the DDC treated mice numbers 625 with 25 odd. 90 vs. 43= 2300 genes changed. 11 vs. 43= 5300 genes changed. 105 vs. 90= 6600 genes changed. 649 genes were changed in common among the three different comparisons, which includes 9319 genes in total (n=1).
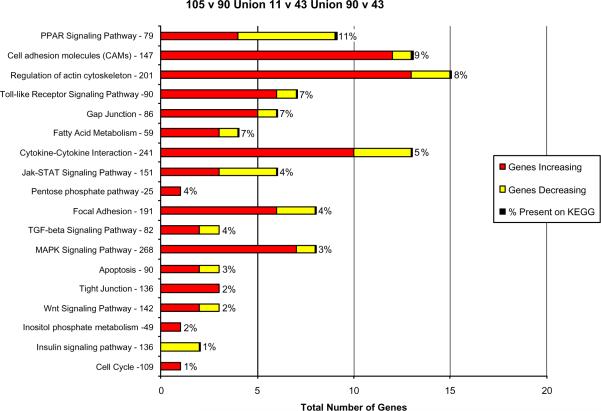
These changes in gene expression may explain how hepatocytes are able to spontaneously form MBs 7 days after refeeding DDC compared to the mice that were initially fed DDC for 10 weeks. The 649 genes common to all three comparisons in the Venn diagram (Fig 2) were grouped according to functional pathways (Fig 3).
Fig. 3.
Functional pathways where the expression of 3343 genes changed when DDC treated mice were compared with the control or the DDC withdrawn mouse (n=1)..
The genes most changed were those involved in the regulation of the actin cytoskeleton. MAPK signaling and focal adhesion function genes were the next most commonly affected. In all cases, more genes where up regulated than down regulated. The % total of gene expression changes is illustrated in Fig 4.
Fig. 4.
The % of the gene expression changes by functional pathways is shown when the DDC treated mice were compared to the control or the DDC withdrawn mice (625 genes) (n=1).
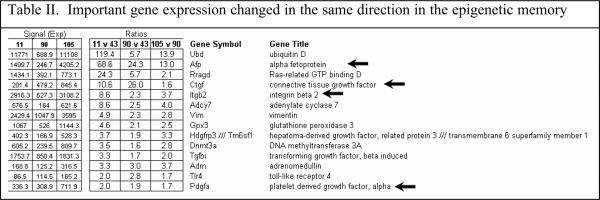
When all the changes in gene expression were analyzed, a few changes stood out as potentially being involved in the memory of MB formation because the changes are in the same direction. For instance the gene for ubiquitin D was up regulated (Table II).
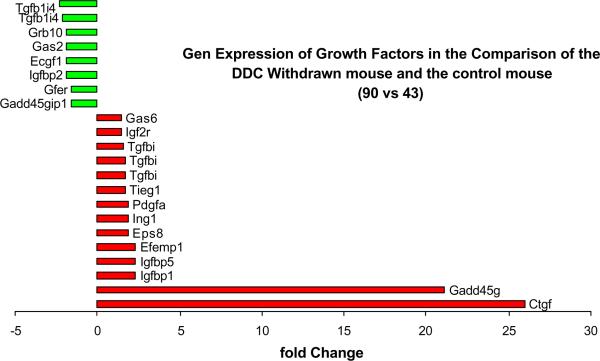
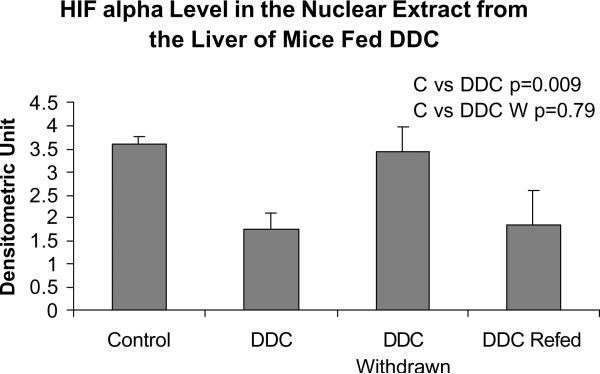
Ubiquitin D is involved in protein degradation by the 26S proteasome. Alpha fetoprotein (AFP) was up regulated, especially in the DDC withdrawn mouse (the mouse which has the memory of how to form MBs when DDC was refed). Connective tissue growth factor (CTGF), and growth arrest and DNA-damage—inducible 45 gamma (Gadd45g) were especially up regulated in the memory mouse (Fig 5). Integrin beta 2 (Itgb2) was up regulated (Table II). Integrin is involved in MB formation in vitro (Wu et al, 2005). Glutathione S-transferase (GSTm4) expression was up regulated when DDC was fed but was down regulated by DDC withdrawal. GST isoforms are involved in drug detoxification and are induced by DDC feeding (Roomi et al, 2006). Platelet derived growth factor, alpha (Pdgfα) was marginally up regulated (Table II). Adrenomedulin (Adm) was up regulated (Table II). Adm is up regulated by HIF1α (Li et al, 2004). However, HIF1α was down regulated in the nuclear extract when DDC was fed or refed (Fig 6).
Fig. 5.
Gene expression of growth factors changed when in DDC withdrawn mice (Memory cells that form MB's) compared to the control mouse liver. Note the increased expression of Gadd45g and Ctgf (n=1).
Fig. 6.
HIF1 alpha expression in nuclear extracts from the livers of mice fed DDC (Mean +/− SEM, n=3).
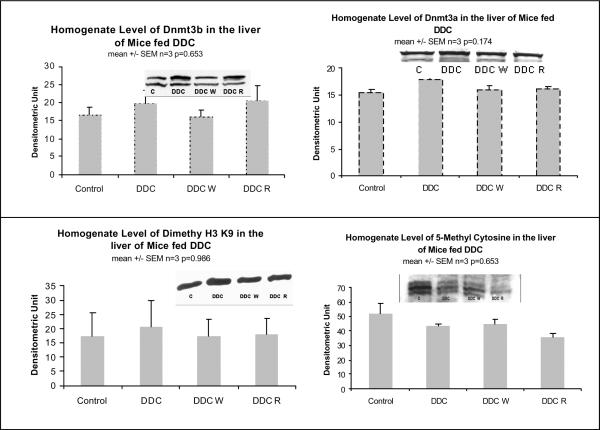
When the epigenetic memory of the mouse withdrawn from DDC for a month was compared with the control mouse, Dnmt3b was markedly down regulated suggesting that gene methylation was reduced (Table III). The levels of methyl cytosine and dimethylated histone 3 lysine 9 were not changed by the DDC treatment (Fig 9).
Table III.
DDC Withdrawal Vs Control (90 vs. 43)
| Gene Title | Gere Symbol | Ratio |
|---|---|---|
| DNA Methylation | ||
|
| ||
| DNA mathyltransferase 3A | Dnmt3a | 1.6 |
| DNA mathyltransferase 3B | Dnmt3b | −7.5← |
|
| ||
| Histones | ||
|
| ||
| histone 1, H2bc | Hist1h2bc | −1.5 |
| histone 1, H2b (c, e, l, m, p) | Hist1h2b (c, e, l, m, p) | −1.5 |
| histone 2, H3c2 | Hist2h3c2 | −1.9 |
| histone 1, H1c | Hist1h1c | −2.5 |
|
| ||
| CBP/p300 | ||
|
| ||
| transcription factor activity | Cbp/p300 | −1.7 |
|
| ||
| Foxo | ||
|
| ||
| forkhead box 01 | Foxo1 | 2.3 |
| forkhead box 03a | Foxo3a | 1.6 |
Fig. 9.
The protein levels of Dnmt3b and dimethyl histone 3 lysine 9 were unchanged in the liver homogenates by DDC feeding and refeeding (Mean +/− SEM, n=3).
The reduction in methylation by Dnmt3b (Table III) could be a mechanism for the up regulation of gene expression observed. The expression of the acetyl transferase p300 was decreased by DDC withdrawal (see Table III). When the DDC refed mouse was compared with the DDC withdrawn mouse, down regulation of the deacetylases Sirt1 and 3 was observed (Table IV).
Table IV.
Gene expression changes when DDC was refed
| Fold Change | Gene Symbol | Gene Title |
|---|---|---|
| DNA Methyltransferase | ||
|
| ||
| →6.5 | Dnmt1 | DNA methyltransferase (cytosine-5) 1 |
| 2.8 | Dnmt3a | DNA methyltransferase 3A |
|
| ||
| Histone Deacetylase (HDAC) | ||
|
| ||
| 4.6 | Uap1|1 | UDP-M-acteylglucosamine pyrophosphorylase 1-like 1 |
| 4.6 | Hist1h2ad | histone 1, H2ad |
|
| ||
| CBP/p300 | ||
|
| ||
| −2.3 | Pcaf | p300/CBP-associated factor |
|
| ||
| SIRT | ||
|
| ||
| −1.9 | Sirt1 | sirtuin 1 (homolog) 1 (S. cerevisiae) |
| →−2.3 | Sirt3 | sirtuin 3 (homolog) 3 (S. cerevisiae) |
|
| ||
| Foxo | ||
|
| ||
| −1.9 | Foxo1 | forkhead box O1 |
| −1.9 | Foxa1 | forkhead box A1 |
| −4.9 | Foxq1 | Forkhead box Q1 |
| −6.5 | Foxp2 | forkhead box P2 |
| 3.7 | Foxm1 ///Pbp///4933413 | forkhead box M1 / |
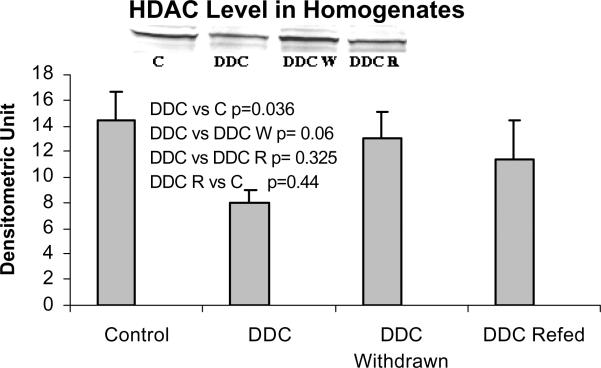
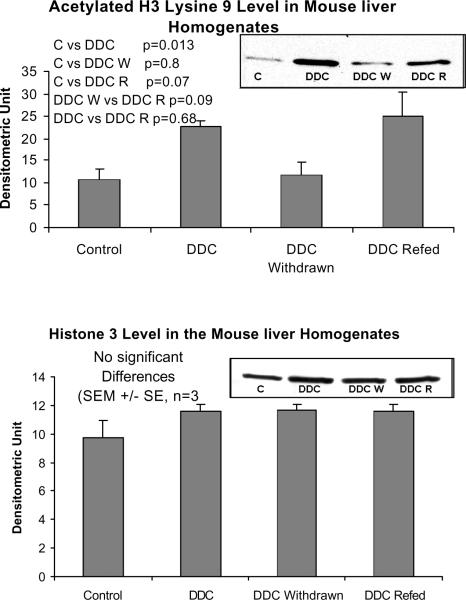
When measured by Western blot, HDAC levels were also reduced by DDC feeding but not in the DDC refed mice (Fig 7), which does not support the significance of HDAC action in MB induction. Deacetylation of histones, therefore, may have been reduced during DDC feeding which could further enhance epigenetic up regulation of gene expression without involvement of signal transduction. To support this possibility, acetylation of H3 lysine 9 was measured by Western blot. Acetylation of histone 3 lysine 9 was increased when DDC was fed (Fig. 8). When the HDAC level is reduced, the level of H3K9 acetylation would logically increase. However when DDC was refed, the level of HDAC did not change, as shown by Western blot, suggesting mechanisms other than HDAC activity are regulating the level of H3K9 acetylation.
Fig. 7.
The protein level of histone deacetylase (HDAC) is decreased in the liver homogenates of DDC fed mice (Mean +/− SEM, n=3).
Fig. 8.
The protein levels of acetylated histone 3 lysine 9 are increased in the liver homogenates of DDC fed and refed mice (Mean +/− SEM, n=3).
There were no significant changes in the level of Dnmt3b or dimethyl H3 lysine 9 (H3K9) measured by western blot (Fig. 9). This data has to be confirmed by measuring the nuclear fraction as well.
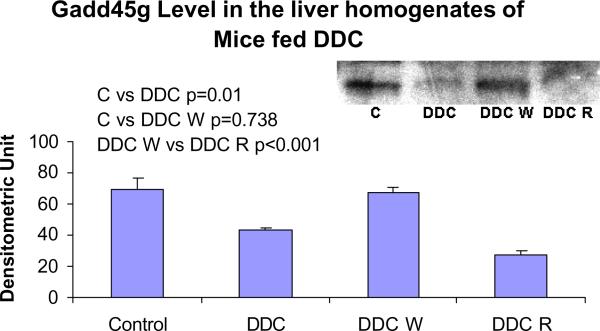
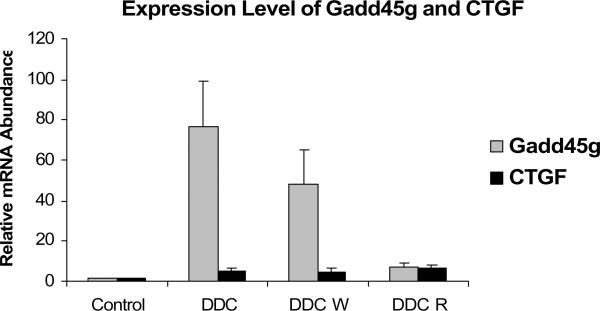
The protein levels of Gadd45g were decreased by DDC feeding and refeeding, supporting a negative role for this important protein in the formation of MBs (Fig. 10). The protein levels of DDC W vs. control did not correlated with the gene expression levels (Fig. 5). The increase in Gadd45g and CTGF expression seen by microarray analysis was confirmed using RT PCR ( Fig. 11).
Fig. 10.
The protein levels of Gadd45g in the liver homogenates were decreased by DDC feeding and DDC refeeding (Mean +/− SEM, n=3).
Fig. 11.
MB formation in vivo was associated with an increased expression of Gadd45g (SEM +/−, n=3; C vs DDC p=0.004; C vs DDC W p= 0.016). MB formation was also associated with an increased expression of CTGF (C vs DDC W p=0.03; C vs DDC R p= 0.014). The level of Gadd45g and CTGF expression in DDC W was significantly increased suggesting that the expression of these two genes may be involved in the epigenetic memory of DDC primed hepatocytes.
DISCUSSION
The most likely explanation as to how DDC induces MB formation is that DDC induces an epigenetic phenomenon by reducing DNA methylation and increasing histone acetylation. However the role of epigenetic memory must be regarded as speculative until direct molecular evidence is available. Other non epigenetic mechanisms were not investigated. As shown in the heat map of gene expression changes after feeding and refeeding DDC, there was a profound change in gene expression (i.e. 9319 genes). There was a reversible switch in gene expression when the drug was fed and withdrawn. The memory of the changes in gene expression induced by DDC feeding was partially retained (i.e. 625 genes) which shortened the time interval necessary for MB formation (10 wks vs. 6 days). Epigenetic is defined as “heritable and reversible changes in gene expression which do not involve coding sequence modifications” (Lu et al, 2006). However, histone methylation may be reversible, dynamic, irreversible, or at least more stable (trimethyl histone). The epigenetic memory hypothesis here is speculative until direct molecular evidence is available.
Of particular interest is the memory of gene expression which shortens the time interval for MB formation when the drug was refed. This phenomenon helps narrow down the critical memory of gene expression changes involved in MB formation. Since the acetyltransferase p300 was not changed by DDC feeding, and DNA methyl transferase (Dnmt3b) was down regulated, it is likely that the gene silencing by DNA methylation was reversed and this may explain the epigenetic memory of DDC withdrawn hepatocytes which show an accelerated formation of MBs when DDC is refed.
Confounding the problem, however, is the fact that, the phenotypically changed hepatocytes in the drug withdrawn mouse coexist with hepatocytes which are not phenotypically changed (Wu et al, 2005; Roomi et al., 2006; Nan et al, 2006a–b; Tazawa et al, 1983; Nagao et al, 1999). Two phenotypic markers overexpressed in the MB forming preneoplastic phenotype, alpha fetoprotein and glutathione S-transferase (Roomi et al, 2006; Nan et al, 2006b) were up regulated in the DDC treated hepatocytes. However, only alpha fetoprotein was up regulated in the DDC withdrawn memory hepatocytes which had stopped MB formation. The mouse fed DDC for 10 wks had a 69 fold increase in AFP gene expression, the DDC withdrawn mouse had a 24 fold increase and the refed mouse had a 13 fold increase in AFP. Liver tumors that form 9 months after DDC withdrawal show a 5 fold increase in AFP expression (Nan et al, 2006b) indicating that the memory of AFP up regulation persisted for 9 months in the preneoplastic phenotype. The increase in AFP expression by DDC in vitro and in vivo has been demonstrated by Western blot, PCR and immunohistochemistry (Nan et al, 2006b). The stimulation of the DDC withdrawn livers to form MBs after 10 wks DDC feeding, followed by 4 wk withdrawal, is not specific to DDC but is also induced by a variety of liver toxins including alcohol and heat shock (French et al, 2001; Riley et al, 2003; Zhang-Gouillon et al, 1998).
Many growth factors were expressed in the livers of the mice fed DDC or withdrawn from DDC (livers with an epigenetic memory induced by DDC). These included connective tissue growth factor, hepatoma-derived growth factor related protein 3, transforming growth factor beta and platelet derived growth factor alpha. The up regulation of these genes may explain the tendency for the memory hepatocytes withdrawn from DDC, to form tumors 9–14 months later (Nan et al, 2006b).
The up regulation of integrin beta 2 observed in the DDC treated and withdrawn hepatocytes (memory cells) may explain why these cells form MBs in primary tissue culture of DDC primed hepatocytes since laminin-integrin signaling triggers MB formation in vitro (Wu et al, 2005).
A most interesting finding, as shown by microarray analysis, is the up regulation of Gadd45g in the DDC primed hepatocytes compared to the control (90 vs. 43). The withdrawn liver cells remember how to form MBs in response to DDC refeeding. Gadd45g is induced by stress shock and inhibits cell growth and induces apoptosis. Heat shock protein can induce Gadd45g up regulation. However, this response is abolished if its promoter is hypermethylated (Ying et al., 2005). Hypermethylation of the Gadd45g promoter region might explain its reduced expression when DDC was fed (Fig10). However the protein level was not changed when DDC W was compared to the control. Gadd45g is antiapoptotic through the p38-NFκB mediated survival pathway (Gupta et al, 2006; Zerbini and Libermann, 2005). Gadd45g has been identified as a target gene for hypermethylation epigenetic gene silencing in tumor cells (Ying et al, 2005).
This may be relevant to the observation that inhibition of either p38 or NFκB activation in vitro completely prevents MB formation by DDC withdrawn mice hepatocytes in primary cultures (Nan et al, 2005; Nan et al, 2006b).
The analogy of MB formation in DDC fed mice to MBs seen in chronic alcoholic liver disease is evident because the mouse fed DDC and the rat fed alcohol, both show an increase in acetylation of histone 3 lysine 9 (Shukla et al., 2006; Bardag-Gorce et al., 2007). The inhibition of p38 in the drug primed mouse hepatocyte primary culture, inhibited MB formation (Nan et al., 2006a). Likewise, in the experimental rat model of alcoholic liver disease, phospho-p38 levels were decreased in nuclear extracts of rat liver fed alcohol (Gorce-Bardag et al, 2007). In the case of the rat model, no MBs were formed. MBs in the liver studied here were documented to be formed in a previous study by Wu et al., (2005).
Acknowledgements
The authors thank Adriana Flores for typing the manuscript. This study was supported by NIH/NIAAA grants 8118 and the Alcohol Center Grant on Liver and Pancreas P50-011999.
Footnotes
Publisher's Disclaimer: This is a PDF file of an unedited manuscript that has been accepted for publication. As a service to our customers we are providing this early version of the manuscript. The manuscript will undergo copyediting, typesetting, and review of the resulting proof before it is published in its final citable form. Please note that during the production process errors may be discovered which could affect the content, and all legal disclaimers that apply to the journal pertain.
REFERENCES
- Bardag-Gorce F, van Leewen FW, Nguyen V, French BA, Li J, Riley NE, McPhaul LW, Lue YH, French SW. The role of the ubiquitin-proteasome pathway in the formation of Mallory bodies. Exp Mol Pathol. 2002;73:75–83. doi: 10.1006/exmp.2002.2451. [DOI] [PubMed] [Google Scholar]
- Bardag-Gorce F, French BA, Joyce M, Baires M, Montgomery RO, Li J, French S. Histone acetyltransferase p300 modulates gene expression in an epigenetic manner at high blood alcohol levels. Exp Mol Pathol. 2007 Jan 5; doi: 10.1016/j.yexmp.2006.10.006. Epub ahead of print. [DOI] [PMC free article] [PubMed] [Google Scholar]
- Bradford MM. A rapid and sensitive method for the quantitation of microgram quantities of protein utilizing the principle of protein-dye binding. Anal Biochem. 1976;72:248–254. doi: 10.1016/0003-2697(76)90527-3. [DOI] [PubMed] [Google Scholar]
- French BA, van Leeuwen F, Riley NE, Yuan QX, Bardag-Gorce F, Lue YH, Marceau N, French SW. Aggresome formation in liver cells in response to different toxic mechanisms. Role of the ubiquitin-proteasome pathway and the frameshift mutant of ubiquitin. Exp Mol Pathol. 2001;71:241–246. doi: 10.1006/exmp.2001.2401. [DOI] [PubMed] [Google Scholar]
- Gupta M, Gupta SK, Hoffman B, Liebermann DA. Gadd45a and Gadd45b protect hematopoietic cells from UV-induced apoptosis via distinct signaling pathways, including p38 activation and JNK inhibition. J Biol Chem. 2006;281:17552–17558. doi: 10.1074/jbc.M600950200. [DOI] [PubMed] [Google Scholar]
- Li J, French BA, Wu Y, Vankatesh R, Montgomery R, Bardag-Gorce F, Kitto J, French SW. Liver hypoxia and lack of recovery after reperfusion at high blood alcohol levels in the intragastric feeding model of alcoholic liver disease. Exp Mol Pathol. 2004;77:184–192. doi: 10.1016/j.yexmp.2004.08.002. [DOI] [PubMed] [Google Scholar]
- Lu Q, Qiu X, Hu N, Wen H, Su Y, Richardson BC. Epigenetics, disease, and therapeutic interventions. Aging Res Rev. 2006;5:449–467. doi: 10.1016/j.arr.2006.07.001. [DOI] [PubMed] [Google Scholar]
- Nagao Y, Wan Y-J, Yuan QX, Kachi K, Marceau N, French BA, French SW. Mouse model of hepatocellular hyperplastic nodule formation characterization of mRNA expression mouse model. Hepatol Res. 1999;15(4):110–112. [Google Scholar]
- Nan L, Dedes J, French BA, Bardag-Gorce F, Li J, Wu Y, French SW. Mallory body (cytokeratin aggresomes) formation is prevented in vitro by p38 inhibitor. Exp Mol Pathol. 2006a;80:228–240. doi: 10.1016/j.yexmp.2006.01.003. [DOI] [PubMed] [Google Scholar]
- Nan L, Bardag-Gorce F, Wu Y, Li J, French BA, French SW. Mallory body forming cells express the preneoplastic hepatocyte phenotype. Exp Mol Pathol. 2006b;80:109–118. doi: 10.1016/j.yexmp.2005.11.001. [DOI] [PubMed] [Google Scholar]
- Nan L, Wu Y, Bardag-Gorce F, Li J, French BA, Wilson LT, French SW. The p105/50 NF-κB pathway is essential for Mallory body formation. Exp Mol Pathol. 2005;78:198–206. doi: 10.1016/j.yexmp.2004.12.002. [DOI] [PubMed] [Google Scholar]
- Riley NE, Li J, McPhaul L, Lue Y, French SW. Heat shock proteins and Mallory bodies (cytokeratin aggresomes) in human liver biopsies. Exp Mol Pathol. 2003;74:168–174. doi: 10.1016/s0014-4800(02)00020-5. [DOI] [PubMed] [Google Scholar]
- Roomi MW, Gaal K, Yuan QX, French BA, Fu P, Bardag-Gorce F, French SW. Preneoplastic liver cell foci expansion induced by thiacetamide toxicity in drug-primed mice. Exp Mol Pathol. 2006;81(8):14. doi: 10.1016/j.yexmp.2006.02.006. [DOI] [PubMed] [Google Scholar]
- Shukla SD, Aroor AR. Epigenetic effects of ethanol on liver and gastrointestinal injury. World J Gastroenterol. 2006;12:5265–5271. doi: 10.3748/wjg.v12.i33.5265. [DOI] [PMC free article] [PubMed] [Google Scholar]
- Tazawa J, Irrie T, French SW. Mallory body formation runs parallel to gamma glutamyl transferase induction in hepatocytes of griseofulvin-fed mice. Hepatology. 1983;3:989–1001. doi: 10.1002/hep.1840030617. [DOI] [PubMed] [Google Scholar]
- Wu Y, Nan L, Bardag-Gorce F, Li J, French BA, Wilson LT, Dedes J, French SW. The role of the laminin-integrated signaling in triggering MB formation. An in vivo and in vitro study. Exp Mol Pathol. 2005;79:1–8. doi: 10.1016/j.yexmp.2005.03.005. [DOI] [PubMed] [Google Scholar]
- Yuan QX, Marceau N, French BA, Fu P, French SW. Mallory body induction in drug-primed mouse liver. Hepatology. 1996;24:603–112. doi: 10.1002/hep.510240324. [DOI] [PubMed] [Google Scholar]
- Ying J, Srivastava G, Hsieh WS, Gao Z, Murray P, Liao SK, Ambinder R, Tao Q. The stress-responsive gene GADD45G is a functional tumor suppressor, with its response to environmental stresses frequently disrupted epigenetically in multiple tumors. Clin Cancer Res. 2005;11:6442–6449. doi: 10.1158/1078-0432.CCR-05-0267. [DOI] [PubMed] [Google Scholar]
- Zerbini LF, Libermann JA. Life and death in cancer. GADD45 alpha and gamma are critical regulators of NF Kappa B mediated escape from programming cell death. Cell Cycle. 2005;4:18–20. doi: 10.4161/cc.4.1.1363. [DOI] [PubMed] [Google Scholar]
- Zhang-Gouillon ZQ, Yuan QX, Hu B, Gaal K, Marceau N, French SW. Alcohol induces Mallory body formation in drug-primed mice. Hepatology. 1998;27:116–122. doi: 10.1002/hep.510270119. [DOI] [PubMed] [Google Scholar]


