

Abstract
Background
A rapid increase in the prevalence of obesity has been reported in France since 1990. We investigated the impact of birth cohort on the changes in obesity prevalence after taking into account age and survey period.
Methods
We analyzed data from four national surveys in 1997, 2000, 2003 and 2006. For each survey, self-reported data on weight and height were recorded on mailed questionnaires sent to a sample of 20 000 households, representative of the French population. Obesity was defined according to WHO criteria, BMI ≥ 30 kg/m2. We modeled the prevalence of obesity using logistic regression with age, cohort and period as explanatory variables. As these variables are linearly dependent, only nonlinear effects can be estimated uniquely and interpreted, after including specific chosen constraints in the models.
Results
There was a progressive increase in the prevalence of obesity between 1997 and 2006, attributable either to a period or to a cohort effect. There was a substantial departure from a linear trend for the cohort effect only, which appeared to be stronger in women: there was an acceleration in the prevalence of obesity with birth cohort for individuals born after the mid-1960s, in both sexes.
Conclusions
Our results are consistent with previous studies in other countries. Compared with older generations, men and women born in the late 1960s may have been subject to early exposures that increased their lifelong susceptibility to obesity.
Keywords: Adolescent; Adult; Aged; Aged, 80 and over; Cohort Studies; Female; France; epidemiology; Health Surveys; Humans; Male; Middle Aged; Obesity; epidemiology; Young Adult
A rapid increase in the prevalence of obesity has been reported in many developed and developing countries.[1–3] In France, the prevalence of obesity among adults was relatively stable between 1980 and 1991 (changing from 6.4% to 6.5% in men and from 6.3% to 7.0% in women),[4] but more recent data from the ObEpi (“Enquête épidémiologique nationale sur le surpoids et l’obésité”) surveys have highlighted a sharp increase over the period 1997 to 2006 (from 9% to 13% in men and from 8% to 14% in women aged 18 years and over).[5]
The risks of most chronic diseases (such as type 2 diabetes mellitus, osteoarthritis, and cardiovascular diseases) commonly increase with age.[6,7] In addition, people born in the same time period experience similar living conditions that may influence their disease risk in specific ways; this is a cohort effect. Finally, the prevalence of disease can change with time; this is referred to as the period effect.[8] The effects of age, birth cohort and period cannot be identified independently, as they are intrinsically linked. Age-period-cohort models have been developed to decompose these three components.[6,7] Recently, age-period-cohort models have been used to study the prevalence of obesity in studies from Australia and Korea.[9,10] These studies concluded that prevalences of overweight and obesity were higher in younger birth cohorts, in people born after the 1960s. We analyzed data from the ObEpi surveys to search for a cohort effect on obesity in France.
METHODS
Data source
The ObEpi surveys have been described in detail.[5] Cross-sectional surveys were conducted in 1997, 2000, 2003, and 2006 by the “Taylor Nelson-Société Française d’enquêtes par sondage” (TNS-Sofres) polling institute. Data were collected from mailed questionnaires sent to a sample of 20,000 households. Quota-based sampling was designed to be representative of the French population, according to the most recent estimates by the Institut National de la Statistique et des Etudes Economiques for the distribution of age class, sex, occupational class, region and size of place of residence. This sample is a permanent sample, constituted by the polling institute on a voluntary basis. Five hundred and fifty new households are added each month to this permanent sample, replacing 550 households that are withdrawn. Aberrant and missing data, as well as data for pregnant women, were excluded from our analyses.
Study population and measures
All household members aged 15 years and older were asked to measure their weight and height, with the help of another household member when possible, and to report the values on the questionnaire. Detailed illustrated instructions were provided about how to measure height (with a tape measure, against a wall).
The body mass index (BMI) was calculated as weight in kilograms divided by the square of height in meters. Obesity was defined as BMI ≥ 30 kg/m2 for people aged 18 years and older. For participants aged 15 to 18 years, obesity was defined according to sex- and age-specific BMI thresholds provided by the International Obesity Task Force.[11] Differential response rates across strata were taken into account by weighting the analyses to reflect the population demographic distribution at the time of the survey.
Analysis
As obesity is a frequent condition, we modeled the prevalence of obesity by a logistic regression model, rather than as a Poisson regression model, with age, period and cohort as explanatory categorical variables in the full model. To reduce the number of parameters, we used three-year groupings, which maintained the correspondence between age, cohort and period, as the surveys were every three years. The numbers of people in the extreme birth cohorts (those born after 1982 and before 1923) were small, and we removed them from the final analysis. This left 23 categories with a three-year range for age (from 16 to 82 years as midpoints) and 20 categories with a three-year range for cohort (from 1924 to 1981); and period was defined by the four survey dates, three years apart. Obesity cases and non-cases were enumerated for each 3×3×3-year subset of a Lexis diagram (Figure 1), a common representation in age-period-cohort models.[12,13] These three variables are interdependent: if two are known, the third is determined. For example, a person aged 31 years in 2006 had to be born in 1975; someone born in 1975 and aged 25 years was necessarily surveyed in 2000 (Figure 1).
FIGURE 1.
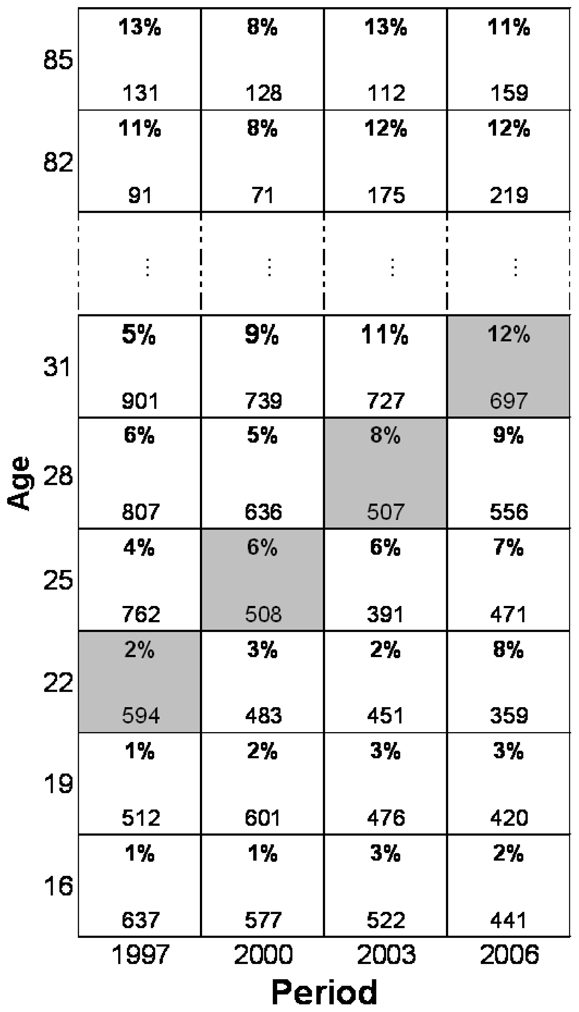
Data from the 1997 and 2000 surveys for women in a Lexis diagram: we display the percentage of obese (in bold) and the total number of women for all 3-year age groups. The squares in grey correspond to women in the same birth cohort in the four different survey periods.
Our purpose was to investigate the birth cohort effect independently of period and age. However, these three factors cannot be analyzed simultaneously, as the model suffers from a problem of parameter identification.[8] We used the method proposed by Carstensen,[12] with no constraints on parameters for age, one reference category chosen for period and for cohort, and the value of the first derivative (the slope) fixed at zero for cohort. This last constraint enables us to test for a nonlinear effect of cohort. The logistic model was fitted with no intercept and with period 1997 and cohort 1957 as reference categories. This parameterization assumes that the prevalence of obesity increases with age.
We then tested the statistical significance of departure from linear effects by comparing the deviances between nested models (likelihood ratio tests) from the model with age only to the full age-period-cohort model.[12] The statistical signification of the linear evolution of obesity prevalence observed during the survey period, which cannot be specifically attributed to cohort or to period, is called the “drift,”[12] We show this effect graphically for each birth cohort with odds ratios (95% confidence intervals). As BMI and its determinants differ according to sex,[14,15] all analyses were performed separately in men and women.
The options for model fitting (parameterization) were implemented in the R-package Epi, with the function apc.fit. The package is available through CRAN (The Comprehensive R Archive Network, http://www.r-project.org/) or at the home page http://www.biostat.ku.dk/~bxc/Epi. This program was originally developed for age-periodcohort models based on Poisson-type likelihood, and we adapted it to logistic model analysis. Recently a logistic model has been implemented in the apc.fit function.
RESULTS
In the 20,000 households, the response rates decreased with time: 73%, 71%, 70% and 67%, respectively, in 1997, 2000, 2003 and 2006. After exclusion of pregnant women, there were fewer than 2 % with aberrant data, leaving available data for 28,006 people in 1997, 26,980 in 2000, 25,770 in 2003 and 24,144 in 2006.
The prevalence of obesity increased from 1997 to 2006, at all ages and in both men and women (Figure 2). These results have been presented previously.[5] The increase was greater in young women than in young men.[5] The highest prevalences were observed around the age of 60 years. Figure 3 shows the prevalences of obesity according to age, separately for each birth cohort, in men and women. Within each birth cohort, the prevalence of obesity increased with age, even in the elderly, although less sharply than in the younger birth cohorts, especially in men. This figure also shows that recent birth cohorts had a higher prevalence of obesity than the older ones, for a given age. The increase in obesity prevalences between cohorts seemed to be greater and more regular in women than in men. Since a difference in prevalence between two birth cohorts at the same age could be due to either a cohort or a period effect, a specific parameterization of the models is needed.
FIGURE 2.
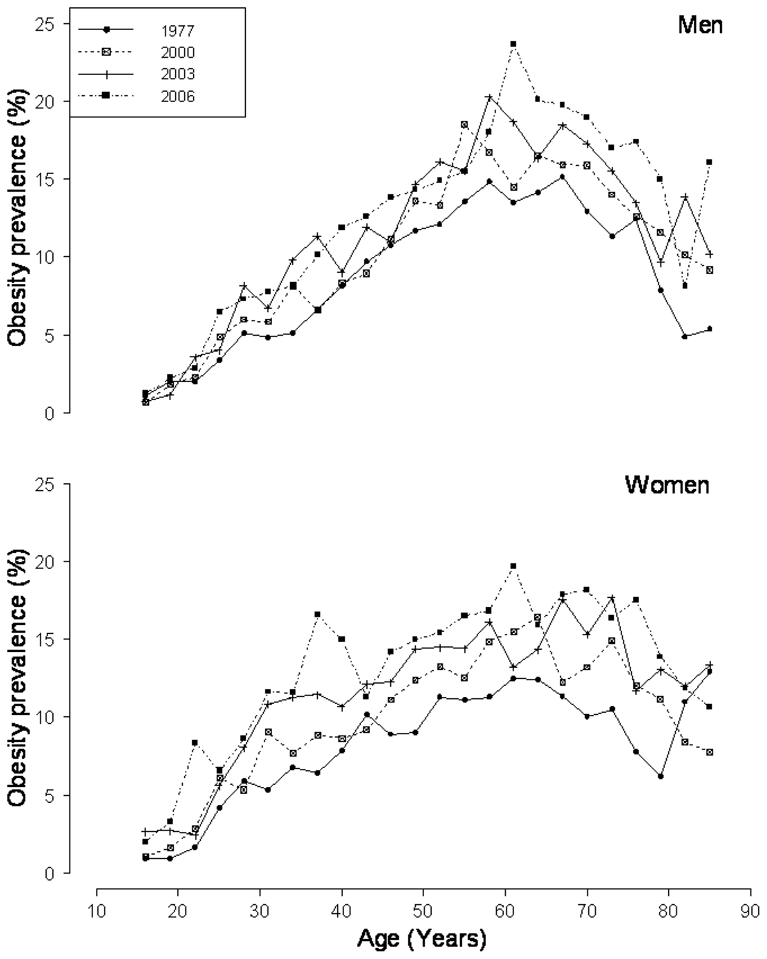
The prevalence of obesity (in 3-year age groups) by period in men and women.
FIGURE 3.
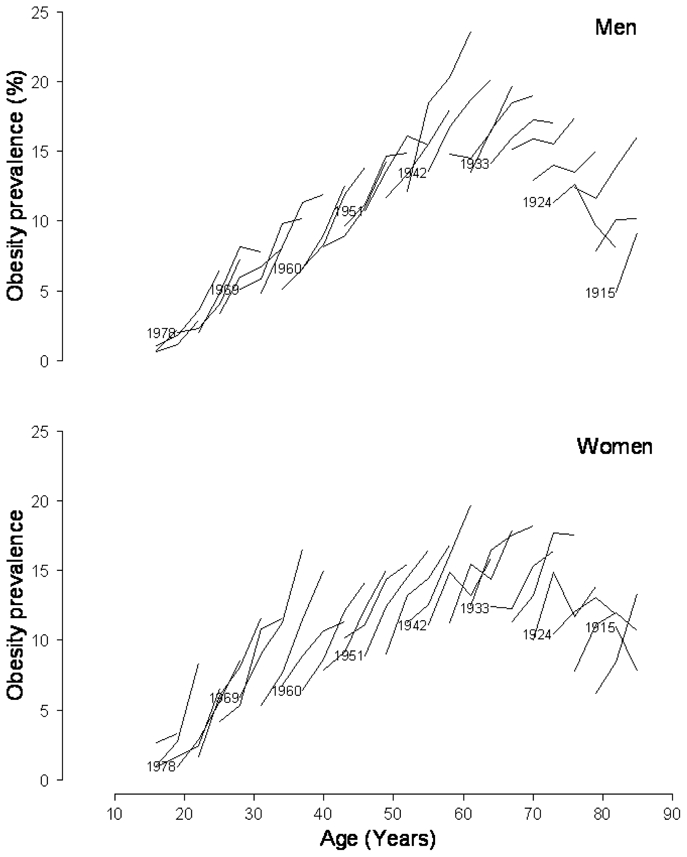
The prevalence of obesity by age (3-year age groups), separately in each 3-year birth cohort in men and women. For example, at 40 years of age, women born in 1966 had a higher prevalence than women born in 1957 (15.0% vs 7.9%, respectively, as shown by dotted lines).
The Table shows the results of the tests of the various effects. There was a constant change in obesity prevalence over the studied period, with no obvious nonlinear period effect. When this linear effect of period is taken into account, there was a nonlinear cohort effect in women, with a similar trend in men. The odds ratios (ORs) and 95% confidence intervals (CIs) for the birth cohort effect are shown on Figure 4. Figure 4A displays the combined nonlinear effect and “drift” (the linear effect that is the cohort and/or period effect). Figure 4B shows the nonlinear cohort effect adjusted for age and period. The slope for the cohort effect is constrained to be zero—that is, assuming no linear effect.
TABLE 1. Analysis of Deviance for nested Models in Men and Women.
The ObEpi (“Enquête épidémiologique nationale sur le surpoids et l’obésité”) studies.
| Residual df | Residual Deviance | Nested Model comparisons | Tested effect | Df | Deviance Difference | P-values | |||||
|---|---|---|---|---|---|---|---|---|---|---|---|
| men | women | men | women | men | women | ||||||
| model 1 | Age | 57 | 131.5 | 249.6 | |||||||
| model 1a | Age-drifta | 56 | 51.9 | 62.5 | 1 and 1a | Linear effect of cohort or period adjusted for age | 1 | 79.5 | 187.1 | <0.0001 | <0.0001 |
| model 2a | Age-cohort | 38 | 25.8 | 26.7 | 1a and 2a | Nonlinear cohort effect adjusted for age | 18 | 26.1 | 35.7 | 0.09 | 0.008 |
| model 3 | Age-period-cohort | 36 | 23.5 | 25.7 | 2a and 3 | Nonlinear period effect adjusted for age and cohort | 2 | 2.3 | 1.0 | 0.32 | 0.59 |
| model 2b | Age-period | 54 | 49.3 | 61.7 | 2b and 3 | Nonlinear cohort effect adjusted for age and period | 18 | 25.8 | 35.9 | 0.10 | 0.007 |
| model 1b | Age-drift | 56 | 51.9 | 62.5 | 1b and 2b | Nonlinear period effect adjusted for age | 2 | 2.6 | 0.8 | 0.27 | 0.66 |
The linear evolution of obesity prevalence observed during the survey period, cannot be specifically attributed to cohort or to period, and is called the “drift.” This model includes the period effect, or the cohort effect, as a quantitative variable. Whatever the variable (period of cohort), the fit and the estimation of the drift effect are identical.
FIGURE 4.
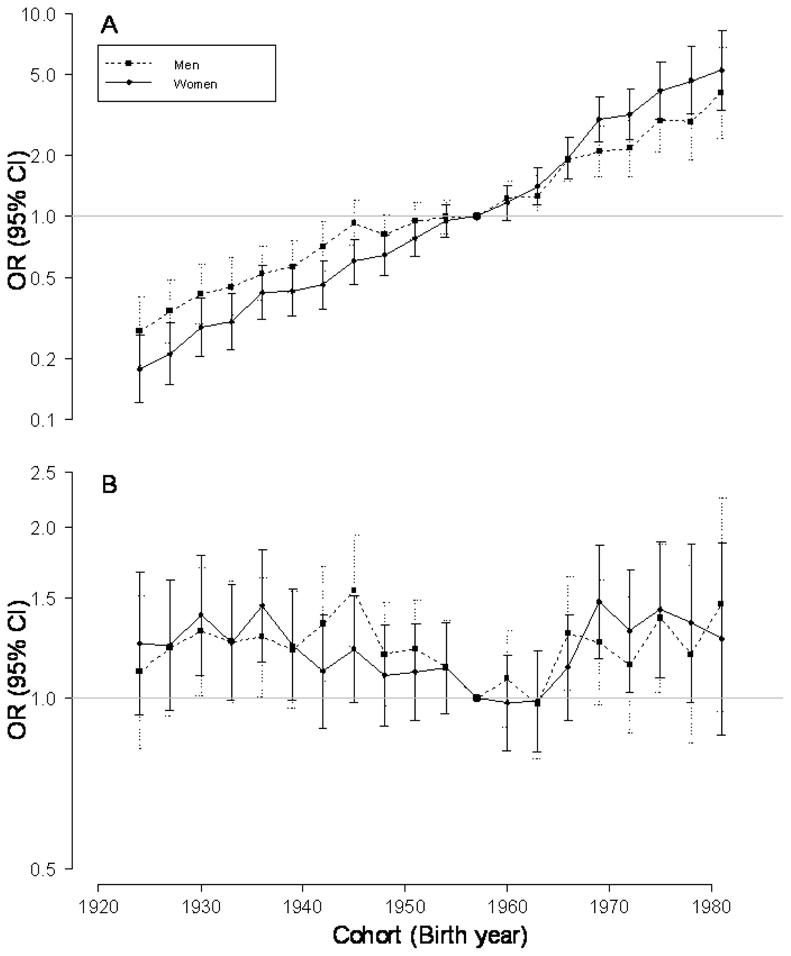
Odds Ratios (pointwise 95% confidence intervals) for birth cohort effect on obesity prevalence in reference to the cohort born in 1957, in the year 1997 (reference survey period), in men and women. A., combined drift and nonlinear effect and B., nonlinear effect.
We found a decelerating trend in the obesity prevalence for cohorts born at the end of the Second World War and during the following two decades, and an acceleration around the mid-1960s, especially in women (Figure 4). When men and women are combined, the nonlinear cohort effect is seen for the same birth cohorts (eTable 1 and eFigure 1 [http://links.lww.com]). We also performed analyses with overweight and obesity (BMI ≥ 25 kg/m2) instead of obesity as the outcome variable. A birth cohort effect (“drift” included) and a nonlinear cohort effect were found in men and women (eTable 2 [http://links.lww.com]). However, the nonlinear cohort effect in men was small and not easy to detect graphically. eFigure 2 (http://links.lww.com) displays the cohort effect with “drift” and the non linear cohort estimates for overweight and obesity in women and men.
DISCUSSION
We used an age-period-cohort analysis to better understand the increase in prevalence of obesity in France. In univariate analyses of obesity prevalence, age, period and cohort were each associated with obesity, even if each cannot be interpreted independently. The age-period- cohort analysis showed no obvious irregularity in the evolution of obesity prevalence with period between 1997 and 2006. However, the birth cohort analysis showed an acceleration for cohorts born in the mid-1960s, suggesting a change in obesity susceptibility for generations born after the 1960s, especially in women; there was a deceleration for cohorts born at the end of the Second World War and during the following two decades. The non-linear cohort effect is more obvious in women than in men for both overweight and obesity—perhaps because BMI is a better reflection of fat mass accumulation in women than men.[14]
Some limitations of the ObEpi surveys must be recognized.[5] The surveys were not based on random samples, but on the permanent panel of a poll institute. Therefore some subjects were present in more than one survey (from 1997 to 2006, 23% of subjects [n=16,380] had 2 measures, 7% of subjects [n=5222] had 3 measures, and 3% of subjects [n=2330] had measures at all survey periods). We also analyzed the age-period-cohort models including only one random observation per subject, even though this altered the representativity of each survey and decreased the number of subjects. The results remained the same but the P-value of the test for the nonlinear cohort effect decreased to 0.10 in men and 0.06 in women. Another limitation was that weight and height variables were not measured by trained investigators, but rather were reported by the surveyed individuals. To limit reporting bias, participants were asked, whenever possible, to measure themselves before reporting anthropometric data. It is likely that this constraint explains part of the non-response. However, as the methodology of the ObEpi studies remained identical over the four surveys, the resulting bias probably had less effect on the estimation of trends and accelerations than on the crude estimation of prevalence, unless the bias changed over time. The methodology of these studies has some advantages; the low cost and simplicity of the procedures make it possible to repeat the surveys and to follow the evolution of obesity prevalence in France over time.
Other studies have investigated the effect of birth cohort on the prevalence of obesity,[9,10,16,17] but they did not all use a full age-period-cohort approach. Jacobsen et al[16] for example, showed in a Norwegian cohort that, for a given age, the mean BMI and percentages of obese men or women were higher in the younger members of the cohort. We observed the same in our data, as illustrated in Figure 3. In a Finnish cohort, Lahti-Koski et al[17] also showed that, in men, the younger the birth cohort, the higher the BMI. In that cohort, the strongest increase in obesity prevalence with age was in men born between 1953 and 1957, whereas in our study the acceleration was observed for men and women born during the late 1960s. However, the analysis in these reports did not allow an interpretation of the observed trends as a specific effect of birth cohort, because it could not be distinguished from the effect of time period.
The difficulties related to the implementation of age-period-cohort models and the interpretation of the model parameters may explain why there are only a few studies that have used the full age-period-cohort approach to analyze the obesity epidemic. To our knowledge, there are only two recent studies, [9,10] and they used other methods for model parameterization.
First, Allman-Farinelli et al[9] assessed the individual contributions of age, period and birth cohort to the prevalence of overall overweight (BMI ≥ 25kg/m2) and obesity (≥ 30 kg/m2) in the Australian population in 1990, 1995, and 2000. They concluded that age, period and cohort were all independently associated with the prevalence of overweight. Age and period were also associated with obesity, but birth cohort was not. Effects were similar for men and women, except for the effect of birth cohort; the rates of overweight in women increased more with age in the recent birth cohorts than for men. In that study, the identification problem was overcome by setting two consecutive cohort categories equal to each other. However, as already mentioned, the choice of these cohorts is arbitrary, and this method provides one estimation of effect among many possibilities; this approach does not allow any conclusion as to the independence of the effects of age, period and cohort, nor to the effect of trend.[8] The other study in which the full age-period-cohort model was used was in a Korean population of men between 1992 and 2000.[10] The authors assessed the evolution of the prevalences of diabetes, overweight and obesity with age, period and cohort. Obesity and overweight increased annually in men aged 28–59 years and the younger birth cohorts had higher age-specific prevalences. Diabetes was more frequent among the younger birth cohorts and corresponded to the changes in obesity, but the magnitude of this effect was slightly lower than that for obesity. The constraints set to estimate the parameters were not specified in that paper and, as with the Australian study, we cannot compare their results directly with our results.
It is tempting to speculate, as previous authors[9,10] have done, that the increase in obesity prevalence between 1997 and 2006 corresponds to both a positive period effect (an environment more and more permissive to obesity affecting all individuals living during that period) and a positive cohort effect (younger generations more affected). Because obesity is a chronic disease with a slow rate of reversal or cure, the cohort effect may be interpreted as reflecting a lifelong exposure to an obesogenic environment. Therefore, we can assume that childhood experience contributes to the cohort effect even if our data are limited to adult ages. Moreover, a study conducted in Denmark in various birth cohorts for boys aged 7 to 11 years and among young men, also showed an increase in obesity prevalence in cohorts born from late 1960s onward.[18] That study did not use a formal age-period-cohort analysis; however, the evolution of obesity prevalence was concordant in young men aged 19 and in boys aged 7 only according to the year of birth and not according to the year of measurement. These results support the idea that very early determinants are responsible for these changes, rather than later effects such as during puberty. This study was also concordant with our study in showing a decelerating trend around the Second World War, but slightly later in Denmark than in France.
Some authors have suggested that conditions in early life have a more profound effect on the life-long risk of obesity, rather those later.[19–21] The decelerating trend in obesity in France for cohorts born at the end of the Second World War may be related to the difficult living conditions during this period. At the end of the Second World War, industrial production in France was down to half of its pre-war level and agriculture was at a complete standstill, due to the lack of men and machinery.[22] Food rationing continued after the war years, until 1947–1948.[22] People born in this time period may have experienced nutritional restriction in utero or in early life. The acceleration in obesity prevalence with birth cohort in our data, for the cohorts born after 1965, may be related to the marked improvement of living conditions that accompanies the economic boom in France known as “the 30 glorious” years (the period from 1945 to 1973).[22] An increase in energy intake (with low-quality carbohydrates and fats) and a decline in physical activity are almost universal consequences of industrial development and improvement of living conditions.[23] The trend in the prevalence of overweight seems more closely related to the changes in living conditions and nutrition in women than men.
In conclusion, an age-period-cohort analysis has showed that the recent birth cohorts were more affected by an age-related increase in obesity during the period 1997 to 2006 in France, especially women. Other studies using different methodologies, and in countries as diverse as Denmark, Australia and Korea, have also concluded that people born from the 1960s onwards seem to be at a particular risk of developing obesity. Our results also suggest a stabilization of the trend for obesity prevalence for cohorts born in the 1970s and 1980s.
Although the obesity epidemic became apparent in adults only in the 1990s in France, some of its origins (as in other countries) can be found as early as the mid 1960s. Investigations are needed to identify changes in the early life environment of these cohorts that could be responsible for this increased susceptibility to obesity.
Acknowledgments
The ObEpi surveys were funded by Institut Roche, France, with the scientific collaboration of INSERM (National Institute of Health and Medical Research), contracts INSERM-Produits Roche N 97062 and 03114A10. We thank JM Joubert, S Fages, and C Moisan from Produits Roche, G Bonnélye, J Hovart, and P Périé from TNS Sofres, and B Balkau from INSERM unit 780 for their contributions.
Footnotes
SDC Supplemental digital content is available through direct URL citations in the HTML and PDF versions of this article (www.epidem.com).
References
- 1.Popkin BM, Doak CM. The obesity epidemic is a worldwide phenomenon. Nutr Rev. 1998;56:106–114. doi: 10.1111/j.1753-4887.1998.tb01722.x. [DOI] [PubMed] [Google Scholar]
- 2.Gutierrez-Fisac JL, Banegas Banegas JR, Artalejo FR, Regidor E. Increasing prevalence of overweight and obesity among Spanish adults, 1987–1997. Int J Obes Relat Metab Disord. 2000;24:1677–1682. doi: 10.1038/sj.ijo.0801445. [DOI] [PubMed] [Google Scholar]
- 3.Mokdad AH, Serdula MK, Dietz WH, Bowman BA, Marks JS, Koplan JP. The spread of the obesity epidemic in the United States, 1991–1998. JAMA. 1999;282:1519–1522. doi: 10.1001/jama.282.16.1519. [DOI] [PubMed] [Google Scholar]
- 4.Maillard G, Charles MA, Thibult N, Forhan A, Sermet C, Basdevant A, Eschwege E. Trends in the prevalence of obesity in the French adult population between 1980 and 1991. Int J Obes Relat Metab Disord. 1999;23:389–394. doi: 10.1038/sj.ijo.0800831. [DOI] [PubMed] [Google Scholar]
- 5.Charles MA, Eschwege E, Basdevant A. Monitoring the Obesity Epidemic in France: The Obepi Surveys 1997–2006. Obesity (Silver Spring) 2008;16:2182–2186. doi: 10.1038/oby.2008.285. [DOI] [PMC free article] [PubMed] [Google Scholar]
- 6.Clayton D, Schifflers E. Models for temporal variation in cancer rates. I: Age-period and age-cohort models. Stat Med. 1987;6:449–467. doi: 10.1002/sim.4780060405. [DOI] [PubMed] [Google Scholar]
- 7.Clayton D, Schifflers E. Models for temporal variation in cancer rates. II: Age-periodcohort models. Stat Med. 1987;6:469–481. doi: 10.1002/sim.4780060406. [DOI] [PubMed] [Google Scholar]
- 8.Holford TR. Understanding the effects of age, period, and cohort on incidence and mortality rates. Annu Rev Public Health. 1991;12:425–457. doi: 10.1146/annurev.pu.12.050191.002233. [DOI] [PubMed] [Google Scholar]
- 9.Allman-Farinelli MA, Chey T, Bauman AE, Gill T, James WP. Age, period and birth cohort effects on prevalence of overweight and obesity in Australian adults from 1990 to 2000. Eur J Clin Nutr. 2008;62:898–907. doi: 10.1038/sj.ejcn.1602769. [DOI] [PubMed] [Google Scholar]
- 10.Kwon JW, Song YM, Park H, Sung J, Kim H, Cho SI. Effects of age, time period, and birth cohort on the prevalence of diabetes and obesity in Korean men. Diabetes Care. 2008;31:255–260. doi: 10.2337/dc07-0531. [DOI] [PubMed] [Google Scholar]
- 11.Cole TJ, Bellizzi MC, Flegal KM, Dietz WH. Establishing a standard definition for child overweight and obesity worldwide: international survey. BMJ. 2000;320:1240–1243. doi: 10.1136/bmj.320.7244.1240. [DOI] [PMC free article] [PubMed] [Google Scholar]
- 12.Carstensen B. Age-period-cohort models for the Lexis diagram. Stat Med. 2007;26:3018–3045. doi: 10.1002/sim.2764. [DOI] [PubMed] [Google Scholar]
- 13.Keiding N. Statistical Inference in the Lexis diagram. Phil Trans R Soc Lond. 1990;332:487–509. [Google Scholar]
- 14.Gallagher D, Visser M, Sepulveda D, Pierson RN, Harris T, Heymsfield SB. How useful is body mass index for comparison of body fatness across age, sex, and ethnic groups? Am J Epidemiol. 1996;143:228–239. doi: 10.1093/oxfordjournals.aje.a008733. [DOI] [PubMed] [Google Scholar]
- 15.Lean ME, Han TS, Deurenberg P. Predicting body composition by densitometry from simple anthropometric measurements. Am J Clin Nutr. 1996;63:4–14. doi: 10.1093/ajcn/63.1.4. [DOI] [PubMed] [Google Scholar]
- 16.Jacobsen BK, Njolstad I, Thune I, Wilsgaard T, Lochen ML, Schirmer H. Increase in weight in all birth cohorts in a general population: The Tromso Study, 1974–1994. Arch Intern Med. 2001;161:466–472. doi: 10.1001/archinte.161.3.466. [DOI] [PubMed] [Google Scholar]
- 17.Lahti-Koski M, Jousilahti P, Pietinen P. Secular trends in body mass index by birth cohort in eastern Finland from 1972 to 1997. Int J Obes Relat Metab Disord. 2001;25:727–734. doi: 10.1038/sj.ijo.0801588. [DOI] [PubMed] [Google Scholar]
- 18.Olsen LW, Baker JL, Holst C, Sorensen TI. Birth cohort effect on the obesity epidemic in Denmark. Epidemiology. 2006;17:292–295. doi: 10.1097/01.ede.0000208349.16893.e0. [DOI] [PubMed] [Google Scholar]
- 19.Botton J, Heude B, Maccario J, Ducimetiere P, Charles MA. Postnatal weight and height growth velocities at different ages between birth and 5 y and body composition in adolescent boys and girls. Am J Clin Nutr. 2008;87:1760–1768. doi: 10.1093/ajcn/87.6.1760. [DOI] [PMC free article] [PubMed] [Google Scholar]
- 20.Oken E, Gillman MW. Fetal origins of obesity. Obes Res. 2003;11:496–506. doi: 10.1038/oby.2003.69. [DOI] [PubMed] [Google Scholar]
- 21.Stettler N. Nature and strength of epidemiological evidence for origins of childhood and adulthood obesity in the first year of life. Int J Obes (Lond) 2007;31:1035–1043. doi: 10.1038/sj.ijo.0803659. [DOI] [PubMed] [Google Scholar]
- 22.Fourastié J. Les trente glorieuses; ou, La Revolution invisible de 1946 a 1975. Paris: Fayard; 1979. [Google Scholar]
- 23.Ludwig DS, Pollack HA. Obesity and the economy: from crisis to opportunity. JAMA. 2009;301:533–535. doi: 10.1001/jama.2009.52. [DOI] [PubMed] [Google Scholar]