

Abstract
Motivation: A reconstruction of full-length transcripts observed by next-generation sequencer or tiling arrays is an essential technique to know all phenomena of transcriptomes. Several techniques of the reconstruction have been developed. However, problems of high-level noises and biases still remain and interrupt the reconstruction. A method is required that is robust against noise and bias and correctly reconstructs transcripts regardless of equipment used.
Results: We propose a completely new statistical method that reconstructs full-length transcripts and can be applied on both next-generation sequencers and tiling arrays. The method called ARTADE2 analyzes ‘positional correlation’, meaning correlations of expression values for every combination on genomic positions of multiple transcriptional data. ARTADE2 then reconstructs full-length transcripts using a logistic model based on the positional correlation and the Markov model. ARTADE2 elucidated 17 591 full-length transcripts from 55 transcriptome datasets and showed notable performance compared with other recent prediction methods. Moreover, 1489 novel transcripts were discovered. We experimentally tested 16 novel transcripts, among which 14 were confirmed by reverse transcription–polymerase chain reaction and sequence mapping. The method also showed notable performance for reconstructing of mRNA observed by a next-generation sequencer. Moreover, the positional correlation and factor analysis embedded in ARTADE2 successfully detected regions at which alternative isoforms may exist, and thus are expected to be applied for discovering transcript biomarkers for a wide range of disciplines including preemptive medicine.
Availability: http://matome.base.riken.jp
Contact: toyoda@base.riken.jp
Supplementary information:Supplementary data are available at Bioinformatics online.
1 INTRODUCTION
Every cell of every organism has a signature set of RNA molecules with certain fractions, called the transcriptome. The transcriptome carries out specialized cell activities. To know all about the transcriptome is an essential step for understanding life. Several technologies are developed therefore to observe the transcriptome. Hybridization-based methods with genome tiling arrays have been used to approach all phenomena in the transcriptome for species such as humans, mice or Arabidiopsis thaliana whose genome sequences have been read with high quality (Shoemaker et al., 2001; Yamada et al., 2003). On the other hand, high-throughput sequencers, typically called next-generation sequencers (NGS), are emerging as a major equipment to acquire information about transcriptomes by the method called mRNA-Seq, because they can be applied not only for well-studied organisms but also for other exotic organisms (Mizrachi et al., 2010; Xu et al., 2011).
Using either method, a reconstruction of the shape of full-length RNA/transcripts from observation results is still a critical step in the study, because both genome tiling array probes and NGS reads are short (<100 nt) and represent partial observations of original molecules whose lengths are 1000 nt and more. There are several computational programs that address this issue. We have also developed ARTADE1, an abbreviation for ‘ARabidopsis Tiling-Array-based Detection of Exons’—the previous version of ARTADE, to reconstruct the shape of mRNA molecules based on genome information and mRNA expression profiles from genome tiling arrays (Toyoda and Shinozaki, 2005). Cufflinks is one of the major programs applied for mRNA-Seq results (Trapnell et al., 2010). However tiling array and mRNA-Seq results often contain high levels of noise, which may come from observation machinery and biological fractions (Roberts et al., 2011a; Royce et al., 2005, 2007). This makes the reconstruction of full-length transcripts more difficult if the dynamic range of expression values is low. Besides, it is known that amplification, hybridization and sequencing biases cause bad effects on observations. Almost all recent methods try to reconstruct full-length transcripts by only using transcriptome on a single condition. We think, however, there is a theoretical limit to the extent these methods can remove noise and bias.
ARTADE2 takes a novel approach to these problems named ‘positional correlations’ that are correlations of expression values for every combination of genomic positions in multiple conditions (Fig. 1). The approach is based on the principle that the correlation coefficient of expression values derived from the same RNA molecule must be 1 for every pair of positions corresponding to the RNA molecule. Positional correlation also has robustness even if expression values suffer from sequence bias, amplification and noise (details are described in Section 2.1). The concept of correlations is common to tiling arrays and next-generation sequencing. We established this idea with our new statistical method termed ARTADE2. ARTADE2 and the positional correlation information allow us to treat multiple sets of transcriptomes and obtain more reliable full-length transcripts. With this article, we show that ARTADE2 certainly improves reconstruction of RNA molecules shapes. ARTADE2 inherits some ideas from ARTADE1 about the statistical model for transcription and genome sequence information. ARTADE1 used the expression values themselves to elucidate the exon structure genome sequence under the assumptions of the Markov model, but did not take correlation into account (Toyoda and Shinozaki, 2005). ARTADE2 in contrast also can be applied to all species whose genome have been read and can treat NGS data.
Fig. 1.
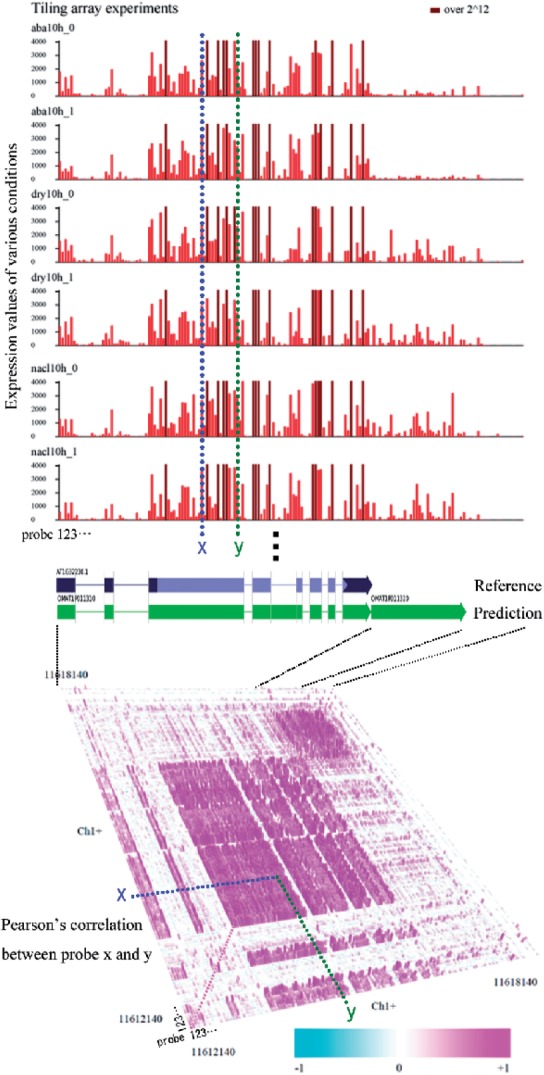
Positional correlation of transcriptomes mapped on a 2D omic-space plane (Toyoda and Wada, 2004). Positional correlations are calculated from every possible combination of 18 conditional (55 experiments) tiling arrays. Prediction of exon structure using only one measurement is difficult because each fragment is influenced by bias and noise. Exon structure is clearly shown, however, by using positional correlations of tiling array probes. As a result, ARTADE2 could predict two transcripts in the region including a novel transcript (chromosome 1 Plus 11616183..11617412). The novel transcript was also evaluated by reverse transcription–polymerase chain reaction (RT–PCR) and cDNA sequencing. (find OMAT1P011320 on Fig. 6 and Supplementary Table S5.)
ARTADE2's positional correlation approach also has good performance in detecting mRNA regions that may have alternative splicing, transcript starts and polyadenylation sites. If RNA molecules of alternative isoforms are observed under some conditions, positional correlations between the isoform region and another exon region must be not 1, because fractions of expression values for these regions are different in some conditions. In this article, we propose a method for dissecting the difference of positional correlations based on factor analysis. We demonstrate that ARTADE2 can detect and visualize alternative isoforms from multiple transcriptomes.
2 METHODS
2.1 Reconstruction of full-length transcripts from positional correlations with a mathematical model
The full-length transcript structure was predicted using a mathematical model based on ‘positional correlation’ that checks every possible combination of tiling arrays or tags of mRNA-Seq under multiple conditions (Fig. 1). Ideally, expression values of the k-th condition (k=1…, K) derived from the same RNA molecule have the same value vk in all positions of its exon regions. Let p={p1,…, pt} be set of exon positions and vpl={vpl1,…, vplK} be expression values of position pl. Obviously, r(vm, vn)=1 for every position pair (m,n) in p, where r represents Pearson's correlation, because vmk=vk regardless of position m. The correlation also has robustness of bias and amplification attributed independently to each probe. The correlation r(vm, vn) is still 1 even if the expression value of position m is changed by bias and amplification i.e. vmk=Am
vk+Bm, where Am is the amplified coefficient and Bm is bias by sequences around position m, respectively. If noise is added, for example vmk=Am
vk+Bm+ϵ(0, σm2), where ϵ(0, σm2) is Gaussian noise of mean 0 and variance σm2(<∞) and independent with all others, unfortunately an expectation of r(vm, vn) is 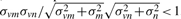 , where σvm2 is variance of vm. Even if this is the case, variances σvm2 and σvn2 increase when including multiple conditions which have variety of expression values in contrast to fixed σm2 and σn2. The influence of noise therefore is reduced with an increase of condition variations. Moreover, if there are no observations derived from RNA molecules at position m i.e. vmk=Bm+ϵ(0, σm2) for all k, an expectation of r(vm, vn) is 0 for every n. As a result, the structure of the transcript emerges by taking positional correlations of genomic positions under multiple conditions (Fig. 1).
We named the reconstruction method as ‘ARTADE2’. The ARTADE2 algorithm is illustrated in Figure 2. In this algorithm, we use the positional correlation matrix score (PCS) to measure consistency between the predicted transcript and its positional correlations using threshold of correlation coefficient θ (the calculation procedure for PCS is described in Supplementary Fig. S1). PCS is high if many positional correlations have higher values than θ for pairs of positions both of which belong to exons of the same transcript, while positional correlations have smaller values than θ for the pairs of other combinations of positions; i.e. exon–intron, intron–intron, exon–intergenic region or exons of different transcripts. PCS becomes, therefore, a criterion for determining whether the predicted transcript should be recorded.
Fig. 2.

ARTADE2 algorithm. A region in which positional correlations are high is selected as a candidate for predicted transcripts. Then estimations of threshold parameter and exon structure are alternately iterated while PCS increases. Finally, a transcript is obtained if the PCS value of the transcript exceeds 0.5.
ARTADE2 predicts transcript s by a logistic model based on Markovian nucleotide transitions of genome x and the PCS of positional correlations R formulated as
| (1) |
where Z(S) is the normalized constant. There are four scores in Equation (1). Markov transition score (MTS) is obtained from the probability of Markov transitions for states of transcripts and genome sequences. Correlation matrix score (CMS) is proportional to transcript length and PCS. Exon score (ES) and intron score (IS) are calculated from probabilistic distributions of exon and intron lengths of predicted structure. Exons and introns of the transcript are iteratively estimated by maximizing Equation 1) and optimizing threshold parameter θ. Hyperparameters α, β and ξ were previously estimated by training with 2813 RIKEN Arabidopsis full-length (RAFL) cDNAs on the plus strand of Chromosome 1. A mathematical description of the method is described in Supplementary Material: ARTADE2 Mathematics. We then record the transcript when the final estimated transcript has a PCS value >0.5. The prediction is continued until the entire genome has been scanned.
2.2 Preparing for comparison targets
This article describes our use of the original ARTADE model (Toyoda and Shinozaki, 2005), which we named ARTADE1, for performance comparisons with our present method. ARTADE1 predicts transcripts from one sample tiling arrays and sequences of nucleotides through the Markov model (Supplementary Fig. S2). Transcripts with P < 1×10⁻⁸ for their structures were independently predicted under 18 different conditions by ARTADE1. We chose a representative transcript by selecting the predicted transcript with the lowest P-value among the 18 conditions. The method can be downloaded from www.sourceforge.net (the present version is 1.2.2.2).
We also performed Cufflinks and Cuffmerge (Roberts et al., 2011b; Trapnell et al., 2010) to reconstruct transcripts based on NGS data, which were used as comparison targets. Initially, we performed Cufflinks on each mapping result, and then we merged the predicted sets with Cuffmerge. For the transcript set for Cufflinks, we selected the longest predicted model as the representative transcript if there are more than two predicted models in the same locus.
2.3 Evaluation of predicted transcripts
We compared predicted full-length transcripts with references to assess a performance of ARTADE2. The set of predicted transcripts must be expressed under some conditions. Besides this, most of predicted transcript structures must correspond to known transcript structures of Arabidopsis, because the full-length cDNAs of Arabidopsis have been significantly researched as a model for plant species. We therefore compared predicted transcripts with 39 361 TAIR9 (The Arabidopsis Information Resource version 9) gene models (http://www.arabidopsis.org). The TAIR8 genome is used for mapping of tiling arrays and mRNA-Seq data. We therefore transferred the TAIR9 gene models according to the TAIR8 genome. We paired predicted transcripts with the TAIR9 reference if they had at least 30% overlap in the region. If more than two transcripts fit, we selected the best-fit transcript pair by comparison among them. The judgment boundary about correctness of 5′ and 3′ ends was set at a 300 bp distance between the prediction and TAIR9 ends. The match rate of the predicted transcript was calculated from a correspondence as shown in Figure 3.
Fig. 3.
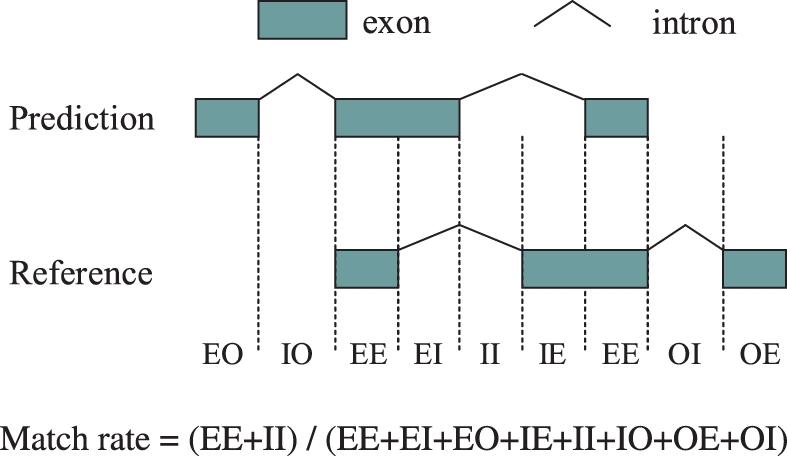
Calculation procedure of match rate used in Tables 1 and 2. The size of each region used for the match rate is measured at single nucleotide resolution.
For Figure 5, Supplementary Figs S6 and S7, we calculated precision and recall of the predicted transcript models on references with a way modified from the match rate, because some prediction methods used for the comparison provide multiple transcript models for a single locus. Locations outside the transcripts (O) and introns (I) were treated as the same in calculations of precision and recall. We also allowed correspondences between multiple predicted transcripts and multiple reference transcripts. When a position had inconsistency in multiple transcripts of prediction or annotation, such as exon and intron or exon and outside, the position was considered as an exon.
Fig. 5.
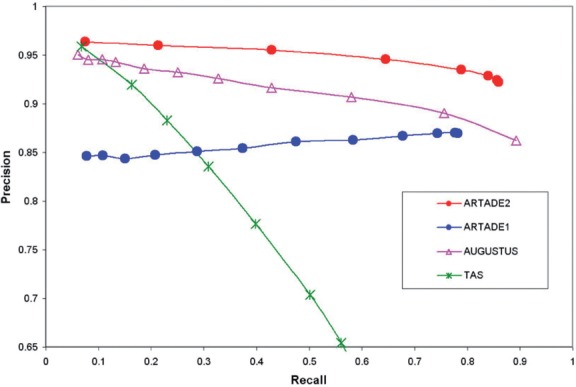
Precisions and recalls for exons between TAIR9 gene models and transcripts predicted with several methods. The precision and recall are calculated at a single nucleotide resolution. The plot curve shifts with PCS values (ARTADE2) or P-values (ARTADE1, AUGUSTUS, TAS). 7460 TAIR9 gene models with expressions over e7 were used to compare references. Transcripts used for the comparison were limited to those that overlap mutually with references in at least 30% of the genome region from 5′ end to 3′ end. The precision–recall curve of ARTADE2 covers the largest area of all methods.
2.4 Implementation of factor analysis
The factor analysis method embedded in ARTADE2 is based on a maximum likelihood (ML) method. The first and second factors obtained by ML method are rotated obliquely using the criterion of promax rotation (Hendrickson and White, 1964) after an orthogonal varimax rotation (Kaiser, 1958). From the obtained first and second major factor loadings, we checked availability of separation for the predicted transcript. If different factors were found, we re-predicted the transcript by dividing the region at the edge of two factors.
The same techniques were also applied to exons of the transcript predicted by ARTADE2 for the detection of alternative isoforms. The detected region consists of a cluster of high factor loading probes. For the detection, the number of factors was estimated by using minimum average partial method (Velicer et al., 2000). We here define a ‘discreteness’ value given to each cluster. The discreteness value measures a density of high factor loadings in cluster. Detail for the cluster detection algorithm and a definition of the discreteness is described in Supplementary Material (sections: Use of factor analysis to remove concatenation of different transcripts and and Factor Analysis for detection of regions having alternative isoforms).
2.5 Dataset
We used tiling arrays for 55 experiments with A.thaliana observed under 18 conditions (Supplementary Table S1). The GeneChip Arabidopsis tiling arrays set (1.0F Array and 1.0R Array, Affymetrix) was used. Details of RNA sample preparation were described previously (Matsui et al., 2008; Okamoto et al., 2010). Probe sequences of the tilling array set were mapped to genome of Arabidopsis TAIR8. The tiling array has intensity of perfectly matching (PM) probes and mismatch (MM) probes. We calculated expression signals from PM, MM values with MAS5 algorithm. Pre-processing of tiling array data were described earlier (Iida et al., 2011). All data are available at Gene Expression Omnibus (http://www.ncbi.nlm.nih.gov/geo/info/linking.html) under accession numbers GSE9646, GSE15700 and GSE26074.
We also used mRNA-Seq dataset with SOLiD3 Plus system (Applied Biosystems) for 16 libraries from 7 conditions (Supplementary Table S1), which are a subset of samples used for tiling array experiments. We mapped mRNA-Seq tags to the A.thaliana genome (TAIR8) with TopHat (Trapnell et al., 2009). We normalized mRNA-Seq data into each library having 1 GB of tags (i.e. 20 million reads); see Supplementary Table S2.
3 RESULTS AND DISCUSSION
3.1 Full-length transcript structures predicted with ARTADE2 significantly validated by references
ARTADE2 was used to predict 17 591 full-length transcripts. In total, 16 102 of predicted transcripts were categorized to already annotated regions with TAIR9. Table 1 shows the predicted results of ARTADE2 (the pairing procedure of prediction and references is described in Section 2.3). Gene ends were correctly matched in ∼90% of ARTADE2 predicted transcripts with an 83.24% structure match rate. Table 2 lists the prediction accuracies of ARTADE2 regarding PCS. Excluding transcripts with extremely high PCS values, the clarity of the transcript is directly correlated to the PCS value.
Table 1.
Accuracies of prediction results
| Method | Number of match models | 5′ end predictiona (%) | 3′ end predictiona (%) | Structure match rateb (%) |
|---|---|---|---|---|
| ARTADE2 | 15 804c | 88.66 | 91.67 | 83.24 |
| ARTADE1 | 14 554c | 84.37 | 83.78 | 78.31 |
aRate of models whose 5′ or 3′ end distance from TAIR9s end are with in 300 bp.
bDefinition is written at Figure 3.
cModels involved best pairs with annotated models based on match rate in 16 102 (ARTADE2) and 14 661 (ARTADE1) predicted models which were categorized as already annotated.
Table 2.
Match rate of predicted transcripts with ARTADE2 concern about PCS
| PCSa | Number | 5′end (%) | 3′end (%) | Match rate (%) |
|---|---|---|---|---|
| < 0.5, ≤ 0.6 | 813 | 73.06 | 82.41 | 73.18 |
| < 0.6, ≤ 0.7 | 4524 | 83.22 | 89.06 | 80.51 |
| < 0.7, ≤ 0.8 | 6167 | 90.92 | 92.52 | 84.57 |
| < 0.8, ≤ 0.9 | 3509 | 94.21 | 94.93 | 86.68 |
| < 0.9, ≤ 1.0 | 791 | 93.55 | 95.07 | 83.58 |
aA calculation procedure of PCS is described in Supplementary Figure S1.
For comparison with a single condition method, 15 459 transcripts were predicted by ARTADE1 (version 1.2.2.2) (Toyoda and Shinozaki, 2005), as explained in Section 2.2 (results of ARTADE1 on an individual condition are shown in Supplementary Table S3). Among them, 14 661 transcripts were categorized to already annotated regions. ARTADE2 is superior to ARTADE1 with regard to both end and transcript structure predictions. Furthermore, the number of transcripts predicted by ARTADE2 is larger than that predicted by ARTADE1. ARTADE1 particularly tends to overestimate ends compared with ARTADE2 (Supplementary Fig. S3). This overestimation produces incorrect results for RNA metabolism analysis or insignificant results for gene co-expression analysis because of an interfusion of expression values in the extra regions.
Supplementary Figure S4 shows box plot of relative importance (RI) calculated with four scores defined in Equation (1). The value of RI is the difference between scores of predicted transcripts and calculated under the assumption that the region was intergeneic. The CMS that is proportional to PCS contributes the most to ARTADE2 prediction.
3.2 ARTADE2 shows high precision and recall against highly expressed gene models
It is considered that most of the predicted transcript structures must match with already known transcript structures of TAIR9 and these transcripts should express under some conditions. Supplementary Figure S5 shows histogram of maximal expression values among 55 experiments and about 33, 239 TAIR9 representative gene models. It seems that there are two different distributions in the histogram. One is considered as the distribution of gene models, which have only background bias and noise and the other is considered as the distribution of gene models ,which express under at least one condition. Moreover, that these two distributions overlap considerably was also mentioned by Royce et al. (2005). However, it seems that highly expressed transcripts, for example whose expressions over e7, do not overlap with the background and noise distribution. Figure 4 shows a histogram of expressions of TAIR9 representative gene models and predicted transcripts by ARTADE2 without novel detections. The histogram of ARTADE2 seems consistent with the distribution of the expressed gene models.
Fig. 4.
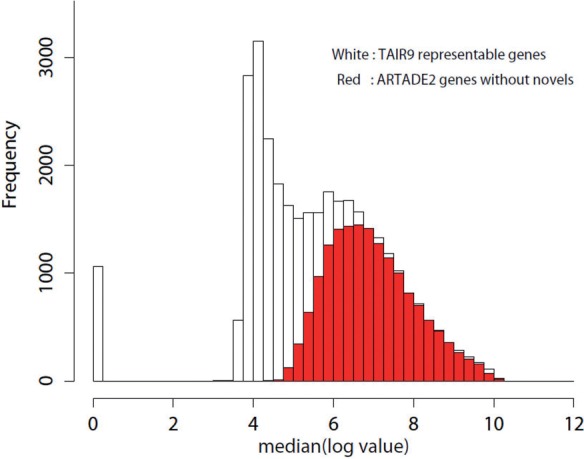
Histograms of maximum expression values for 33 239 TAIR9 representative gene models and for predicted transcripts of ARTADE2 without novel gene candidates. The ARTADE2 histogram overlaps with the right peak of the TAIR9 histogram where expression values are high.
We compared predicted transcripts of ARTADE2 to TAIR9 gene models while limiting to 7460 highly expressed gene models whose expressions were over e7 to access performance of ARTADE2 in reconstructing actually expressed transcripts. We paired predicted transcripts with the 7460 references that mutually overlap in at least 30% of their region. Figure 5 shows a precision and recall curve of exons between TAIR9 genes and predicted transcripts with ARTADE2 and other methods. Tiling Analysis Software (TAS), developed according to Affymetrix, detects the expressed region from tiling array probes. We note here that the TAS method is used only to detect expressed regions and can hardly predict any full-length transcripts. AUGUSTUS predicts genes in eukaryotic genomic sequences with a complicated hidden Markov model (Stanke and Waack, 2003). The hidden Markov model of Arabidopsis used for AUGUSTUS was based on 24 766 genes (http://augustus.gobics.de), while ARTADE2 was based on 2813 RAFL cDNAs on the plus strand Chromosome 1. In comparison to Figure 5, ARTADE2 had the largest area under the precision–recall curve. Total recalls of ARTADE2 and AUGUSTUS are much the same (0.86 and 0.89, respectively). ARTADE1 had low precision for highly expressed genes because transcripts of low P-value of ARTADE1 tended to predict multiple gene models of references as one transcript.
Precisions of ARTADE2 transcripts are also high in comparison with all TAIR9 gene models (Supplementary Fig. S6). In the result, AUGUSTUS has a high recall rate because AUGUSTUS predicts gene models by searching code transitions, which are similar to the transition model learned by known gene models in the entire genome. In contrast, ARTADE2 restricts the predicted region where probes are highly correlated since RI of CMS is high (Supplementary Fig. S4) while ARTADE2 also uses genomic sequence information. We segment these methods shown as Table 3.
Table 3.
Types of methods for transcript finding
| Method | Base information | Target transcript | Reliability of coding sequence | Expression analysis |
|---|---|---|---|---|
| AUGUSTUS | Genome | Whole genome | ++ | Requires other RNA information |
| TAS | RNA | Expressed region | − | + |
| ARTADE1 | Genome / RNA | Expressed region | + | + |
| Cufflinks (with Cuffmerge) | RNA (Multiple) | Expressed region | + | ++ |
| ARTADE2 | Genome / RNA (Multiple) | Expressed region | + | ++ |
++, very good; +, good; −, impossible.
3.3 ARTADE2 shows probable novel gene candidates
In total, 1489 transcripts existed in un-annotated regions. Among them, 1319 transcripts were allocated as antisenses of TAIR9 genes, and 170 transcripts were completely un-annotated. We confirmed that 1089 (73.1%) of novel genes were verified by mRNA-Seq, small RNA evidence (Lister et al., 2008), analysis of 5′ end tag sequences of uncapped RNAs derived by a method called parallel analysis of RNA ends (PARE, (German et al., 2009), mass spectrometry outputs for proteomes [mass (Baerenfaller et al., 2008; Castellana et al., 2008; Grobei et al., 2009; Piques et al., 2009; Reiland et al., 2009)] and cap analysis of gene expression [CAGE, (Kodzius et al., 2006)]; see Table 4 and Supplementary Table S4 for more details. In particular, the number of un-annotated transcripts verified by mass spectrometry was only 88 (5.9%) compared with an 81.2 support of known gene models. Therefore, most of the novel transcripts are considered non-coding RNAs.
Table 4.
Verification table of predicted transcripts with ARTADE2 by several evidences
| Known (16 102) |
Novel (1489) |
|||
|---|---|---|---|---|
| Count | Ratio (%) | Count | Ratio (%) | |
| mRNA-Seq | 14 553 | 90.4 | 278 | 18.7 |
| small RNA | 3873 | 24.1 | 231 | 15.5 |
| PARE | 15 774 | 98.0 | 857 | 57.6 |
| mass | 13 067 | 81.2 | 88 | 5.9 |
| CAGE | 12 897 | 80.1 | 486 | 32.6 |
| No other evidences | 92 | 0.6 | 400 | 26.9 |
To confirm the existence of novel gene candidates, we performed strand-specific RT–PCR assays as described in Supplementary Material (section of RT–PCR assays for detecting novel gene candidates). We considered a gene to be confirmed if it had a PCR product for which its size was near the predicted size and its sequence was correctly mapped on the predicted locus. We tested 16 gene candidates found in the completely un-annotated regions and obtained positive results for 14 of them (87%); see Figure 6 and Supplementary Table S5. The high rate of successful confirmation of real transcripts indicates the reliability of ARTADE2 for predicting novel genes.
Fig. 6.

Electrophoresis images of novel genes. We tested to validate 16 novel gene candidates with RT–PCR for control and 2 h dry conditions. Fourteen candidates were confirmed by both RT–PCR and correct mapping of the sequence. The expression value is the median of tiling array values in exon probes.
3.4 Application of ARTADE2 on NGS data
ARTADE2 is not only a method for tiling arrays but also for mRNA-Seq data obtained from whole transcriptome shotgun sequencing by NGS. To test performance of ARTADE2 on NGS data, we applied slightly modified ARTADE2 programs on a set of NGS data (see section: Expansion of ARTADE2 for mRNA-Seq data in Supplementary Material). We name the method for NGS as ‘NGS-ARTADE2’.
We also confirmed the performance of NGS-ARTADE2 by the same procedure used in the result of tiling arrays while comparing the result of Cufflinks. The histogram of maximum expression values of tag counts on TAIR9 representative models among 16 experiments seems to have two distributions of only background and noise and of expressed genes as well as in the case of tiling arrays; see Figure 7. There was also similar result for the tiling arrays so that the histogram of NGS-ARTADE2 was approximately consistent to the distribution of the expressed genes. However, the histogram of Cufflinks deviates for both distributions of TAIR9. Table 5 shows accuracies between NGS-ARTADE2 versus Cufflinks calculated by same procedure used for tiling array study (Table 1). NGS-ARTADE2 has superior accuracies than Cufflinks even allowing for the difference in numbers of match models.
Fig. 7.
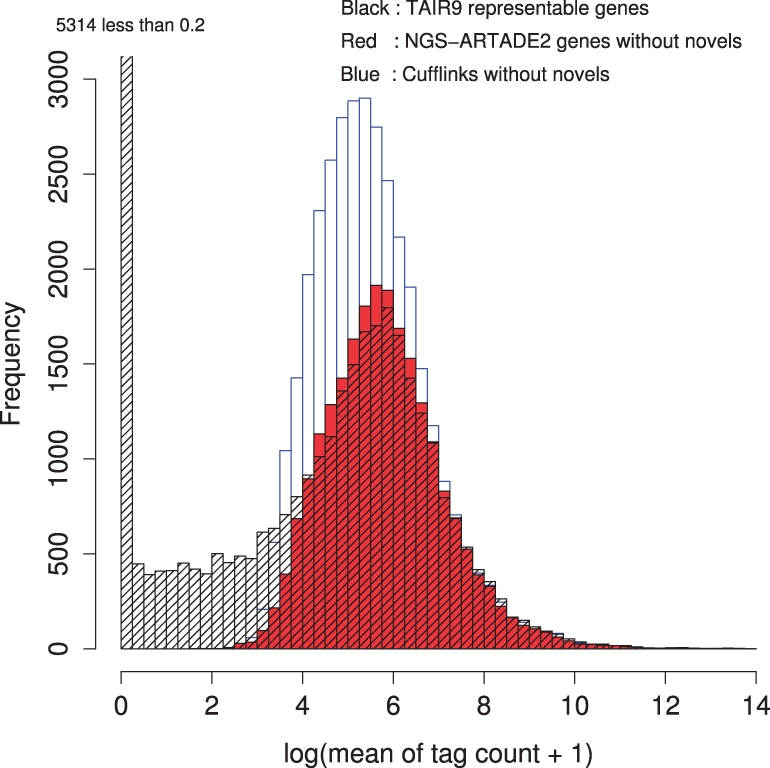
Histograms of maximal expression values for 33 239 TAIR9 representative gene models, 22 720 NGS-ARTADE2 models and 34 426 Cufflinks models. Novel models are removed in the histograms. Similar with Figure 4, we defined threshold; maximal expression values >e6 for defining expressed genes in the case of current NGS dataset. The NGS-ARTADE2 histogram fits closely with the histogram of highly expressed models of TAIR9. On the other hand, Cufflinks has a bigger peak than TAIR9, indicating that Cufflinks tends to make multiple gene models on loci where TAIR9 has a single gene model; see Figure 8 for more detail.
Table 5.
Accuracies between NGS-ARTADE2 versus Cufflinks
| Method | Number of match models | 5′ end predictiona (%) | 3′ end predictiona (%) | Structure match rateb (%) |
|---|---|---|---|---|
| NGS-ARTADE2 | 21 132c | 87.03 | 86.77 | 79.39 |
| Cufflinks | 22 962c | 70.10 | 73.63 | 69.11 |
aRate of models whose 5′ or 3′ end distance from TAIR9s end are with in 300 bp.
bDefinition is written at Figure 3.
cModels involved best pairs with annotated models based on match rate in 24 282 ARTADE2 and 36 501Cufflinks models which were categorized as already annotated.
Precisions and recalls of exons of predicted transcripts which overlap with highly expressed TAIR9 gene models (having over e6 tag means) are almost same for NGS-ARTADE2 and Cufflinks, see Supplementary Figure S7. However, NGS-ARTADE2 shows a prediction performance over Cufflinks for reconstruction of full-length transcripts. To assess the performance, we calculated coverage on transcription regions for all pairs of predicted and reference gene models (Fig. 8). NGS-ARTADE2 is superior to Cufflinks for both kinds of coverage. Coverage on references by Cufflinks is obviously small compared with other results. This is caused by the tendency of Cufflinks to split full-length transcripts wrongly. This is also a reason why the expression histogram of Cufflinks had a bigger peak than TAIR9 in Figure 7. Although Cufflinks provided a greater number of transcript models than ARTADE2, it never meant that Cufflinks had better performance for recall. Recalls of ARTADE2 and Cufflinks were almost the same, ARTADE2: 0.6306, Cufflinks: 0.6495, when we used all annotated gene models for the references irrespectively of their expression values.
Fig. 8.
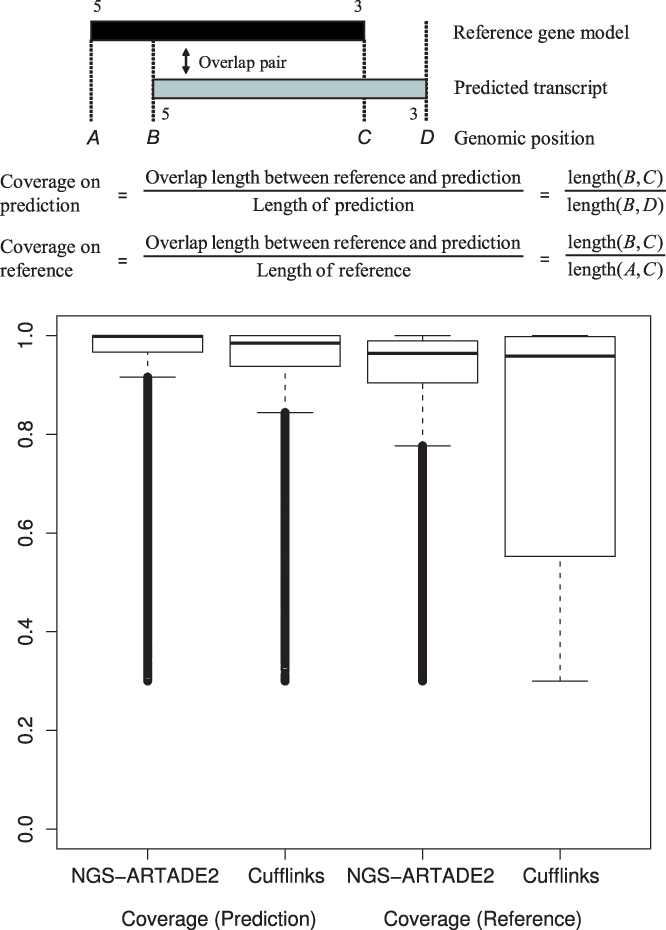
Box plots of coverage for predictions using NGS-ARTADE2 and Cufflinks. Each box plot shows coverage calculated from overlap pairs between highly expressed TAIR9 gene models as reference and transcripts of those predictions. There are two kinds of coverage. ‘Coverage on prediction’ means the cover rate of predicted transcripts by correspondent reference model and ‘Coverage on reference’ is the coverage rate of reference model. Lower coverage on reference by Cufflinks indicates more fragmented predictions compared with NGS-ARTADE2.
3.5 Factor analysis shows superior dissection of multiple transcriptome data
Sometimes two different RNAs were highly correlated and closely located on the genome to each other. ARTADE2 may, therefore, predict these RNAs as one transcript because the correlation coefficient between expression values for these RNAs goes over the threshold parameter used for calculating PCS. In this case, Promax rotation (Hendrickson and White, 1964), one of the factor analyses, can divide different elements even if these are mutually correlated. If there are different factors in predicted region, the region is divided to two regions from the boundary where the factor number which has higher factor loadings is changed (see Supplementary Fig. S8 and algorithms and section: Use of factor analysis to remove concatenating of different transcripts in Supplementary Material). Then, ARTADE2 re-predicts models in the two regions independently. Totally, 355 transcripts were split into two or more transcripts with the factor analysis (ARTADE2 + FA) in study of tiling arrays; see Figure 9. Among them, 285 (C33 + C34) set of ARTADE2+FA successfully had common 3′ and 5′ ends with TAIR9 gene models in at least one transcript while merged models that are predicted transcripts before the split did not have. A small fraction of merged models (C32) correctly predicted both 3′ and 5′ ends while ARTADE2 + FA could not predict correct ends. These may have occurred due to existences of alternative transcription starts or polyadenylation sites. Predicted transcripts used for Sections 3.2 and 3.4 were predicted with ARTADE2 + FA.
Fig. 9.
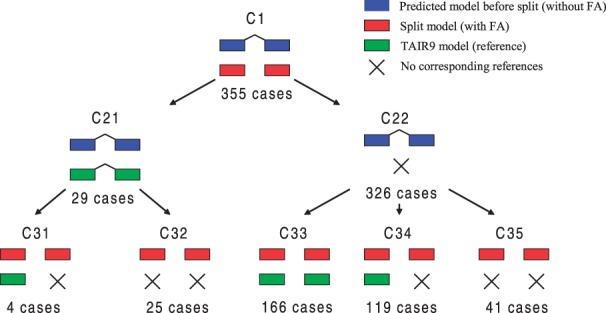
This figure shows how factor analysis improves transcript reconstruction in comparison with reference gene models. When we compared transcript models reconstructed ARTADE2 and ARTADE2 with factor analysis (ARTADE2 + FA), we found 355 ARTADE2 models were split in ARTADE2 + FA. Among them, 25 ARTADE2 models (C32) had reference gene models with better fitting than split ones (left half of the figure). On the other hand, 285 ARTADE2 models (C33 + C34) had no good-fitting reference gene models. In most of these cases, at least one set of split gene models provided by ARTADE2 + FA had good-fitting reference gene models (right half of the figure). The remaining are cases having references in both models (C31) and are not able to be judged (C35).
3.6 Elucidation of regions that may have alternative isoforms with factor analysis
Factor analysis can also detect alternative expression patterns hidden in predicted transcript structure. Figure 10 shows an example of such detection. The region known for having alternative splicing emerges as a cluster of secondary factor loadings. Moreover, factor scores indicate conditions that influence expression change in the alternative splicing. The factor analysis method detected a total of 6459 clusters in a study of tiling arrays. Among them, 2093 (32.4%) clusters overlapped with regions known as alternative isoforms of TAIR9 models. In detail, 1834 clusters were alternative start or polyadenylation sites and 259 clusters were alternative splicing regions. As well another 488 (7.6%) clusters were recognized as differences between known gene structures and predicted transcripts as in the example of the cluster shown in Supplementary Figure S9 was also confirmed that the rate of overlaps of reference increases with the decrease of the discreteness value which was defined in Section 2.4 and given to each cluster (Supplementary Figure S10). We also published detected clusters on the web server http://matome.base.riken.jp/.
Fig. 10.
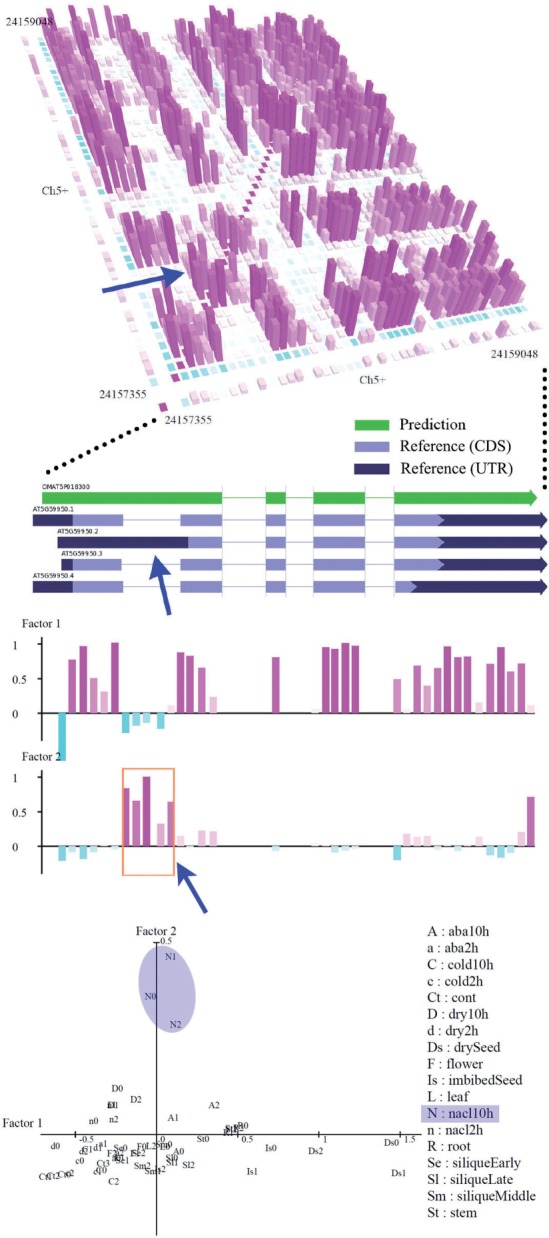
Detection of an alternative isoform that was previously annotated as alternative splicing region. Here we adopted factor analysis for probes that exist in the transcript's exon region. In the figure, we plotted the factor loadings until the second factor while the factor number is set to 5. The rectangle enclosed by an orange line is a cluster created by high factor loadings. The bottom plot shows scores for 55 experiments of factor loadings of the first (horizontal) and second (vertical) factors. It seemed that NaCl stress at 10 h is only related to the upregulation of the second factor region.
3.7 Publication of tools and results
The ARTADE2 program can be executed and downloaded on the website MAthematical Omics Modeling Engine (MATOME, http://matome.base.riken.jp/). In addition on the site, positional correlation plots of the Arabidopsis tiling array of 18 conditions and mRNA-Seq of 7 conditions can be confirmed at arbitrary regions. Clusters of alternative expression patterns detected by factor analysis for tiling array study can be also accessed and downloaded on the site. Our previously published results for ARTADE2DB can be accessed at http://artade.org. The database is built using the semantic web and provides an advanced search engine (Kobayashi and Toyoda, 2008). All transcripts predicted with ARTADE2 are recorded in the database. Moreover, the database provides functional prediction results from co-expression analysis (Iida et al., 2011).
4 CONCLUSIONS
We propose the ARTADE2 statistical method and algorithm for the reconstruction of full-length transcripts based on multi-conditional transcriptome data. The method reconstructs transcripts from positional correlations of expression data of RNA molecules observed as fragments. The correlation information specifically indicates the RNA molecule that the fragment corresponds to. We used Arabidopsis tiling arrays for 18 conditions (55 experiments) to validate performance of ARTADE2. ARTADE2 worked well in reconstructing RNA structures from fragmented RNA, including novel transcripts. Some of the novel transcripts were validated by RT–PCR and sequencing.
In addition, ARTADE2 is scalable for various types of RNA measurements. A NGS is the most likely candidate for using this method to analyze new data. For example, mRNA-Seq provides whole transcriptome shotgun sequencing data, and the annotated design of its products is similar to that of tiling array probes (Mortazavi et al., 2008). We also confirmed adaptation of ARTADE2 to mRNA-Seq data. RNA information such as exon-junction and paired-end represent additional information from mRNA-Seq which tiling array does not have. This information would also be valuable for future extension of ARTADE2. Junctions that are used in Cufflinks would clear exon or intron splicing variations. Paired-end information can be used to know intervals in which transcript regions are the same. This information would be added as some variable for the logistic model of ARTADE2.
ARTADE2 can also find information for changes in the transcript. As a result, enormous novel regions that may have alternative isoforms are detected using factor analysis. ARTADE2 would be the preliminary step in elucidating the mechanism of RNA metabolism. Theoretically, the ARTADE2 method can also be adapted for use for other species. Our proposed method can automatically and dynamically provide transcriptome descriptions of unexploited species. This will allow a significant increase in the speed of RNA analysis from new species.
Supplementary Material
ACKNOWLEDGEMENTS
We thank Junko Ishida, Maho Tanaka and Taeko Morosawa for the collection of tiling array experimental data of Arabidopsis. We also would like to thank David Gifford for careful editing of the manuscript and inspiring comments and suggestions.
Funding: ‘Research Program of Innovative Cell Biology by Innovative Technology’ grant from the Ministry of Education, Culture, Sports, Science and Technology (MEXT), Japan; National Bioscience Database Center (NBDC) of Japan Science and Technology Agency (JST) (to T.T.).
Conflict of Interest: none declared.
REFERENCES
- Baerenfaller K., et al. Genome-scale proteomics reveals Arabidopsis thaliana gene models and proteome dynamics. Science. 2008;320:938–941. doi: 10.1126/science.1157956. [DOI] [PubMed] [Google Scholar]
- Castellana N.E., et al. Discovery and revision of Arabidopsis genes by proteogenomics. Proc. Natl Acad. Sci. USA. 2008;105:21034–21038. doi: 10.1073/pnas.0811066106. [DOI] [PMC free article] [PubMed] [Google Scholar]
- German M.A., et al. Construction of Parallel Analysis of RNA Ends (PARE) libraries for the study of cleaved miRNA targets and the RNA degradome. Nat. Protoc. 2009;4:356–362. doi: 10.1038/nprot.2009.8. [DOI] [PubMed] [Google Scholar]
- Grobei M.A., et al. Deterministic protein inference for shotgun proteomics data provides new insights into Arabidopsis pollen development and function. Genome Res. 2009;19:1786–1800. doi: 10.1101/gr.089060.108. [DOI] [PMC free article] [PubMed] [Google Scholar]
- Hendrickson A.E., White P.O. PROMAX : a quick method for rotation to oblique simple structure. Br. J. Stat. Psychol. 1964;17:65–70. [Google Scholar]
- Iida K., et al. ARTADE2DB: improved statistical inferences for Arabidopsis gene functions and structure predictions by dynamic-structure-based dynamic expression (DSDE) analyses. Plant Cell Physiol. 2011;52:254–264. doi: 10.1093/pcp/pcq202. [DOI] [PMC free article] [PubMed] [Google Scholar]
- Kaiser H.F. The varimax criterion for analytic rotation in factor analysis. Psychometrika. 1958;23:187–200. [Google Scholar]
- Kobayashi N., Toyoda T. Statistical search on the Semantic Web. Bioinformatics. 2008;24:1002–1010. doi: 10.1093/bioinformatics/btn054. [DOI] [PubMed] [Google Scholar]
- Kodzius R., et al. CAGE: cap analysis of gene expression. Nat. Methods. 2006;3:211–222. doi: 10.1038/nmeth0306-211. [DOI] [PubMed] [Google Scholar]
- Lister R., et al. Highly integrated single-base resolution maps of the epigenome in Arabidopsis. Cell. 2008;133:523–536. doi: 10.1016/j.cell.2008.03.029. [DOI] [PMC free article] [PubMed] [Google Scholar]
- Matsui A., et al. Arabidopsis transcriptome analysis under drought, cold, high-salinity and ABA treatment conditions using a tiling array. Plant Cell Physiol. 2008;49:1135–1149. doi: 10.1093/pcp/pcn101. [DOI] [PubMed] [Google Scholar]
- Mizrachi E., et al. De novo assembled expressed gene catalog of a fast-growing Eucalyptus tree produced by Illumina mRNA-Seq. BMC Genomics. 2010;11:681. doi: 10.1186/1471-2164-11-681. [DOI] [PMC free article] [PubMed] [Google Scholar]
- Mortazavi A., et al. Mapping and quantifying mammalian transcriptomes by RNA-Seq. Nat. Methods. 2008;5:621–628. doi: 10.1038/nmeth.1226. [DOI] [PubMed] [Google Scholar]
- Okamoto M., et al. Genome-wide analysis of endogenous abscisic acid-mediated transcription in dry and imbibed seeds of Arabidopsis using tiling arrays. Plant J. 2010;62:39–51. doi: 10.1111/j.1365-313X.2010.04135.x. [DOI] [PubMed] [Google Scholar]
- Piques M., et al. Ribosome and transcript copy numbers, polysome occupancy and enzyme dynamics in Arabidopsis. Mol. Syst. Biol. 2009;5:1–17. doi: 10.1038/msb.2009.68. [DOI] [PMC free article] [PubMed] [Google Scholar]
- Reiland S., et al. Large-scale Arabidopsis phosphoproteome profiling reveals novel chloroplast kinase substrates and phosphorylation networks. Plant Physiol. 2009;150:889–903. doi: 10.1104/pp.109.138677. [DOI] [PMC free article] [PubMed] [Google Scholar]
- Roberts A., et al. Improving RNA-Seq expression estimates by correcting for fragment bias. Genome Biol. 2011a;12:R22. doi: 10.1186/gb-2011-12-3-r22. [DOI] [PMC free article] [PubMed] [Google Scholar]
- Roberts A., et al. Identification of novel transcripts in annotated genomes using RNA-Seq. Bioinformatics. 2011b;27:2325–2329. doi: 10.1093/bioinformatics/btr355. [DOI] [PubMed] [Google Scholar]
- Royce T.E., et al. Issues in the analysis of oligonucleotide tiling microarrays for transcript mapping. Trends Genet. 2005;8:466–475. doi: 10.1016/j.tig.2005.06.007. [DOI] [PMC free article] [PubMed] [Google Scholar]
- Royce T.E., et al. Assessing the need for sequence-based normalization in tiling microarray experiments. Bioinformatics. 2007;23:988–997. doi: 10.1093/bioinformatics/btm052. [DOI] [PubMed] [Google Scholar]
- Shoemaker D.D., et al. Experimental annotation of the human genome using microarray technology. Nature. 2001;409:922–927. doi: 10.1038/35057141. [DOI] [PubMed] [Google Scholar]
- Stanke M., Waack S. Gene prediction with a hidden Markov model and a new intron submodel. Bioinformatics. 2003;19(Suppl. 2):215–225. doi: 10.1093/bioinformatics/btg1080. [DOI] [PubMed] [Google Scholar]
- Toyoda T., Wada A. Omic space: coordinate-based integration and analysis of genomic phenomic interactions. Bioinformatics. 2004;20:1759–1765. doi: 10.1093/bioinformatics/bth165. [DOI] [PubMed] [Google Scholar]
- Toyoda T., Shinozaki K. Tiling array-driven elucidation of transcriptional structures based on maximum-likelihood and Markov models. Plant J. 2005;43:611–621. doi: 10.1111/j.1365-313X.2005.02470.x. [DOI] [PubMed] [Google Scholar]
- Trapnell C., et al. TopHat: discovering splice junctions with RNA-Seq. Bioinformatics. 2009;25:1105–1111. doi: 10.1093/bioinformatics/btp120. [DOI] [PMC free article] [PubMed] [Google Scholar]
- Trapnell C., et al. Transcript assembly and quantification by RNA-Seq reveals unannotated transcripts and isoform switching during cell differentiation. Nat. Biotechnol. 2010;28:511–515. doi: 10.1038/nbt.1621. [DOI] [PMC free article] [PubMed] [Google Scholar]
- Velicer W.F., et al. Construct explication through factor or component analysis: A review and evaluation of alternative procedures for determining the number of factors or components. In: Goffin R.D., Helmes E., editors. Problems and solutions in human assessment: Honoring Douglas N. Jackson at seventy. Kluwer Academic Publishers; 2000. pp. 41–71. [Google Scholar]
- Xu X., et al. Genome sequence and analysis of the tuber crop potato. Nature. 2011;475:189–195. doi: 10.1038/nature10158. [DOI] [PubMed] [Google Scholar]
- Yamada K., et al. Empirical analysis of transcriptional activity in the Arabidopsis genome. Science. 2003;302:842–846. doi: 10.1126/science.1088305. [DOI] [PubMed] [Google Scholar]
Associated Data
This section collects any data citations, data availability statements, or supplementary materials included in this article.