

Abstract
Motivation: We describe a statistical model to dissect the noise in transcriptional bursts in a developmental system.
Results: We assume that, at any given moment of time, each copy of a native gene inside a cell can exist in either a bursting (active) or non-bursting (inactive) state. The experimentally measured total noise in the transcriptional states of a gene in a population of cells can be mathematically dissected into two contributing components: internal and external. While internal noise quantifies the stochastic nature of transcriptional bursts, external noise is caused by cell-to-cell differences including fluctuations in activator concentration. We use our developed methods to analyze the Drosophila Bicoid (Bcd) morphogen gradient system. For its target gene hunchback (hb), the noise properties can be recapitulated by a simplified gene regulatory model in which Bcd acts as the only input, suggesting that the external noise in hb transcription is primarily derived from fluctuations in the Bcd activator input. However, such a simplified gene regulatory model is insufficient to predict the noise properties of another Bcd target gene, orthodenticle (otd), suggesting that otd transcription is sensitive to additional external fluctuations beyond those in Bcd. Our results show that analysis of the relationship between input and output noise can reveal important insights into how a morphogen gradient system works. Our study also advances the knowledge about transcription at a fundamental level.
Contact: jun.ma@cchmc.org
Supplementary information: Supplementary data are available at Bioinformatics online.
1 INTRODUCTION
Transcription is an inherently noisy molecular process that takes place as burst-like events (Boettiger and Levine, 2009; Eldar and Elowitz, 2010; Friedman et al., 2006; Ma, 2011; Raj et al., 2006; To and Maheshri, 2010). How the incoherent transcriptional bursts lead to coherent and precise gene expression patterns during development is a fundamental question and a subject of intense investigations (Martinez Arias and Hayward, 2006). It has been suggested that averaging over time and/or space allows a biological system to gain coherence and improve expression boundary precision (Erdmann et al., 2009; Gregor et al., 2007; He et al., 2010a; Okabe-Oho et al., 2009; Tostevin et al., 2007). To fully understand how precise gene expression patterns are achieved in response to morphogen inputs, it is necessary to have methods that can evaluate the experimentally detected transcriptional bursts before such averaging takes place. Here we develop a statistical model for such a purpose, where we mathematically dissect the experimentally measured total noise into the internal and external components.
We use our model to analyze our experimental data extracted from early Drosophila embryos (He et al., 2011), where both the nuclear concentrations of the activator Bicoid (Bcd) and the transcriptional states of its target genes hunchback (hb) and orthodenticle (otd) are simultaneously measured. We show that the dissected external noise in hb transcriptional bursts can be implicitly derived from the measured Bcd input noise. In contrast, additional input noise is required to account for both the measured total noise and the dissected external noise in otd transcription. These results suggest that, although Bcd acts as a direct and sustained input for both otd and hb transcription (He et al., 2011; Liu et al., 2011), these two target genes are distinct from each other. Our findings are consistent with recent studies (Kim et al., 2011a, b; Lohr et al., 2009; Ochoa-Espinosa et al., 2009), suggesting that, in addition to Bcd, otd transcription also responds to other input(s) and, thus, is sensitive to additional external fluctuations. Our study provides an example illustrating the use of dissecting experimentally measured transcriptional noise in understanding the mechanistic operations of a native morphogen gradient system.
2 METHODS
To obtain our published dataset (He et al., 2011), we combined fluorescence in situ hybridization with immunostaining on 1–4 h w1118 embryos. Here, we used flattened embryos to maximize the number of nuclei per embryo and we took ∼6 Confocal z-section images in 0.5 μm intervals to capture all the intron dots. Our imaging setting was maintained the same for different embryos on different slides with all images captured in a single imaging cycle. Thus the datasets under our experimental conditions have the same molecule number-to-intensity rescaling factors, which make it possible to combine the data extracted from different embryos and group nuclei according to their A–P positions. In our detection for intron dots, the definition of thresholds is according to He et al. (2011) and the threshold setting was optimized to detect a stable pattern of the intron dot expression. A comparison between machine-recognized intron dots and human-recognized dots indicates an uncertainty of 8% in our analysis. See He et al. (2011) for further technical details and intron dot data quality, and He et al. (2008, 2010a) for Bcd data quality under our experimental conditions. In our current analysis, we use each detected intron dot to denote a gene copy that is actively transcribing in a snapshot (see main text for details). The distributions of experimentally detected intron dot numbers suggest that the two copies of hb or otd in a nucleus are independent (not shown).
3 RESULTS
3.1 A statistical model for evaluating transcriptional noise
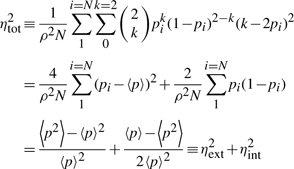
Let us consider a standard diploid cell that has two identical copies of a gene. At a given moment of time, i.e. in a snapshot of the cell, each copy can exist in either an actively-transcribing (bursting) or non-transcribing (non-bursting) state. Experimentally, actively transcribing gene copies can be detected as ‘intron dots’ (see Section 2 and further on for experimental details). We define gene copies that are actively transcribing as active copies and those that are not as inactive copies. We assume that both copies of the gene in this cell are independent of each other. They have an identical probability p of existing as active copies. Thus, the probability of this cell to have k active copies of the gene in a snapshot can be expressed as in Equation (1). The mean and noise (i.e. fractional variance) of the numbers of active copies in this cell are ρ=2p and η2=(1−p)/2p.
| (1) |
We then consider a population of N cells. We assume that all copies of the gene in this population are independent. For the i-th cell in this population, we denote the probability of its gene copies existing as active copies by pi. We now evaluate all copies of the gene in all the cells in this population. The mean and noise of number of active copies per cell can be expressed, respectively, as in Equations (2) and (3).
| (2) |
 |
(3) |
In Equation (3), the total noise of the stated system, ηtot, is a simple sum of two components. One component is from the noise in p, which is induced by cell-to-cell differences that we define as external noise, ηext. The other contribution, which we define as internal noise, ηint, is proportional to the variance of the intrinsic binomial distribution of the binary states, which is calculated for each cell and then averaged over the entire population of cells. The quantity 〈p2〉 can be calculated as:
| (4) |
By experimentally measuring the mean number of active copies (ρ) and its total noise (ηtot), we can obtain both ηext and ηint as:
| (5) |
| (6) |
In Supplementary Material, we present a general case of noise dissection in cells with c identical copies of a gene. As discussed there, for genes with a single copy per cell (c=1), such as X-linked genes in Drosophila males, the quantity 〈p2〉 cannot be measured and, consequently, ηext and ηint cannot be dissected in our model.
The approach described above for noise dissection is broadly analogous to the previous concepts developed for single-cell systems (Elowitz et al., 2002; Hilfinger and Paulsson, 2011; Raser and O'Shea, 2004; Raser and O'Shea, 2005; Swain et al., 2002; Thattai and van Oudenaarden, 2001), but it has several important features. In particular, the noise defined here is based on the active and inactive copies of a gene, data that can be extracted from snapshots without the need to acquire live-imaging data. In addition, it is based on the endogenous copies of the gene (see Section 2 and further on for experimental details) and does not require engineered reporters such as dual reporters. The dual-reporter analysis requires an assumption that the two reporters and their products are identical because differences between the two reporters and products can falsely contribute to the internal noise component. The use of the endogenous gene copies as in our study does not require this assumption because both copies and their products are identical. Furthermore, as discussed below, our experimental system is an entire embryo, where technically cells have not yet been formed at the time of analysis. Thus, the external source of fluctuations estimated in our study includes both embryo-to-embryo and nucleus-to-nucleus variances. For this reason, we use the terms ‘internal’ and ‘external’ as opposed to ‘intrinsic’ and ‘extrinsic’.
3.2 Propagation of activator input noise to transcriptional noise
We now consider the external noise in an ideal, simplified gene regulatory system where an activator is the only input for its target gene's transcriptional output. As before (Gregor et al., 2007; He et al., 2008, 2011), we use a Hill function to describe the relationship between the expected probability of a gene copy to exist as an active copy (p) and the activator concentration inside the nucleus of a cell (B):
| (7) |
where pmax, K and h are, respectively, the maximal burst probability, the activator concentration at half maximal burst probability and the Hill coefficient. These values can be adjusted in theoretical studies for evaluating the behavior of different target genes or different transcription system. They can also be calculated directly from experimental data (see below). Equation (7) makes it possible, similar to propagation of errors (Gregor et al., 2007), to directly convert fluctuations in activator concentration, ηB=δB/B, to the variance of the burst probability of its target gene:
| (8) |
As defined in Equation (3), the external noise (ηext) in the transcriptional bursts of the target gene is the noise in p:
| (9) |
where ρmax=2pmax.
To facilitate calculations in a theoretical analysis, we assume (He et al., 2010a; Tkacik et al., 2008; Tostevin et al., 2007) that the noise in the nuclear concentration of this activator, B, is Poissonian, ηB2=v/B, where v is referred to as the noise strength. Applying this distribution of ηB to Equation (9) leads to the expression of ηext as a function of ρ:
| (10) |
Figure 1 shows ηext, converted from activator input noise according to Equation (10), as a function of ρ/ρmax. Figure 1A and B show the effects of v/K and h, respectively, on ηext. Thus, ηext can be calculated by two distinct methods: one that is based on the active and inactive states of the gene copies with the noise in transcription dissected according to Equation (5), and another that is based on the activator input noise that is converted to ηext using the input–output relationship in Equation (10). These two calculations should arrive at the same ηext value in the ideal, simplified gene regulatory system. We will use this property of an ideal, simplified system to evaluate those of the real biological systems. In particular, if the ηext values calculated from these two methods are similar, it would suggest that the actual biological system can be approximated by the simplified gene regulatory system, but a significant deviation between these two values would be indicative of oversimplification of the real biological system.
Fig. 1.

Parameters affecting noise propagation. Activator input noise is converted to external noise (ηext) in target gene transcription based on Equation (10) in a simplified gene regulatory model. Here, ηext is shown as a function of ρi, the mean number of active copies. The effects of parameters that affect noise propagation are also shown. Such parameters include the activator noise strength (v), the activator threshold concentration (K) and the Hill coefficient (h). Figure 1A shows that ηext increases as the normalized noise strength (v/K) increases. Figure 1B shows that, at a given v/K, the effect of h on ηext is sensitive to ρ.
3.3 Evaluation of hb transcription data suggests a dominant role of Bcd input
We now evaluate experimental data extracted from early Drosophila embryos (He et al., 2011). Bcd is a transcriptional activator that forms an anterior-to-posterior (A–P) gradient (Driever and Nusslein-Volhard, 1988; Houchmandzadeh et al., 2002). It instructs embryonic patterning by activating its target genes in a concentration-dependent manner (Ephrussi and St Johnston, 2004; Grimm et al., 2010; Liu et al., 2011; Porcher and Dostatni, 2010). During the period of Bcd action (i.e. at the syncytial stage of embryonic development), all nuclei undergo synchronous mitotic divisions and, thus, nuclear Bcd concentration represents a primary source of nucleus-to-nucleus differences relevant to Bcd target gene transcription. In our simplified gene regulatory model, cell-to-cell differences arise solely from activator concentration differences. In addition, our previous analyses of hb expression profiles in embryos with perturbed Bcd gradient properties suggest that Bcd acts as a dominant input at early nuclear cycle 14, a time for our current analysis (Cheung et al., 2011; He et al., 2008, 2010a, 2010b, 2011; Liu and Ma, 2011; Liu et al., 2011). At earlier cycles, maternal Hb acts as an additional input for zygotic hb transcription (Porcher et al., 2010). In our simplified gene regulatory model, the activator is the only input for the active copies of its target gene. These considerations suggest that hb represents an excellent candidate of a native Bcd target gene suitable for evaluation against the simplified gene regulatory model.
As detailed previously (He et al., 2011), our experimental dataset consists of the Bcd concentration (in arbitrary units) and the hb transcriptional states of individual nuclei of fixed wild-type (wt) embryos. Currently this is the only high-quality combined dataset that contains both the Bcd input data and the hb transcriptional states in embryos. In our experiments, we used an intronic probe to detect the nascent hb transcripts, with a simultaneous detection of Bcd through immunostaining. Images of these embryos thus capture, as in snapshots, distinct fluorescent dots, referred to as the hb intron dots (He et al., 2011). The reliability of both Bcd input data (He et al., 2008, 2010a) and the intron dot data (He et al., 2011) under our experimental conditions has been described previously. For our current analysis, we count the number of the hb intron dots in individual nuclei from the relevant parts of individual embryos. Here, we use a detected hb intron dot to denote an active copy of the hb gene. We sort our data by binning them according to the A–P position, and calculate the mean (ρ) and noise (ηtot) of active copies for nuclei within the bins. Using Equations (5) and (6), we dissect ηtot into ηext and ηint for each bin. Figure 2A shows a scatter plot (on log–log scale) of the measured ηtot (blue circles) and the dissected ηext (green diamonds) and ηint (red squares) as a function of ρ. Figure 2A also shows our theoretical predictions (solid lines) calculated from Equation (10) using the following values that are derived from fitting the experimental data (see legends): h=6, v=0.5 and K=6. Our results show a resemblance between the measured/dissected noise profiles and those calculated theoretically. They suggest that the experimentally measured (and dissected) noise properties for hb transcription are broadly similar to those predicted theoretically in a simplified gene regulatory model (see Fig. 2 legend for adjusted R2-values and below for an experimental system with contracting behaviors).
Fig. 2.

hb and otd have distinct noise properties in relation to the Bcd input noise. The experimentally measured ηtot (blue circles) in hb (A) and otd (C) intron dot numbers is dissected into ηext (green diamonds) and ηint (red squares) according to Equations (5) and (6), and the results are plotted against ρ. Solid lines are theoretical predictions based on Equation (10) in the simplified gene regulatory model. The adjusted R2-values of fitting the experimental data with the model for ηext, ηint and ηtot of hb are, respectively: 0.85, 0.99 and 1.00; the adjusted R2-values for ηext, ηint and ηtot of otd are, respectively: −0.48, 0.97 and 0.98. The negative R2 suggests that, constrained by the measured parameter values, the model cannot predict ηext of otd. Arrowheads show the boundary positions of ρ=ρmax/2. Here, K–values are measured as the mean Bcd concentrations at the marked boundary positions and h–values are extracted by fitting Equation (7) with the experimentally measured B–ρ profiles (He et al., 2011). Since fluctuations in Bcd concentration are dominated by Poisson-like molecular noise (He et al., 2010a), we perform a simple fitting of the experimentally measured Bcd noise to Poissonian distribution for extracting v-values. Figure 2B and D are scatter plots of dissected ηext (same as in Figures 2A and C but showing data only from the activation boundary regions for better data spread) against converted ηext (see text for details). Here, Figures 2B and C are for hb and otd, respectively. A linear regression line is also shown (with the equation in the inset box) for each panel.
In our theoretical predictions shown as solid lines in Figure 2A, a Poissonian distribution of Bcd concentration fluctuations is assumed. To evaluate whether our conclusions are dependent on this assumption, we directly converted experimentally measured Bcd input noise to ηext using Equation (9) without such an assumption. Figure 2B shows a scatter plot of ηext values calculated by two distinct methods (see above): one from the measured noise in hb intron dot number through Equation (5) (shown as the dissected ηext in figure) and another converted from the experimentally measured Bcd noise through Equation (9) (shown as the converted ηext in figure). The two ηext values at individual A–P positions exhibit good agreement with each other, suggesting that, consistent with a previous study (He et al., 2010a), molecular (Poissonian) fluctuations in Bcd concentration are a dominant source of the measured Bcd noise in relevant parts of the embryos under our experimental conditions. Furthermore, as discussed above, the experimentally measured (and dissected) noise properties of the hb transcription system are well approximated by our simplified gene regulatory model. Together, they further support the suggestion that the nucleus-to-nucleus fluctuations in Bcd concentration are a dominant source of the external noise in hb transcriptional bursts (see also Holloway et al., 2011).
A recent theoretical study (Saunders and Howard, 2009) has suggested that an exponential morphogen gradient may be evolutionarily advantageous because of its ability to balance between the external and internal sources of noise for achieving precise target gene expression boundaries. Our results show that the hb boundary position (marked by an arrowhead in Fig. 2A) coincides with a convergence of noise profiles that results in a more balanced contribution of ηext and ηint. These results suggest that, based on Saunders and Howard (2009), the Bcd gradient system in wt embryos may be optimal for the hb boundary precision.
3.4 Dissection of otd transcriptional noise suggests a role of additional input(s)
In addition to hb, Bcd also activates the expression of another target gene otd in early Drosophila embryos (Gao and Finkelstein, 1998). Unlike hb, the Bcd-activated otd expression boundary position is much closer to the anterior of the embryo. Although Bcd also acts as a direct and sustained input for otd transcription (He et al., 2011), recent studies suggest that otd expression is subject to regulation by both the Bcd gradient and the terminal system inputs mediated by a mitogen-activated protein kinase (MAPK) pathway (Kim et al., 2011a, b; Lohr et al., 2009; Ochoa-Espinosa et al., 2009; Porcher and Dostatni, 2010). Thus, the otd transcriptional system may significantly deviate from our simplified gene regulatory model, where an activator is assumed to be the only input for its target gene transcription. To test this idea, we analyze our otd data in a manner identical to our hb analysis described above. As discussed in Supplementary Material and above, male embryos have a single copy of otd (i.e. c=1) and, thus, such data are not suitable for the noise dissection. Here, we present our analysis of the otd intron dot data from female embryos.
Figure 2C shows the measured ηtot (blue circles) and dissected ηint (red squares) and ηext (green diamonds) in otd intron dot number. It also shows the theoretically predicted noise profiles (solid lines) for otd transcription based on our simplified gene regulatory model using the following values derived from fitting the experimental data (see Fig. 2 legend): h=4, v=0.5 and K=15. These results show that, in contrast to hb (Fig. 2A), the external noise in otd transcription dissected from experimental data (green diamonds) is significantly higher than what is theoretically predicted (green line). As discussed above, these results suggest that, in addition to the Bcd input noise, otd transcription is sensitive to other source(s) of input (external) noise missing in our simplified gene regulatory model. Figure 2C further shows that, unlike the hb transcriptional system, theoretically predicted ηtot and ηint also deviate from the measured/dissected values.
To further evaluate the otd transcriptional system, we plot in Figure 2D the dissected ηext against the converted ηext, values calculated by the two different methods for different A–P positions (see above). While dissected ηext is much higher than converted ηext in absolute values, they are correlated with each other. These results suggest that the proposed additional input (external) noise for otd transcription is correlated with Bcd input noise. We currently do not know the exact source of this noise. It is interesting to note that recent studies have revealed a retroactive regulatory mechanism where Bcd, a MAPK substrate, can in turn affect MAPK activity and its availability to other substrates (Kim et al., 2011a, b). It remains to be investigated whether the retroactivity of Bcd on MAPK may represent a potential mechanism that can lead to an ‘amplification’ of the Bcd input noise in term of otd transcription.
4 CONCLUSIONS
Our analysis of the noise properties of transcriptional bursts in response to an activator input provides a useful framework for investigating how developmental decisions are made. An important feature of our statistical model is that it does not require knowledge about, or modeling of, the specific molecular steps leading to such stochastic bursts. The feasibility to capture the actively-transcribing copies of a variety of native genes in early Drosophila embryos (Boettiger and Levine, 2009; Pare et al., 2009; Wilkie et al., 1999) suggests that our model may be of general use in evaluating other transcriptional systems. As shown in our current study, dissection of noise in transcription, coupled with the simultaneous measurement of the activator input noise, can provide critical insights—at a systems level—into whether the activator in hand is a dominant input for a gene's transcription in a native developmental system. Understanding the relationship between the morphogen input and target genes' transcriptional output is crucial to advancing the morphogen concept, a cornerstone of developmental biology (Kerszberg and Wolpert, 2007; Lander, 2007; Wartlick et al., 2009). These results suggest that, consistent with our recent studies (Cheung et al., 2011; He et al., 2008, 2010a, 2010b, 2011; Liu et al., 2011), Bcd is a dominant input for hb expression at the time of our analysis. The observed properties for hb contrast with those of otd, suggesting the contribution of another input(s) for otd transcription. Together, our findings represent an important step toward enhancing our knowledge of morphogen action at a systems level.
Our study also advances our knowledge about transcription at a fundamental level. As discussed recently (Hilfinger and Paulsson, 2011), in dual-reporter studies performed in single cell systems, cell-to-cell differences other than activator concentration differences, e.g. cell cycle stage differences, are also included in the extrinsic component of transcriptional noise. The nuclei in the embryos that we analyzed are nearly synchronous with regard to cell cycle stage. This special property has contributed to our ability to document experimentally, for the first time to our knowledge, that the external noise of a gene's transcription can be explained by the activator input noise.
Supplementary Material
ACKNOWLEDGEMENTS
J.R. performed experiments; F.H., J.R. and W.W. analyzed the data; F.H. and W.W. developed the theoretical methods; F.H. and J.M. interpreted the data and wrote the article; all approved the article. We thank Jingyuan Deng of CCHMC for specific discussions and suggestions, Drs Michael Wagner and Timothy E. Saunders for critical comments on the manuscript, and Dr Bo Zhang of Peking University for supporting J.R. and the work.
Funding: This work was supported in part by grants from National Institutes of Health (GM072812, GM78381 to J.M.) and National Science Foundation (IOS-0843424 to J.M.), an American Heart Association postdoctoral fellowship (10POST4170015 to F.H.), and an exchange student scholarship from the China Scholarship Council (2008601047 to J.R.).
Conflict of Interest: none declared.
REFERENCES
- Boettiger A.N., Levine M. Synchronous and stochastic patterns of gene activation in the Drosophila embryo. Science. 2009;325:471–473. doi: 10.1126/science.1173976. [DOI] [PMC free article] [PubMed] [Google Scholar]
- Cheung D., et al. Scaling of the Bicoid morphogen gradient by a volume-dependent production rate. Development. 2011;138:2741–2749. doi: 10.1242/dev.064402. [DOI] [PMC free article] [PubMed] [Google Scholar]
- Driever W., Nusslein-Volhard C. A gradient of bicoid protein in Drosophila embryos. Cell. 1988;54:83–93. doi: 10.1016/0092-8674(88)90182-1. [DOI] [PubMed] [Google Scholar]
- Eldar A., Elowitz M.B. Functional roles for noise in genetic circuits. Nature. 2010;467:167–173. doi: 10.1038/nature09326. [DOI] [PMC free article] [PubMed] [Google Scholar]
- Elowitz M.B., et al. Stochastic gene expression in a single cell. Science. 2002;297:1183–1186. doi: 10.1126/science.1070919. [DOI] [PubMed] [Google Scholar]
- Ephrussi A., St Johnston D. Seeing is believing: the bicoid morphogen gradient matures. Cell. 2004;116:143–152. doi: 10.1016/s0092-8674(04)00037-6. [DOI] [PubMed] [Google Scholar]
- Erdmann T., et al. Role of spatial averaging in the precision of gene expression patterns. Phys. Rev. Lett. 2009;103:258101. doi: 10.1103/PhysRevLett.103.258101. [DOI] [PubMed] [Google Scholar]
- Friedman N., et al. Linking stochastic dynamics to population distribution: an analytical framework of gene expression. Phys. Rev. Lett. 2006;97:168302. doi: 10.1103/PhysRevLett.97.168302. [DOI] [PubMed] [Google Scholar]
- Gao Q., Finkelstein R. Targeting gene expression to the head: the Drosophila orthodenticle gene is a direct target of the Bicoid morphogen. Development. 1998;125:4185–4193. doi: 10.1242/dev.125.21.4185. [DOI] [PubMed] [Google Scholar]
- Gregor T., et al. Probing the limits to positional information. Cell. 2007;130:153–164. doi: 10.1016/j.cell.2007.05.025. [DOI] [PMC free article] [PubMed] [Google Scholar]
- Grimm O., et al. Modelling the Bicoid gradient. Development. 2010;137:2253–2264. doi: 10.1242/dev.032409. [DOI] [PMC free article] [PubMed] [Google Scholar]
- He F., et al. Probing intrinsic properties of a robust morphogen gradient in Drosophila. Dev. Cell. 2008;15:558–567. doi: 10.1016/j.devcel.2008.09.004. [DOI] [PMC free article] [PubMed] [Google Scholar]
- He F., et al. Shaping a morphogen gradient for positional precision. Biophys. J. 2010a;99:697–707. doi: 10.1016/j.bpj.2010.04.073. [DOI] [PMC free article] [PubMed] [Google Scholar]
- He F., et al. Distance measurements via the morphogen gradient of Bicoid in Drosophila embryos. BMC Dev. Biol. 2010b;10:80. doi: 10.1186/1471-213X-10-80. [DOI] [PMC free article] [PubMed] [Google Scholar]
- He F., et al. A multiscale investigation of bicoid-dependent transcriptional events in Drosophila embryos. PLoS One. 2011;6:e19122. doi: 10.1371/journal.pone.0019122. [DOI] [PMC free article] [PubMed] [Google Scholar]
- Hilfinger A., Paulsson J. Separating intrinsic from extrinsic fluctuations in dynamic biological systems. Proc. Natl Acad. Sci. USA. 2011;108:12167–12172. doi: 10.1073/pnas.1018832108. [DOI] [PMC free article] [PubMed] [Google Scholar]
- Holloway D.M., et al. Gene expression noise in spatial patterning: hunchback promoter structure affects noise amplitude and distribution in Drosophila segmentation. PLoS Comput. Biol. 2011;7:e1001069. doi: 10.1371/journal.pcbi.1001069. [DOI] [PMC free article] [PubMed] [Google Scholar]
- Houchmandzadeh B., et al. Establishment of developmental precision and proportions in the early Drosophila embryo. Nature. 2002;415:798–802. doi: 10.1038/415798a. [DOI] [PubMed] [Google Scholar]
- Kerszberg M., Wolpert L. Specifying positional information in the embryo: looking beyond morphogens. Cell. 2007;130:205–209. doi: 10.1016/j.cell.2007.06.038. [DOI] [PubMed] [Google Scholar]
- Kim Y., et al. Gene regulation by MAPK substrate competition. Dev. Cell. 2011a;20:880–887. doi: 10.1016/j.devcel.2011.05.009. [DOI] [PMC free article] [PubMed] [Google Scholar]
- Kim Y., et al. Substrate-dependent control of MAPK phosphorylation in vivo. Mol. Syst. Biol. 2011b;7:467. doi: 10.1038/msb.2010.121. [DOI] [PMC free article] [PubMed] [Google Scholar]
- Lander A.D. Morpheus unbound: reimagining the morphogen gradient. Cell. 2007;128:245–256. doi: 10.1016/j.cell.2007.01.004. [DOI] [PubMed] [Google Scholar]
- Liu J., Ma J. Fates-shifted is an F-box protein that targets Bicoid for degradation and regulates developmental fate determination in Drosophila embryos. Nat. Cell Biol. 2011;13:22–29. doi: 10.1038/ncb2141. [DOI] [PMC free article] [PubMed] [Google Scholar]
- Liu J., et al. Morphogen gradient formation and action: insights from studying Bicoid protein degradation. Fly (Austin) 2011;5:242–246. doi: 10.4161/fly.5.3.15837. [DOI] [PMC free article] [PubMed] [Google Scholar]
- Lohr U., et al. Antagonistic action of Bicoid and the repressor Capicua determines the spatial limits of Drosophila head gene expression domains. Proc. Natl Acad. Sci. USA. 2009;106:21695–21700. doi: 10.1073/pnas.0910225106. [DOI] [PMC free article] [PubMed] [Google Scholar]
- Ma J. Transcriptional activators and activation mechanisms. Protein Cell. 2011;2:879–888. doi: 10.1007/s13238-011-1101-7. [DOI] [PMC free article] [PubMed] [Google Scholar]
- Martinez Arias,A., Hayward P. Filtering transcriptional noise during development: concepts and mechanisms. Nat. Rev. Genet. 2006;7:34–44. doi: 10.1038/nrg1750. [DOI] [PubMed] [Google Scholar]
- Ochoa-Espinosa A., et al. Anterior-posterior positional information in the absence of a strong Bicoid gradient. Proc. Natl Acad. Sci. USA. 2009;106:3823–3828. doi: 10.1073/pnas.0807878105. [DOI] [PMC free article] [PubMed] [Google Scholar]
- Okabe-Oho Y., et al. Stable, precise, and reproducible patterning of bicoid and hunchback molecules in the early Drosophila embryo. PLoS Comput. Biol. 2009;5:e1000486. doi: 10.1371/journal.pcbi.1000486. [DOI] [PMC free article] [PubMed] [Google Scholar]
- Pare A., et al. Visualization of individual Scr mRNAs during Drosophila embryogenesis yields evidence for transcriptional bursting. Curr. Biol. 2009;19:2037–2042. doi: 10.1016/j.cub.2009.10.028. [DOI] [PMC free article] [PubMed] [Google Scholar]
- Porcher A., Dostatni N. The bicoid morphogen system. Curr. Biol. 2010;20:R249–R254. doi: 10.1016/j.cub.2010.01.026. [DOI] [PubMed] [Google Scholar]
- Porcher A., et al. The time to measure positional information: maternal hunchback is required for the synchrony of the Bicoid transcriptional response at the onset of zygotic transcription. Development. 2010;137:2795–2804. doi: 10.1242/dev.051300. [DOI] [PubMed] [Google Scholar]
- Raj A., et al. Stochastic mRNA synthesis in mammalian cells. PLoS Biol. 2006;4:e309. doi: 10.1371/journal.pbio.0040309. [DOI] [PMC free article] [PubMed] [Google Scholar]
- Raser J.M., O'Shea E.K. Control of stochasticity in eukaryotic gene expression. Science. 2004;304:1811–1814. doi: 10.1126/science.1098641. [DOI] [PMC free article] [PubMed] [Google Scholar]
- Raser J.M., O'Shea E.K. Noise in gene expression: origins, consequences, and control. Science. 2005;309:2010–2013. doi: 10.1126/science.1105891. [DOI] [PMC free article] [PubMed] [Google Scholar]
- Saunders T.E., Howard M. Morphogen profiles can be optimized to buffer against noise. Phys. Rev. E Stat. Nonlin. Soft Matter Phys. 2009;80:041902. doi: 10.1103/PhysRevE.80.041902. [DOI] [PubMed] [Google Scholar]
- Swain P.S., et al. Intrinsic and extrinsic contributions to stochasticity in gene expression. Proc. Natl Acad. Sci. USA. 2002;99:12795–12800. doi: 10.1073/pnas.162041399. [DOI] [PMC free article] [PubMed] [Google Scholar]
- Thattai M., van Oudenaarden A. Intrinsic noise in gene regulatory networks. Proc. Natl Acad. Sci. USA. 2001;98:8614–8619. doi: 10.1073/pnas.151588598. [DOI] [PMC free article] [PubMed] [Google Scholar]
- Tkacik G., et al. The role of input noise in transcriptional regulation. PLoS One. 2008;3:e2774. doi: 10.1371/journal.pone.0002774. [DOI] [PMC free article] [PubMed] [Google Scholar]
- To T.L., Maheshri N. Noise can induce bimodality in positive transcriptional feedback loops without bistability. Science. 2010;327:1142–1145. doi: 10.1126/science.1178962. [DOI] [PubMed] [Google Scholar]
- Tostevin F., et al. Fundamental limits to position determination by concentration gradients. PLoS Comput. Biol. 2007;3:e78. doi: 10.1371/journal.pcbi.0030078. [DOI] [PMC free article] [PubMed] [Google Scholar]
- Wartlick O., et al. Morphogen gradient formation. Cold Spring Harb. Perspect. Biol. 2009;1:a001255. doi: 10.1101/cshperspect.a001255. [DOI] [PMC free article] [PubMed] [Google Scholar]
- Wilkie G.S., et al. Transcribed genes are localized according to chromosomal position within polarized Drosophila embryonic nuclei. Curr. Biol. 1999;9:1263–1266. doi: 10.1016/s0960-9822(99)80509-0. [DOI] [PMC free article] [PubMed] [Google Scholar]
Associated Data
This section collects any data citations, data availability statements, or supplementary materials included in this article.