

Abstract
In the latter half of gestation (20 to 40 gestational weeks), human brain growth accelerates in conjunction with cortical folding and the deceleration of ventricular zone progenitor cell proliferation. These processes are reflected in changes in the volume of respective fetal tissue zones. Thus far, growth trajectories of the fetal tissue zones have been extracted primarily from 2D measurements on histological sections and magnetic resonance imaging (MRI). In this study, the volumes of major fetal zones—cortical plate (CP), subplate and intermediate zone (SP+IZ), germinal matrix (GMAT), deep gray nuclei (DG), and ventricles (VENT)—are calculated from automatic segmentation of motion-corrected, 3D reconstructed MRI. We analyzed 48 T2-weighted MRI scans from 39 normally developing fetuses in utero between 20.57 and 31.14 gestational weeks (GW). The supratentorial volume (STV) increased linearly at a rate of 15.22% per week. The SP+IZ (14.75% per week) and DG (15.56% per week) volumes increased at similar rates. The CP increased at a greater relative rate (18.00% per week), while the VENT (9.18% per week) changed more slowly. Therefore, CP increased as a fraction of STV and the VENT fraction declined. The total GMAT volume slightly increased then decreased after 25 GW. We did not detect volumetric sexual dimorphisms or total hemispheric volume asymmetries, which may emerge later in gestation. Further application of the automated fetal brain segmentation to later gestational ages will bridge the gap between volumetric studies of premature brain development and normal brain development in utero.
Keywords: brain development, magnetic resonance imaging, growth rate, prenatal, cortex, probabilistic atlas
1. Introduction
The latter half of gestation represents a dynamic period of brain maturation that is reflected in substantial growth of transient fetal tissues or zones. Histopathological and 2D magnetic resonance imaging (MRI) studies (e.g. Kostovic et al., 2002; Kinoshita et al., 2001) have demonstrated that fetal zones of the cerebral mantle grow then regress, each making an essential contribution to the mature brain (for review, Bystron et al., 2008). Particularly the cortical plate thickens to a stereotypic depth and increases in surface area exponentially, while ventricular and subventricular zones reach maximum volume before regressing and nearly disappearing (e.g. Jammes and Gilles, 1983). Developing volumetric trajectories for the whole brain and each fetal zone during this period of rapid cerebral expansion will illuminate how the composition of the brain changes as it matures. Tissue growth has been characterized in premature brains generally from 30 to 40 GW (Huppi et al., 1998; Kuklisova-Murgasova et al., 2010). However, growth trajectories generated from these postnatal subjects inherently represent an atypical developmental course. In utero imaging is better suited for the direct study of normal gestational developmentto.
In utero MRI and ultrasonography studies have successfully measured total brain volume over broad gestational ages to develop meaningful normal global growth trajectories (Baker et al., 1995; Gong et al., 1998; Chang et al., 2003; Roelfsema et al., 2004; Grossman et al., 2006; Kazan-Tannus et al., 2007; Limperopoulos et al., 2010). The general growth patterns of the fetal zones and regional volumes have been characterized in past in utero imaging studies (Fogliarini et al., 2005; Prayer et al., 2006; Perkins et al., 2008; Hu et al., 2009), though these reports were either qualitative descriptions or the quantitative analyses had methodological limitations that prevented simultaneous and automated 3D measurement of multiple zones of the cerebral mantle in a single brain. Postmortem imaging studies have thus far provided the most comprehensive regional volumetric growth trajectories, but are limited in age range and sample size (Kinoshita et al., 2001; Huang et al., 2009). Kinoshita et al. (2001) measured total brain, germinal matrix, and ventricular volumes from MRI of 13 postmortem fetal brains from 7 to 28 post-menstrual weeks (GW). Another diffusion tensor and structural imaging study of 15 postmortem fetal brains from 13 to 21 GW measured the volume of the whole brain, cortical plate and subplate, ventricles, ganglionic eminence, and deep gray nuclei (Huang et al., 2009). Thus our quantitative understanding of fetal brain growth is assembled from various studies with different populations and analysed with different techniques. Tissue segmentation of MR images acquired in utero from normally developing brains would provide a more definitive picture of regional growth patterns on a macroscopic scale.
To this end, we have acquired orthogonal stacks of 2D T2-weighted (T2w) MRI that are subsequently reconstructed into isotropic 3D images (Kim et al., 2010a). We have developed a spatiotemporal probabilistic atlas of the fetal brain that defines the evolving presence and MRI appearance of the cortical plate (CP), subplate and intermediate zone (SP+IZ), germinal matrix (GMAT, ventricular and subventricular zones), deep gray nuclei (DG, basal ganglia and thalamus), and ventricles (VENT, lateral and third ventricles) (Habas et al., 2010a). We applied this atlas-based tissue segmentation to brain MR images of 48 fetuses ranging in age from approximately 20 to 31 GW. From these automatic segmentations, we report volumetric trajectories for the supratentorial part of the brain and fetal tissue zones. Then, we discuss the growth trajectories of each zone in the context of cerebral development.
2. Materials and Methods
2.1 Subjects and fetal image acquisition
Data used in the present paper was acquired from an imaging study that was approved by our local Institutional Review Board and complies with NIH human subject guidelines. Exclusion criteria were alpha-fetoprotein >2.5 MoM with amniocentesis, fetal chromosomal abnormality, prenatally or postnatally diagnosed genetic abnormality, prenatally or postnatally diagnosed congenital infection, fetal exposure to class C, D, or X drugs, fetal exposure to anesthesia, multiple gestation pregnancy, maternal psychiatric disorder, maternal cardiac disease, maternal cardiac arrhythmia, uncontrolled maternal hypertension, and uncontrolled maternal diabetes. Follow-up exclusion criteria included premature delivery (earlier than 36 GW) or clinical neurological problems. Mothers provided informed consent for use of fetal scans for research purposes. The mothers were referred for fetal MRI either to better assess questionable findings on prenatal ultrasound (n=8) or a prior abnormal pregnancy (n=10) or volunteered for the study (n=21) (Table 1). Mothers enrolled in the studies ranged in age from 19–41 years (mean, 34 yr). Mean age did not differ between maternal volunteers and patients (T=0.5, p=0.62). Maternal age did not correlate with gestational age at MRI (R2=0.0033, p=0.7). Of the study scans that met image acquisition criteria for image analysis [TR=3000–9000 ms; slice thickness=3 mm; sufficient number stacks; fetal motion less than 15 mm translation and 30 degrees of rotation between slices], we selected 48 clinical scans of 39 fetuses (19 male, 20 female) at gestational ages ranging from 20.57 to 31.14 GW, estimated by last menstrual period (Fig. 1). Remaining scans were excluded for inadequate reconstruction quality (n=6).
Table 1.
Study Demographics
| Maternal Participant | Number of Participants (scans) | Maternal Age (years) | Fetal Age at MRI (post-menstrual weeks) | Fetal Age at Delivery (post-menstrual weeks) |
|---|---|---|---|---|
| Total | 39 (48) | 29–41 | 20–31 | 37–42 |
| Volunteer | 21 (28) | 23–41 | 20–31 | 37–42 |
| Abnormal Ultrasound | 10 (12) | 29–39 | 21–30 | 38–42 |
| Prior Abnormal Pregnancy | 8 (8) | 19–39 | 21–24 | 38–41 |
Figure 1.
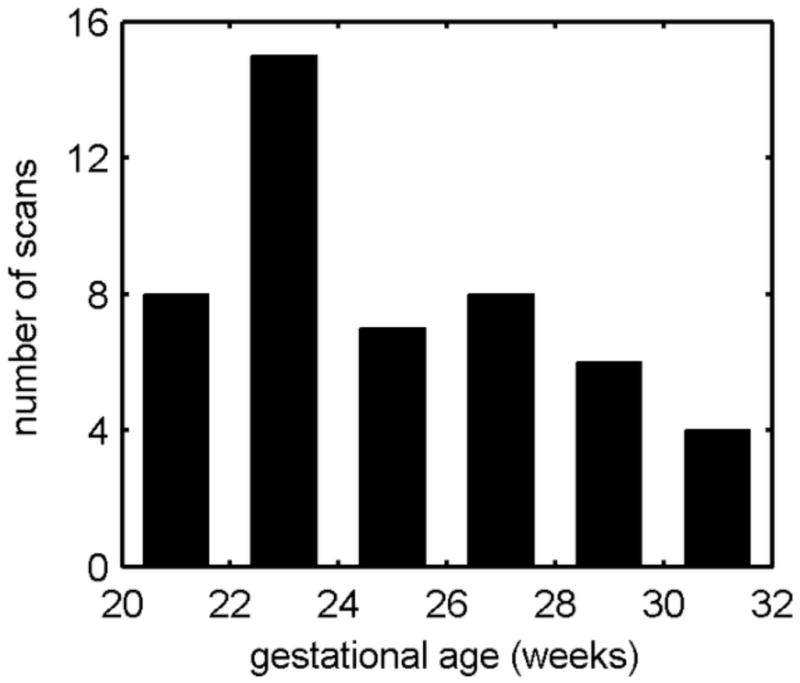
Histogram of the age distribution of fetal MR scans. All 2 week periods include at least 4 scans. Gestational age is calculated from last menstrual period.
All of the fetal MRI used in this study were read as normal by a fetal neuroradiologist (O.A.G.). Neither the mother or fetus were sedated and the mother was free-breathing for the scan session of 20 to 45 minutes. Clinical MR imaging was performed on a 1.5T scanner (GE Healthcare, Milwaukee, WI) using an eight-channel torso phased-array coil. Multiple stacks of single-shot fast spin-echo (SSFSE) T2w slice images (in-plane pixel size: approximately 0.5 mm × 0.5 mm; slice thickness: 3 mm, no gap) were planned in the approximately axial, sagittal and coronal planes with respect to the fetal brain. All slice images were acquired in an interleaved manner to reduce saturation of spins in adjacent slices. The MR sequence parameters (TR=3000–9000ms; TE=91ms) were originally designed for clinical scans and were not adjusted for tissue segmentation in this study. From these clinical acquisitions, one to four stacks were selected in each plane for 3D image reconstruction. To account and correct for spontaneous fetal movement during scanning, all image slices in the slice stacks of a subject were registered using the slice intersection motion correction (SIMC) technique (Kim et al., 2010a) and reconstructed into 3D volumes with isotropic voxel dimensions of 0.5 mm.
2.2 Anatomical definitions of tissue labels
The probabilistic tissue label atlas was generated from manual segmentations of 34 subjects (J.A.S.), which were then verified by a neuroradiologist (O.A.G.) with expertise in fetal brain anatomy. The supratentorial volume (STV) included the entire cerebrum (telencephalon and diencephalon) and excluded midbrain, brainstem and cerebellum. The STV was then manually segmented into 5 tissue classes: CP, SP+IZ, GMAT, DG, and VENT (Fig. 2). The protocols for manual segmentation were developed with reference to published histological and MRI fetal brain atlases (Bayer and Altman, 2005; Griffiths et al., 2010) and a comparative histological and T1-weighted MRI review (Kostovic and Vasung, 2009). Manual segmentation was primarily carried out in the axial plane in the superior to inferior direction. The orthogonal planes were simultaneously consulted to improve delineations. Boundaries were determined based on T2w MRI intensity contrast and landmarks. Generally, the CP and GMAT were hypointense and the VENT was hyperintense. The intensities of the SP+IZ, and DG were of intermediate signal intensity.
Figure 2.
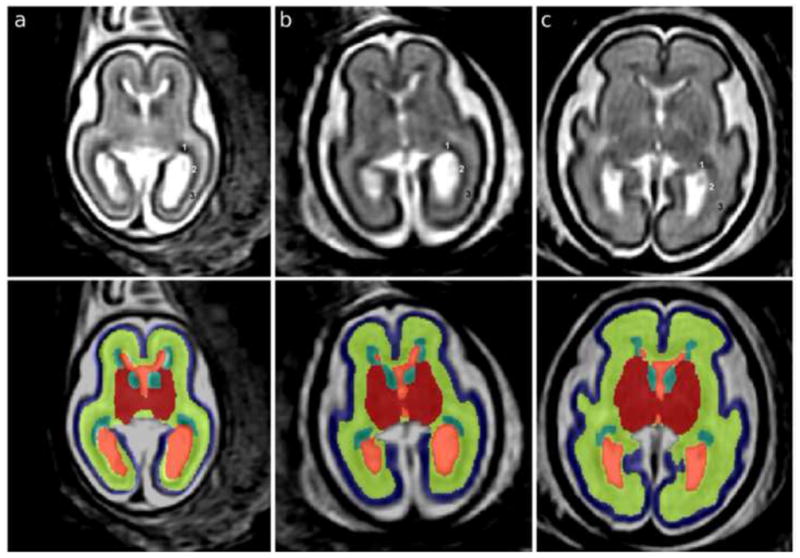
T2w MRI axial sections in native orientation of fetal brains at (a) 21.00, (b) 23.71 and (c) 27.86 gestational weeks (GW) are shown in the top panel. In the occipital lobe, the germinal matrix (GMAT, 1) rapidly thins in the posterior direction and the outer subventricular zone (OSVZ, 2) becomes more cell dense. The GMAT, OSVZ, and subplate (3) are therefore labeled in the top panel to show that the hypointense part around the occipital horn is OSVZ rather than GMAT. In the bottom panel, automated segmentations are overlaid on axial sections: blue, cortical plate (CP); yellow, subplate, intermediate zone and outer subventricular zone (SP+IZ); turquoise, ventricular zone, inner subventricular zone and ganglionic eminence (GMAT); red, deep gray nuclei (DG); orange, lateral and third ventricles (VENT).
The CP is cell dense and therefore hypointense in the MR image. The CP is a continuous sheet along the medial and lateral surfaces of the STV and is surrounded by CSF superficially. Along the ventromedial aspect, the CP terminates at the hippocampal fissure, which extends the entire length of the hippocampus (Fig. 2). The deep boundary of the CP is shared with the subplate, which is parallel to the superficial boundary.
The T2w intensities of the subplate (SP), intermediate zone (IZ), and outer subventricular zone (OSVZ) converge during our period of study (Corbett-Detig et al., 2011) and therefore are collectively labeled as one (SP+IZ) though they are functionally distinct fetal zones. The SP is relatively cell sparse and contains much extracellular matrix, making it hyperintense relative to the CP (Kostovic and Vasung, 2009; Widjaja et al., 2010). The SP is subjacent to the extent of the CP and therefore shares a boundary with the deep CP. The IZ is the region of migrating postmitotic cells and developing white matter (Bystron et al., 2008). The boundary between the IZ and OSVZ is not distinct on T2w MR images, so it is included within the SP+IZ label. The amygdala is included in the SP+IZ tissue label since there was not sufficient contrast to delineate this structure. The deep boundary of the SP+IZ is formed by the inner subventricular zone (ISVZ) of the GMAT, which is relatively hypointense. There is sufficient contrast between these tissues in all areas of the frontal, parietal, and temporal lobes, but not consistently in the occipital lobe where the GMAT is also very thin and therefore additionally subject to partial volume effects with the OSVZ and VENT (Fig. 2, top panel). Therefore in the occipital lobe, the deep SP+IZ boundary is formed by the hyperintense VENT. In the insular region, the IZ and OSVZ do not visibly extend along the lateral boundary of the DG. Therefore, the boundary here is between SP and external capsule (the lateral boundary of the DG label). The medial SP+IZ boundary changes in the anterior to posterior direction. In the frontal and parietal lobes, the IZ joins across the hemispheres via the corpus callosum. Anterior (frontal pole) and posterior (occipital lobe) to the corpus callosum, the SP+IZ medial superficial boundary is completely shared with the deep boundary of the CP within each hemisphere.
The DG include striatum, globus pallidus, basal forebrain, thalamus, and hypothalamus, as well the traversing internal capsule fibers, which we collectively refer to as the deep gray nuclei. The DG is situated ventral to the VENT for the approximate length of the corpus callosum and extend to the STV boundary with midbrain. The DG is positioned adjacent to GMAT (hypointense) and VENT (hyperintense), which form the medial border anterior to the thalamus (Fig. 2). The right and left thalami are joined at the midline (at the interthalamic adhesion); posteriorly, extracerebral CSF is present between the thalami. The lateral boundary of the DG is formed by the external capsule fiber tract, which is the boundary shared with the SP. This boundary is approximately parallel with the insular cortical plate. The ventral extent of the DG is the hypothalamus, which is surrounded by CSF.
GMAT, or germinal matrix, includes the ganglionic eminence, ventricular zone, and ISVZ, and has a very low intensity that is similar to the intensity of other cell-dense regions, such as the CP (Fig. 2). The GMAT is indistinguishable from the cell-dense region of OSVZ in areas where the GMAT is thin, such as the dorsal and medial aspects of lateral ventricle and occipital horn (Bayer and Altman, 2005). For this reason, only the GMAT about the frontal horns, temporal horns and body of the VENT are included in the segmentation. The superficial boundary is the inner fiber layer, which appears as a hyperintense band around the perimeter of the ISVZ of the cerebral mantle. The superficial boundary of the ganglionic eminence is the caudate nucleus of the DG region. When the brain is aligned along the commisural axis, the posterior boundary of the GMAT is near the superior colliculi.
The VENT tissue label included the lateral and third ventricles. VENT is hyperintense to all surrounding tissues and is the deepest structure and therefore shares its boundaries with OSVZ, DG, and GMAT. Posterior to the third ventricle, the VENT bifurcates to form the occipital horns and the non-ventricular CSF is excluded.
2.3 Automatic tissue segmentation
Based on manual segmentations of the 34 subjects, a spatiotemporal atlas of tissue distribution and MR appearance of the fetal brain was formed using a previously presented framework (Habas et al., 2010a). The tissue segmentation priors were formed into both an atlas from the original images then as a symmetric atlas by duplicating and reflecting image pairs (Rajagopalan et al., 2011), to allow for an explicit evaluation of hemispheric asymmetries. From this continuous model of the fetal brain growth, an age-specific MR intensity template and an age-specific tissue probability map were generated for each study subject. After the subject’s MRI was registered to the age-specific MR template, the corresponding tissue probability map was used as a source of spatial priors for automatic tissue segmentation of the registered subject MRI (Habas et al., 2010b). Typical segmentation results for subjects with different gestational ages are shown in the bottom panel of Figure 2.
For quantitative validation, the automatic tissue segmentations were evaluated in terms of a Dice similarity coefficient (DSC) measuring the overlap between the manual and automatic segmentation of each tissue label for the 34 subjects used to generate the atlas. All tissue labels had average DSC agreement of 0.8 or better: CP, 0.90 (+/−0.03); SP+IZ, 0.95 (+/−0.01); DG, 0.89 (+/−0.03); GMAT, 0.81 (+/−0.03); and VENT, 0.91 (+/−0.03).
2.3 Volumetric analysis
Based on the results of automatic segmentation using a symmetric prior, tissue volumes were measured in the native space of each subject (Fig. 2). For regional analysis, regions of interest (ROIs) were defined in the space of the spatiotemporal atlas on an average brain image. The right and left hemispheres were separated by the longitudinal fissure (Fig. 3a). Then the frontal lobe was delineated by the central sulcus and the Sylvian fissure (Fig. 3b). These boundaries were clearly visible on the average brain, on which the masks were defined. The masks were non-linearly warped to each individual subject and used to analyze potential regional differences in growth rates in the STV, CP and SP+IZ.
Figure 3.
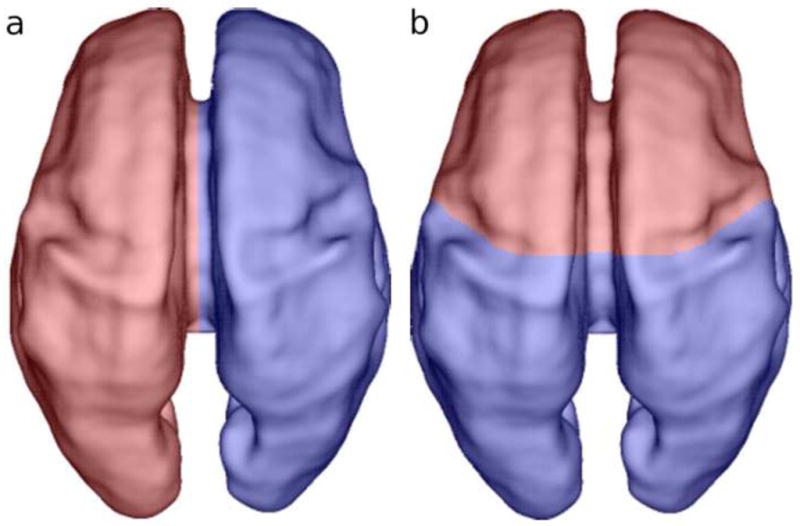
Dorsal view of the (a) right (red) and left (blue) hemispheric and (b) frontal (red) and non-frontal (blue) regional masks overlaid on a rendering of the inner CP surface of a single subject at 27.86 GW.
2.4 Statistical analysis
Global patterns of brain tissue growth were established by fitting of temporal linear, quadratic, and exponential models to age-specific volumes of each tissue label, VENT and STV. In our study population, the age distribution for male subjects was younger than for females. Therefore to test for global sexual dimorphisms in volume and growth rate, subjects in the overlapping age range (21.57 to 29.86 GW) were used in the regression analyses (males=19, females=21). For further analysis, subjects’ STV, CP, and SP+IZ labels in each ROI (frontal, non-frontal, left and right hemispheres) were normalized by the group-average volume of this ROI. Regional growth rates were then calculated by fitting of temporal linear models to age-specific relative volumes of each tissue as well as the entire STV.
3. Results
The volumetric growth trajectories are presented first in absolute volumes, then the relative to average volume growth rate, followed by tissue composition changes for the STV. These results are summarized in Table 2. Lastly, frontal and non-frontal regional volumes are compared for the CP and SP+IZ. Age-matched male and female brains did not differ in volume or rate of growth for the STV (p=0.999) or any other structure (p>0.05), so all results are presented for the entire group of subjects.
Table 2.
Temporal models of brain tissue growth.
| STV | CP | SP+IZ | DG | GMAT | VENT | |
|---|---|---|---|---|---|---|
| Linear (y=b+ax) | ||||||
| R2† | 0.95 | 0.94 | 0.95 | 0.96 | — | 0.53 |
| Constant (b) (cm3) | −259.8473 | −115.3931 | −127.2964 | −15.1449 | — | −5.6391 |
| Absolute growth rate‡ (a) (cm3/wk) | 13.9555 | 5.8766 | 6.9138 | 0.8070 | — | 0.3945 |
| Relative growth rate∫ (%/wk) | 15.22 | 18.00 | 14.75 | 15.56 | — | 9.18 |
|
| ||||||
| Quadratic (y=b+ax+cx2) | ||||||
| R2† | 0.96 | 0.97 | 0.95 | 0.98 | 0.32 | 0.53 |
| Constant (b) (cm3) | 34.3612 | 138.5454 | −103.9025 | 15.5028 | −10.4941 | −5.2904 |
| Linear coefficient (a) (cm3/wk) | −9.1867 | −14.0980 | 5.0737 | −1.6037 | 1.0742 | 0.3671 |
| Quadratic coefficient (c) (cm3/wk2) | 0.4483 | 0.3869 | 0.0356 | 0.0467 | −0.0215 | 0.0005 |
| Absolute growth rate‡ (a+2cx) (cm3/wk) | ||||||
| at 22 GW (cm3/wk) | 10.54 | 2.93 | 6.64 | 0.45 | 0.13 | 0.39 |
| at 26 GW (cm3/wk) | 14.12 | 6.02 | 6.93 | 0.82 | −0.04 | 0.40 |
| at 30 GW (cm3/wk) | 17.71 | 9.12 | 7.21 | 1.20 | −0.22 | 0.40 |
|
| ||||||
| Exponential (y=m*enx) | ||||||
| R2† | 0.96 | 0.97 | 0.93 | 0.98 | — | 0.53 |
| Linear coefficient (m) (cm3/wk) | 1.8131 | 0.3267 | 0.9499 | 0.1033 | — | 0.4400 |
| Exponential coefficient (n) (wk−1) | 0.1512 | 0.1766 | 0.1503 | 0.1509 | — | 0.0877 |
| Absolute growth rate‡ (m*n*enx) (cm3/wk) | ||||||
| at 22 GW (cm3/wk) | 7.63 | 2.81 | 3.89 | 0.43 | — | 0.27 |
| at 26 GW (cm3/wk) | 13.97 | 5.68 | 7.10 | 0.79 | — | 0.38 |
| at 30 GW (cm3/wk) | 25.59 | 11.52 | 12.95 | 1.44 | — | 0.54 |
Goodness of fit for model growth trajectories of each tissue zone
Absolute volume gained per week for each tissue zone
Percent volume gain relative to the average volume for each tissue zone
The supratentorial brain volume increased over 4-fold from 20 to 31 GW and the relative rate of growth of the tissue zones differed. Significant linear growth was found for the CP, SP+IZ, DG, and VENT tissue zones (p<0.0001) (Fig. 4). The goodness of fit was similar for exponential curves of STV, CP, and DG volumes compared to the linear fit, indicating an accelerating growth rate over this period (Table 2). In contrast to these continually expanding tissue zones, the GMAT volume trajectory was successfully modeled only by a quadratic growth curve (Table 2, Fig. 4). The estimated volume rose from 2.58 cm3 at 21 GW to reach 2.91 cm3 at 24.96 GW. The volume then decreased, exceeding the volume gain, and is estimated to be 2.13 cm3 at 31 GW.
Figure 4.
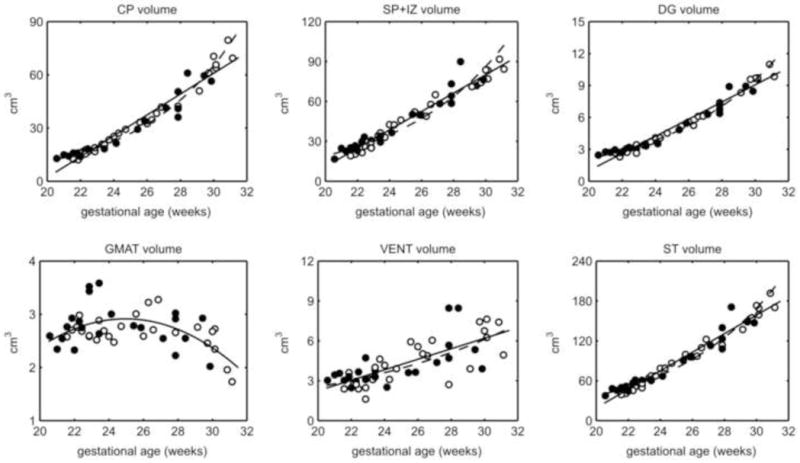
Volume plots for each tissue label (CP, SP+IZ, DG, and VENT) and the total supratentorial tissue (ST) with best fit curves (linear, solid line; exponential, dashed line) and quadratic curve fit to the GMAT (solid line). All tissues and VENT showed absolute volume gains except GMAT, which decreased after 25 GW. Male (closed circle) and female (open circle) volumes did not differ. VENT volume had the greatest inter-subject variance.
The tissue growth rate relative to the average volume of each region varied by tissue zone. The SP+IZ and DG tissues increased at similar relative rates of approximately 15% per week (Table 2). The relative growth rate of the CP was slightly higher, while the relative volume gains of the VENT were lower (Table 2).
On average, the SP+IZ made up the greatest part of the STV (51% +/− 2%), followed by the CP (34% +/− 3%), DG (6% +/− 0.39%), VENT (5% +/−1%), and GMAT (4% +/− 2%). As expected from variable relative growth rates, there were age-related changes in the ratio of some tissue zones to the STV. The ratio of CP to STV significantly increased with age, from approximately 31% to 40% of STV (p<0.001) (Fig. 5). Both SP+IZ (p=0.64) and DG (p=0.87) fractions of the STV did not significantly change from 20 to 31 GW (Fig. 5). The VENT fraction dropped from approximately 7% to 3.5% (p<0.001) (Fig. 5). Similarly the ratio of GMAT to STV significantly decreased and represented approximately 1% of total tissue volume by 31 GW (p<0.001) (Fig. 5).
Figure 5.
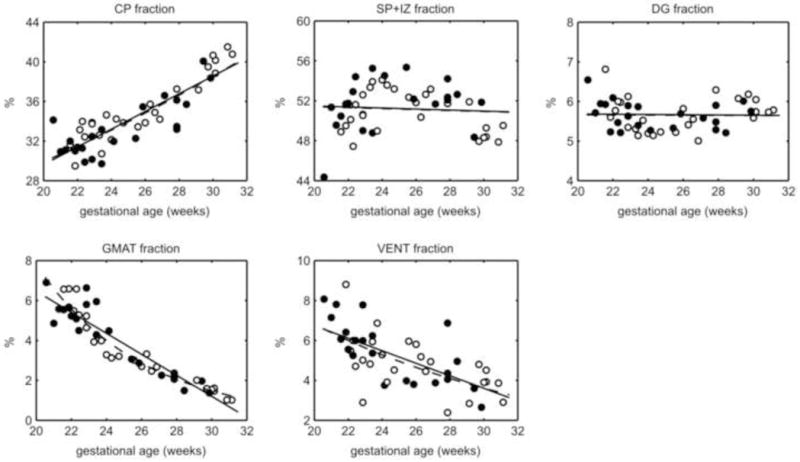
Ratio of each tissue zone to ST volume and best fit curves (linear, solid line; exponential, dashed line). SP+IZ make up the largest part of the ST. The CP fraction increased with age, while SP+IZ and DG did not change. The GMAT and VENT fractions decreased over time. Male, closed circle; female, open circle.
The total hemispheric volumes and growth rates did not differ in the studied age range (p>0.05). This was tested using automated segmentations driven by both symmetric and native atlas priors to confirm the finding. Therefore we compared bilateral frontal and non-frontal regions. We found that the STV, CP, and SP+IZ growth rates did not significantly differ in the frontal and non-frontal regions (p>0.05). However, the frontal STV and SP+IZ growth rates were slightly greater than the non-frontal regions (by nearly 0.1%, data not shown).
4. Discussion
In this study, we have presented the first 3D in utero MR volumetry from a unique dataset of 48 of normal human fetal brains. The automated segmentation of major fetal tissue zones provided reliable and unbiased growth trajectories of all tissues that can be clearly defined on T2w MRI in the fetal brain from 20 to 31 GW, the gestational period when fetal brain abnormalities are typically examined on MRI (Glenn and Barkovich, 2006). Over this fetal age range, we showed that STV is beginning to increase exponentially and that the CP growth is faster than all other tissue zones (Table 2), which has not been been directly demonstrated previously in utero. While all other tissue zones show consistent gains, the GMAT volume peaks at 25 GW, then begins to regress. The greater volume range at the later gestation weeks (27 to 31 GW) suggests that individual variation in brain volume will become greater with age, as shown in studies of brain weight from the fetal period to term (Guihard-Costa and Larroche, 1992). We have also shown that total hemispheric volume asymmetries and global volumetric sexual dimorphisms have not yet emerged in the second trimester; though these are shown to be present late in the third trimester (Vasileiadis et al., 2009) and at term (Gilmore et al., 2007).
Differing from most other imaging studies of the fetal brain, we measured STV, which excludes the midbrain, cerebellum and brainstem, rather than total brain volume. Therefore we cannot make direct comparison with growth rates from most 2D in utero MR studies (Baker et al., 1995; Gong et al., 1998; Garden and Roberts, 1996). Curiously, total brain volume at 30 GW reported across these studies shows great variability, ranging from roughly 185 cm3 to 287 cm3 (Baker et al., 1995; Gong et al., 1998; Garden and Roberts, 1996), which is generally greater than the range of supratentorial volumes in our study between 29 and 31 GW (137 cm3 to 192 cm3). The variability in estimated absolute volume may be due to differences in slice thickness, volume estimation methods, accuracy in gestational age, or increased variance in the size of infratentorial structures.
The STV growth trajectories derived from our analyses are in general agreement with other MRI studies of overlapping fetal age. A 2D MRI study from 17 to 36 GW observed a similar relative ST growth rate (15.8%/wk) (Kazan-Tannus et al., 2007) compared to our study (15.22%/wk). Despite this similarity there may be other cohort or methodological differences, since the volumes were clearly smaller in the previous study (79 cm3 at approximately 27 GW) and fetal brains with ventriculomegaly were included (8 controls, 42 patients). A comparable study by Grossman et al. (2006) measured STV (parenchymal volume) from 25 to 40 GW and found a greater absolute weekly growth rate (21 cm3/wk) than the constant linear rate reported here (13.5 cm3/wk). However, the absolute growth rates calculated for 28 to 30 GW from our exponential trajectory are approaching the rate from this earlier study of third trimester brain growth. Since absolute volumes at equivalent ages were very similar (approximately 150 cm3 at 30 GW), we anticipate that, if we extend our age range, the growth trajectories that we have calculated would be in agreement with the estimates of Grossman and colleagues (2006). It is therefore important that future MRI studies of fetal and premature brain volume test linear as well as non-linear temporal models of growth. Acceleration in brain growth at this stage of development is also well document by increasing growth velocity in brain weight late into the third trimester of gestation (McLennan et al., 1983; Guihard-Costa and Larroche, 1992).
The growth trajectories of fetal brain tissue zones were in agreement with the known maturational processes occurring at fetal and early preterm phases of cerebral development. We showed that the ratio of CP to STV increased from 20 to 31 GW, which suggests an acceleration in cortical development. Other morphometric evidence of accelerating cortical growth comes from gyrification index, local growth patterns, and surface area measurements (Jammes and Gilles, 1983; Armstrong et al., 1995; Zhang et al., 2010; Rajagopalan et al., 2011). Expansion of the CP and SP+IZ illustrate the effect of the increasing thalamocortical and cortico-cortical afferents reaching the subplate and cortical plate (Kostovic and Judas, 2010), the migration of postmitotic cells to the CP (Sidman and Rakic, 1973), and development of cortical cytoarchitecture (areal, laminar, cytological differentiation) (Chan et al., 2002). Though volumetric analysis of current in utero imaging cannot distinguish these processes, more localized shape analysis of T2w MRI, such as cortical thickness, and analysis of diffusion tensor images (DTI) may correlate more specifically (e.g. Huang et al., 2009; Widjaja et al., 2010).
As in postmortem studies of GMAT volume (Jammes and Gilles, 1983; Kinoshita et al., 2001), we found that the GMAT volume peaked prior to 25 GW, then showed a marked decrease. That volume reduction would be expected to continue after 31 GW until the ventricular and inner ventricular zones disappear in the early postnatal period (Sidman and Rakic, 1973). The reduction in volume likely reflects a decrease in proliferation in the ventricular and inner subventricular zones that is paired with postmitotic cell migration to the subplate and cortical plate (Kriegstein and Noctor, 2004). Studies in gyrencephalic animal models and humans, show that the outer subventricular zone (included in the SP+IZ volume) increases in the intermediate radial glia cell population while the ventricular zone cell population declines (Lukaszewicz et al., 2005; Hansen et al., 2010; Riello et al., 2010). The coincident regression of the primary progenitor tissue zone and cerebral expansion suggests that the proliferative source for expansion in later gestation may be the outer subventricular zone, a hypothesis put forth by some authors (Riello et al., 2010; Martinez-Cerdeno et al., 2006). Since most investigation of neurogenic activity in non-human primates and humans focuses on the first half of gestation (e.g. Lukaszewicz et al., 2005; Hansen et al., 2010), there is limited direct histological evidence characterizing the contribution by the outer subventricular zone through the equivalent developmental period studied here (20 to 31 GW).
The expansion of the VENT occurs, for the most part, prior to 20 GW (Kinoshita et al., 2001; Jammes and Gilles, 1983). So the reduced ratio of VENT to STV was expected in the late fetal and preterm phases of gestation. We found similar ventricular volume and ratio to STV as in the control group of Kazan-Tannus et al. (2007), but demonstrated a greater relative growth rate (10% v. 4%). Despite this, both studies show that ventricular volume is increasing slightly during midgestation at a rate much slower than overall cerebral growth. On the other hand, all our ventricular measurements were larger than what was reported in Grossman et al. (2006), which did not find any increase in ventricular volume from 25 to 40 GW. This discrepancy may be attributable to differences in the age range studied since lateral ventricle volume has been shown to peak between 20 and 25 GW (Kinoshita et al., 2001).
Though postnatal studies show lobar variation in cortical and white matter growth (e.g. Knickmeyer et al., 2008), we found uniform growth rates in the frontal and non-frontal lobes. This suggests that differential growth patterns may be protracted to periods of development after the emergence of all primary sulci around 28 GW (Garel et al., 2003), which are associated with thalamocortical and cortico-cortical connectivity maturational patterns (Hilgetag and Barbas, 2006), or even later. In a manual volumetric study of 2D in utero fetal brain MRI, Hu et al. (2009) showed that the absolute growth rate of frontal and parieto-temporal regions was greater than occipital and prefrontal regions from 21 to 37 GW. These differences in absolute growth rates may be due to the larger volumes of the frontal and parieto-temporal regions, which were approximately twice the volume of the other regions at 21 GW. A more comparable metric would be the relative growth rate of each region, which normalizes the volumes and was used in our study.
We have successfully segmented the brain into the major fetal tissue zones that are reliably distinguishable on T2w MRI. The cerebral mantle actually has six fetal zones and the deep gray nuclei have several mature and distinct structures (Bayer and Altman, 2005). For example, the subplate is known to increase in thickness and complexity until 32 post-conceptual weeks (34 GW), but the MR contrast declines as the fiber density increases (Kostovic and Vasung, 2009). In an another study using this dataset of fetal brain images, we measured subplate volume by manual segmentation from 20 to 26 GW, after which contrast is lost between subplate and intermediate zone on T2w MRI (Corbett-Detig et al., 2011); therefore we could not fully incorporate this tissue zone into the segmentation atlas driven by T2w MR contrast alone. T2w intensity contrast is also insufficient to reliably delineate deep gray structures at this stage of fetal brain development, since unmyelinated fiber tracts separate them. Reconstruction and analysis methods for in utero DTI are under development (Kim et al., 2010b; Oubel et al., 2010) and may facilitate segmentation of the brain in regions with low T2w intensity contrast but distinct fiber orientation, such as deep gray structures and subplate (Maas et al., 2004).
Analysis of tissue volume during the second trimester may help identify fetuses with specific types of diminished growth of one or more major zones that should be closely monitored. Identification of abnormal patterns of brain tissue growth is important, since this can be correlated with later cognitive outcome (Huppi, 2010). Future developments will include the application of our automatic tissue segmentation to clinical scans with diagnosed abnormalities, such as ventriculomegaly, to describe how brain volume deviates regionally in altered development (e.g. Kazan-Tannus et al., 2007; Limperopoulos et al., 2010). Further application of our atlas-based tissue segmentation to in utero imaging later in the third trimester may improve the understanding for normal fetal brain development by comparison to imaging studies of premature brains (Huppi et al., 1998).
Research Highlights.
Human fetal brain tissue volumes are automatically estimated from in utero 3D MRI
Total cerebral and cortical plate growth accelerates between 20 and 30 GW
Brain sexual dimorphisms and hemispheric asymmetries are not present by 30 GW
Acknowledgments
This research was funded by the National Institutes of Health through the National Institute of Neurological Disorders and Stroke (R01 NS 061957 and R01 NS 055064); National Center for Research Resources to UCSF-CTSI (UL1 RR024131); and award to O.A.G. (K23 NS52506-03). This research was also funded by the European Research Council under the European Community Seventh Framework Programme (FP7/2007- 2013 Grant Agreement 207667). We thank Jan Lui and Arnold Kreigstien for consultation on fetal brain anatomy. We thank participating mothers who have made this research possible.
Abbreviations
- CP
cortical plate
- DG
deep gray nuclei
- GMAT
germinal matrix
- GW
gestational weeks
- MRI
magnetic resonance imaging
- SP+IZ
subplate and intermediate zone
- STV
supratentorial brain volume
- T2w
T2-weighted
- VENT
lateral and third ventricles
Footnotes
Publisher's Disclaimer: This is a PDF file of an unedited manuscript that has been accepted for publication. As a service to our customers we are providing this early version of the manuscript. The manuscript will undergo copyediting, typesetting, and review of the resulting proof before it is published in its final citable form. Please note that during the production process errors may be discovered which could affect the content, and all legal disclaimers that apply to the journal pertain.
References
- Armstrong E, Schleicher A, Omran H, Curtis M, Zilles K. The ontogeny of human gyrification. Cereb Cortex. 1995;5:56–63. doi: 10.1093/cercor/5.1.56. [DOI] [PubMed] [Google Scholar]
- Baker PN, Johnson IR, Gowland PA, Hykin J, Adams V, Mansfield P, Worthington BS. Measurement of fetal liver, brain and placental volumes with echo-planar Magnetic Resonance Imaging. Br J Obstet Gynaecol. 1995;102:35–39. doi: 10.1111/j.1471-0528.1995.tb09023.x. [DOI] [PubMed] [Google Scholar]
- Bayer SA, Altman J. The human brain during the second trimester (Atlas of the human central nervous system development) CRC Press; New York: 2005. [Google Scholar]
- Bystron I, Blakemore C, Rakic P. Development of the human cerebral cortex: boulder committee revisited. Nat Rev Neurosci. 2008;9:110–122. doi: 10.1038/nrn2252. [DOI] [PubMed] [Google Scholar]
- Chan W, Kostovic I, Takashima S, Feldhaus C, Stoltenburg-Didinger G, Verney C, Yew D, Ulfig N. Normal and abnormal development of the human cerebral cortex. Neuroembryology. 2002;1:78–90. [Google Scholar]
- Chang C, Yu C, Chang F, Ko H, Chen H. The assessment of normal fetal brain volume by 3-D ultrasound. Ultrasound Med Biol. 2003;29:1267–1272. doi: 10.1016/s0301-5629(03)00989-x. [DOI] [PubMed] [Google Scholar]
- Corbett-Detig J, Habas P, Scott J, Kim K, Rajagopalan V, McQuillen P, Barkovich A, Glenn O, Studholme C. 3-D global and regional patterns of human fetal subplate growth determined in utero. Brain Struct Funct. 2010;215:255–263. doi: 10.1007/s00429-010-0286-5. [DOI] [PMC free article] [PubMed] [Google Scholar]
- Fogliarini C, Chaumoitre K, Chapon F, Fernandez C, Lévrier O, Figarella-Branger D, Girard N. Assessment of cortical maturation with prenatal MRI. Part I: Normal cortical maturation. Eur Radiol. 2005;15:1671–1685. doi: 10.1007/s00330-005-2782-1. [DOI] [PubMed] [Google Scholar]
- Garden AS, Roberts N. Fetal and fetal organ volume estimations with Magnetic Resonance Imaging. Am J Obstet Gynecol. 1996;175:442–448. doi: 10.1016/s0002-9378(96)70159-x. [DOI] [PubMed] [Google Scholar]
- Garel C, Chantrel E, Elmaleh M, Brisse H, Sebag G. Fetal MRI: Normal gestational landmarks for cerebral biometry, gyration and myelination. Childs Nerv Syst. 2003;19:422–425. doi: 10.1007/s00381-003-0767-4. [DOI] [PubMed] [Google Scholar]
- Gilmore JH, Lin W, Prastawa MW, Looney CB, Vetsa YSK, Knickmeyer RC, Evans DD, Smith JK, Hamer RM, Lieberman JA, Gerig G. Regional gray matter growth, sexual dimorphism, and cerebral asymmetry in the neonatal brain. J Neurosci. 2007;27:1255–1260. doi: 10.1523/JNEUROSCI.3339-06.2007. [DOI] [PMC free article] [PubMed] [Google Scholar]
- Glenn OA, Barkovich J. Magnetic Resonance Imaging of the fetal brain and spine: An increasingly important tool in prenatal diagnosis: Part 2. AJNR Am J Neuroradiol. 2006;27:1807–1814. [PMC free article] [PubMed] [Google Scholar]
- Gogtay N, Giedd JN, Lusk L, Hayashi KM, Greenstein D, Vaituzis AC, Nugent TF3, Herman DH, Clasen LS, Toga AW, Rapoport JL, Thompson PM. Dynamic mapping of human cortical development during childhood through early adulthood. Proc Natl Acad Sci. 2004;101:8174–8179. doi: 10.1073/pnas.0402680101. [DOI] [PMC free article] [PubMed] [Google Scholar]
- Gong QY, Roberts N, Garden AS, Whitehouse GH. Fetal and fetal brain volume estimation in the third trimester of human pregnancy using gradient echo MR imaging. Magn Reson Imaging. 1998;16:235–240. doi: 10.1016/s0730-725x(97)00281-6. [DOI] [PubMed] [Google Scholar]
- Grossman R, Hoffman C, Mardor Y, Biegon A. Quantitative MRI measurements of human fetal brain development in utero. Neuroimage. 2006;33:463–470. doi: 10.1016/j.neuroimage.2006.07.005. [DOI] [PubMed] [Google Scholar]
- Griffiths P, Morris J, Larroche J, Reeves M. Atlas of Fetal and Postnatal Brain MR. 1. Mosby, Inc; Phildelphia: 2010. [Google Scholar]
- Guihard-Costa AM, Larroche JC. Growth velocity of some fetal parameters. I Brain weight and brain dimensions. Biol Neonate. 1992;62:309–316. doi: 10.1159/000243887. [DOI] [PubMed] [Google Scholar]
- Habas PA, Kim K, Rousseau F, Glenn OA, Barkovich AJ, Studholme C. Atlas-based segmentation of developing tissues in the human brain with quantitative validation in young fetuses. Hum Brain Mapp. 2010;31:1348–1358. doi: 10.1002/hbm.20935. [DOI] [PMC free article] [PubMed] [Google Scholar]
- Habas PA, Kim K, Corbett-Detig JM, Rousseau F, Glenn OA, Barkovich AJ, Studholme C. A spatiotemporal atlas of mr intensity, tissue probability and shape of the fetal brain with application to segmentation. Neuroimage. 2010;53:460–470. doi: 10.1016/j.neuroimage.2010.06.054. [DOI] [PMC free article] [PubMed] [Google Scholar]
- Hansen DV, Lui JH, Parker PRL, Kriegstein AR. Neurogenic radial glia in the outer subventricular zone of human neocortex. Nature. 2010;464:554–561. doi: 10.1038/nature08845. [DOI] [PubMed] [Google Scholar]
- Hilgetag CC, Barbas H. Role of mechanical factors in the morphology of the primate cerebral cortex. PLoS Comput Biol. 2006;2:e22. doi: 10.1371/journal.pcbi.0020022. [DOI] [PMC free article] [PubMed] [Google Scholar]
- Hu H, Guo W, Chen H, Wang P, Hung C, Hsieh J, Wu Y. Morphological regionalization using fetal Magnetic Resonance Images of normal developing brains. Eur J Neurosci. 2009;29:1560–1567. doi: 10.1111/j.1460-9568.2009.06707.x. [DOI] [PubMed] [Google Scholar]
- Huang H, Xue R, Zhang J, Ren T, Richards LJ, Yarowsky P, Miller MI, Mori S. Anatomical characterization of human fetal brain development with diffusion tensor Magnetic Resonance Imaging. J Neurosci. 2009;29:4263–4273. doi: 10.1523/JNEUROSCI.2769-08.2009. [DOI] [PMC free article] [PubMed] [Google Scholar]
- Hüppi PS, Warfield S, Kikinis R, Barnes PD, Zientara GP, Jolesz FA, Tsuji MK, Volpe JJ. Quantitative Magnetic Resonance Imaging of brain development in premature and mature newborns. Ann Neurol. 1998;43:224–235. doi: 10.1002/ana.410430213. [DOI] [PubMed] [Google Scholar]
- Hüppi PS. Growth and development of the brain and impact on cognitive outcomes. Nestle Nutr Workshop Ser Pediatr Program. 2010;65:137–151. doi: 10.1159/000281156. [DOI] [PubMed] [Google Scholar]
- Jammes J, Gilles F. Telencephalic development: matrix volume and isocortex and allocortex surface areas. In: Gilles F, Leviton A, Dooling E, editors. The developing human brain: growth and epidemiologic neuropathology. 1983. pp. 87–93. [Google Scholar]
- Kazan-Tannus JF, Dialani V, Kataoka ML, Chiang G, Feldman HA, Brown JS, Levine D. MR volumetry of brain and csf in fetuses referred for ventriculomegaly. AJR Am J Roentgenol. 2007;189:145–151. doi: 10.2214/AJR.07.2073. [DOI] [PMC free article] [PubMed] [Google Scholar]
- Kim K, Habas PA, Rousseau F, Glenn OA, Barkovich AJ, Studholme C. Intersection based motion correction of multislice MRI for 3-D in utero fetal brain image formation. IEEE Trans Med Imaging. 2010;29:146–158. doi: 10.1109/TMI.2009.2030679. [DOI] [PMC free article] [PubMed] [Google Scholar]
- Kim K, Habas PA, Rousseau F, Glenn OA, Barkovich AJ, Koob M, Dietemann J, Robinson AJ, Poskitt KJ, Miller SP, Studholme C. Reconstruction of a geometrically correct diffusion tensor image of a moving human fetal brain. Medical Imaging 2010: Image Processing, Proc SPIE. 2010;7623:76231I. [Google Scholar]
- Kinoshita Y, Okudera T, Tsuru E, Yokota A. Volumetric analysis of the germinal matrix and lateral ventricles performed using mr images of postmortem fetuses. AJNR Am J Neuroradiol. 2001;22:382–388. [PMC free article] [PubMed] [Google Scholar]
- Knickmeyer RC, Gouttard S, Kang C, Evans D, Wilber K, Smith JK, Hamer RM, Lin W, Gerig G, Gilmore JH. A structural MRI study of human brain development from birth to 2 years. J Neurosci. 2008;28:12176–12182. doi: 10.1523/JNEUROSCI.3479-08.2008. [DOI] [PMC free article] [PubMed] [Google Scholar]
- Kostovic I, Rakic P. Developmental history of the transient subplate zone in the visual and somatosensory cortex of the macaque monkey and human brain. J Comp Neurol. 1990;297:441–470. doi: 10.1002/cne.902970309. [DOI] [PubMed] [Google Scholar]
- Kostovic I, Vasung L. Insights from in vitro fetal Magnetic Resonance Imaging of cerebral development. Semin Perinatol. 2009;33:220–233. doi: 10.1053/j.semperi.2009.04.003. [DOI] [PubMed] [Google Scholar]
- Kostovic I, Judas M. The development of the subplate and thalamocortical connections in the human foetal brain. Acta Paediatr. 2010;99:1119–1127. doi: 10.1111/j.1651-2227.2010.01811.x. [DOI] [PubMed] [Google Scholar]
- Kriegstein AR, Noctor SC. Patterns of neuronal migration in the embryonic cortex. Trends Neurosci. 2004;27:392–399. doi: 10.1016/j.tins.2004.05.001. [DOI] [PubMed] [Google Scholar]
- Limperopoulos C, Tworetzky W, McElhinney DB, Newburger JW, Brown DW, Robertson RLJ, Guizard N, McGrath E, Geva J, Annese D, Dunbar-Masterson C, Trainor B, Laussen PC, du Plessis AJ. Brain volume and metabolism in fetuses with congenital heart disease: evaluation with quantitative Magnetic Resonance Imaging and spectroscopy. Circulation. 2010;121:26–33. doi: 10.1161/CIRCULATIONAHA.109.865568. [DOI] [PMC free article] [PubMed] [Google Scholar]
- Lukaszewicz A, Savatier P, Cortay V, Giroud P, Huissoud C, Berland M, Kennedy H, Dehay C. G1 phase regulation, area-specific cell cycle control, and cytoarchitectonics in the primate cortex. Neuron. 2005;47:353–364. doi: 10.1016/j.neuron.2005.06.032. [DOI] [PMC free article] [PubMed] [Google Scholar]
- Kuklisova-Murgasova M, Aljabar P, Srinivasan L, Counsell SJ, Doria V, Serag A, Gousias IS, Boardman JP, Rutherford MA, Edwards AD, Hajnal JV, Rueckert D. A dynamic 4D probabilistic atlas of the developing brain. Neuroimage. 2010;54:2750–2763. doi: 10.1016/j.neuroimage.2010.10.019. [DOI] [PubMed] [Google Scholar]
- Martínez-Cerdeño V, Noctor SC, Kriegstein AR. The role of intermediate progenitor cells in the evolutionary expansion of the cerebral cortex. Cereb Cortex. 2006;16(Suppl 1):i152–61. doi: 10.1093/cercor/bhk017. [DOI] [PubMed] [Google Scholar]
- Maas LC, Mukherjee P, Carballido-Gamio J, Veeraraghavan S, Miller SP, Partridge SC, Henry RG, Barkovich AJ, Vigneron DB. Early laminar organization of the human cerebrum demonstrated with diffusion tensor imaging in extremely premature infants. Neuroimage. 2004;22:1134–1140. doi: 10.1016/j.neuroimage.2004.02.035. [DOI] [PubMed] [Google Scholar]
- McLennan J, Gilles F, Neff R. A model of growth of the human fetal brain. In: Gilles F, Leviton A, Dooling E, editors. The developing human brain: growth and epidemiologic neuropathology. 1983. pp. 43–58. [Google Scholar]
- Oubel E, Koob M, Studholme C, Dietemann J, Rousseau F. Reconstruction of scattered data in fetal diffusion MRI. Med Image Comput Comput Assist Interv. 2010;13:574–581. doi: 10.1007/978-3-642-15705-9_70. [DOI] [PMC free article] [PubMed] [Google Scholar]
- Perkins L, Hughes E, Srinivasan L, Allsop J, Glover A, Kumar S, Fisk N, Rutherford M. Exploring cortical subplate evolution using Magnetic Resonance Imaging of the fetal brain. Dev Neurosci. 2008;30:211–220. doi: 10.1159/000109864. [DOI] [PubMed] [Google Scholar]
- Prayer D, Kasprian G, Krampl E, Ulm B, Witzani L, Prayer L, Brugger PC. MRI of normal fetal brain development. Eur J Radiol. 2006;57:199–216. doi: 10.1016/j.ejrad.2005.11.020. [DOI] [PubMed] [Google Scholar]
- Reillo I, de Juan Romero C, García-Cabezas MÁ, Borrell V. A role for intermediate radial glia in the tangential expansion of the mammalian cerebral cortex. Cereb Cortex. 2010 doi: 10.1093/cercor/bhq238. [DOI] [PubMed] [Google Scholar]
- Sidman RL, Rakic P. Neuronal migration, with special reference to developing human brain: A review. Brain Res. 1973;62:1–35. doi: 10.1016/0006-8993(73)90617-3. [DOI] [PubMed] [Google Scholar]
- Vasileiadis GT, Thompson RT, Han VKM, Gelman N. Females follow a more “compact” early human brain development model than males. a case-control study of preterm neonates. Pediatr Res. 2009;66:551–555. doi: 10.1203/PDR.0b013e3181ba1ae7. [DOI] [PubMed] [Google Scholar]
- Widjaja E, Geibprasert S, Mahmoodabadi SZ, Blaser S, Brown NE, Shannon P. Alteration of human fetal subplate layer and intermediate zone during normal development on MR and diffusion tensor imaging. AJNR Am J Neuroradiol. 2010;31:1091–1099. doi: 10.3174/ajnr.A1985. [DOI] [PMC free article] [PubMed] [Google Scholar]
- Zecevic N, Chen Y, Filipovic R. Contributions of cortical subventricular zone to the development of the human cerebral cortex. J Comp Neurol. 2005;491:109–122. doi: 10.1002/cne.20714. [DOI] [PMC free article] [PubMed] [Google Scholar]
- Zhang Z, Liu S, Lin X, Sun B, Yu T, Geng H. Development of fetal cerebral cortex: Assessment of the folding conditions with post-mortem Magnetic Resonance Imaging. Int J Dev Neurosci. 2010;28:537–543. doi: 10.1016/j.ijdevneu.2010.05.001. [DOI] [PubMed] [Google Scholar]