Abstract
Skp2 is a member of the F-box family of substrate-recognition subunits of SCF ubiquitin–protein ligase complexes that has been implicated in the ubiquitin-mediated degradation of several key regulators of mammalian G1 progression, including the cyclin-dependent kinase inhibitor p27, a dosage-dependent tumor suppressor protein. In this study, we examined Skp2 and p27 protein expression by immunohistochemistry in normal oral epithelium and in different stages of malignant oral cancer progression, including dysplasia and oral squamous cell carcinoma. We found that increased levels of Skp2 protein are associated with reduced p27 in a subset of oral epithelial dysplasias and carcinomas compared with normal epithelial controls. Tumors with high Skp2 (>20% positive cells) expression invariably showed reduced or absent p27 and tumors with high p27 (>20% positive cells) expression rarely showed Skp2 positivity. Increased Skp2 protein levels were not always correlated with increased cell proliferation (assayed by Ki-67 staining), suggesting that alterations of Skp2 may contribute to the malignant phenotype without affecting proliferation. Skp2 protein overexpression may lead to accelerated p27 proteolysis and contribute to malignant progression from dysplasia to oral epithelial carcinoma. Moreover, we also demonstrate that Skp2 has oncogenic potential by showing that Skp2 cooperates with H-RasG12V to malignantly transform primary rodent fibroblasts as scored by colony formation in soft agar and tumor formation in nude mice. The observations that Skp2 can mediate transformation and is up-regulated during oral epithelial carcinogenesis support a role for Skp2 as a protooncogene in human tumors.
Progression of mammalian cells from quiescence to proliferation involves the activation of G1-specific cyclin–cyclin-dependent protein kinase (Cdk) complexes, the inactivation of the retinoblastoma tumor suppressor protein (pRb), and accumulation of E2F transcription factors. Various studies have shown that the disruption of components of this control pathway, either by the activation of positive acting components such as cyclin D1 and Cdk4 or by the inactivation of negative components such as the tumor suppressor proteins pRb and p16, can lead to the loss of growth control underlying the development of various forms of human cancer (1). Recent developments also emphasize a central role for timely changes in protein stability at the hands of selected E3 ubiquitin–protein ligases during the transition from quiescence to proliferation and the F-box protein Skp2, the substrate recognition subunit of the SCFSkp2 ubiquitin–protein ligase complex, appears to play a particularly important role in this regard (2, 3). Skp2 displays S-phase-promoting function and has been implicated in the ubiquitin-mediated proteolysis of the Cdk inhibitor p27 (4–6). Moreover, the targeted disruption of Skp2 leads to the accumulation of p27 and cell cycle arrest in G1 (7). SCFSkp2 has also been implicated in the ubiquitination of other cell cycle regulatory proteins, including cyclin E (7) and E2F-1 (8). Although Skp2 mediates the turnover of both positive and negative regulators of cell cycle progression, its overexpression leads to cell cycle progression. These apparently conflicting findings can be easily reconciled when one appreciates that these two classes of SCFSkp2 substrates differ in how their stability is influenced by cell cycle stage. p27 is stable throughout G0/G1 but becomes unstable as cells exit G1 and enter S phase. In contrast, cyclin E and E2F-1 proteolysis is constitutive and their rapid turnover during G1 and S phase progression may simply entrain the abundance of cyclin E and E2F-1 to their transcription rates.
Numerous clinical studies have shown that reduced p27 protein levels correlate with poor patient prognosis in human epithelial cancers arising in diverse sites, including the breast (9–11) and colon (12). We previously reported reduced p27 protein expression in oral precancerous lesions and carcinomas compared with normal epithelial controls (13). Oral carcinomas have a significantly higher proliferative index than normal epithelium (14–20), and increased cell proliferation is also observed in precancerous oral epithelial dysplasia compared with nondysplastic epithelium (14–16, 20–22). Therefore, a progressive dysregulation of cell proliferation appears early in oral carcinogenesis.
p27 appears to belong to a recently recognized class of tumor suppressors in which reduced protein expression is usually not caused by genetic change (23). The observation that Skp2 can promote the ubiquitin-mediated proteolysis of p27 prompted us to examine the relationship between the expression of Skp2 and p27 proteins during the progression from oral epithelial dysplasias to carcinoma and to test whether unregulated Skp2 function is linked to the acquisition of a neoplastic phenotype.
Materials and Methods
Tissues.
Mucosal biopsies of 49 epithelial dysplasias and pretreatment biopsies of 24 squamous cell carcinomas (SCC) from the floor of the mouth were obtained from the surgical pathology files of the Department of Oral Pathology, Faculty of Dentistry, University of Toronto, from the period 1988 to 1998. The 49 cases of epithelial dysplasia from the floor of the mouth comprised 17 cases of mild, 17 cases of moderate, and 15 cases of severe dysplasia. The 24 cases of squamous cell carcinoma included poorly, moderately, and well differentiated tumor grades. The mean patient age was 58.7 (range 21–74) years. Specimens from these patients, from 49 men and 29 women, were screened for adequacy of lesional tissue by staining tissue sections with hematoxylin and eosin. The histological diagnosis of each specimen was independently reviewed based on established histological criteria (24). Sixteen biopsies of normal control epithelium from the floor of the mouth were obtained from 6 men and 10 women nonsmokers with a mean age of 52.2 years (range 35–73).
Immunohistochemistry.
Five-micrometer serial sections were mounted on glass slides coated with 2% aminopropyltrioxysilane (APES) (Sigma) in acetone. Sections were dewaxed in xylene and rehydrated in graded ethanol solutions. Endogenous peroxidase activity was blocked by immersion in 0.3% methanolic peroxide for 15 min. Immunoreactivity of the target antigens was enhanced by microwaving the sections for 10 min in 0.1 M citrate buffer, pH 6.0. Skp2 protein expression was determined by incubating the tissue sections with an affinity-purified polyclonal anti-full-length (fl)Skp2 antibody diluted 1:600 in PBS. Specificity of the Skp2 staining was confirmed by preincubating anti-Skp2 antibodies with purified maltose-binding-Skp2 fusion protein. Immunostaining with a monoclonal Skp2 antibody verified the pattern seen with the polyclonal Skp2 serum. p27 protein expression was detected by incubating the tissue sections with a monoclonal antibody to p27 (Transduction Laboratories, Lexington KY) diluted 1:500 as previously described (25). To assay cell proliferation, sections were incubated with the MMI monoclonal antibody (NovoCastra, Newcastle, U.K.), which recognizes an epitope of the Ki-67 antigen diluted 1:1000 in PBS. The sections were then incubated with a biotinylated multilink peroxidase agent (BioGenex, San Ramon, CA). Antigen–antibody reactions were visualized with the chromogen diaminobenzidine (DAB). Normal mouse serum containing mixed immunoglobulins at a concentration approximating that of the primary antibody was used as a negative control. Sections were counterstained with hematoxylin. A normal tonsil was used as a positive control for all antigens.
Quantification of Immunohistochemistry and Statistical Analysis.
To determine the number of Skp2-, p27-, or Ki-67-positive cells as a proportion of the total epithelial cell population in normal epithelial or lesional tissue, an image analysis system was used as previously described (IBAS System, Kontron Electronik, Dusseldorf, Germany) (13, 19, 26). At 200× magnification, the total number of epithelial cell nuclei in each field was counted. To quantify the number of cells showing nuclear staining, the gray scale was adjusted for each case, such that the cells counted as positive showed dark nuclear staining similar to the positive control sample. A minimum of 500 cells were counted within the entire length of lesional epithelium or total tumor area. The percentage of the total cell population that expressed each antigen (Skp2, p27, and Ki-67) was then calculated for each case. For statistical analysis the differences in the means were assessed by direct comparison of 95% confidence intervals. For categorical data, Fisher's exact test was used. A P value of less than 0.05 was considered significant. The Pearson correlation coefficient was used to test the strength of association between the continuous variables.
Cell Culture and Transfections.
Primary rat embryo fibroblasts (REFs; Bio-Whittaker) were cultivated at 106 cells per 100-mm tissue culture plate in Dulbecco's modified Eagle's medium (DMEM) supplemented with 10% fetal calf serum (FCS). After 24–48 h, cells were transfected with calcium phosphate precipitates containing 1 μg of pBABE-puro, 7 μg of pcDNA3-Skp2, pBJ4-vHa-RasG12V, pCMVneo-E1A, and/or pRcCMV-E2F1. At 48 h after transfections, cells were split 1:5 into DMEM supplemented with 10% FCS and containing 1.25 μg of puromycin per ml of growth medium. Medium was changed every 4 days and cells were incubated for 2–3 weeks before transformed foci were counted.
Antibodies, Immunoblotting, and Fluorescence-Activated Cell Sorting (FACS) Analysis.
Monoclonal antibody 95.60.2 directed against human Skp2 will be described elsewhere. Antibodies specific for Cdk2 (M2), cyclin E (HE12), cyclin A (H-432), and p27 (C-19) were purchased form Santa Cruz Biotechnology. Immunoblotting was performed as described (27). Blots were processed for enhanced chemiluminescence (Amersham Pharmacia) according to the manufacturer's instructions.
Soft Agar Assays and Tumor Formation in Nude Mice.
Soft agar assays were performed as described (28). To assay tumor formation in nude mice, uncloned pools or individual clones of puromycin-resistant Skp2/H-RasG12V- or Skp2 alone-transfectants were trypsinized, counted, and resuspended in 1× PBS. One hundred microliters of 1× PBS containing 106 cells was then injected into 2- to 3-week-old nude mice. Mice were scored for the presence of tumors at the injection sites at daily intervals. The length (l) and width (w) of tumors was measured with a micrometer and the approximate ellipsoid tumor volume (tv) was calculated by using the equation l × w × 0.562 = tv.
Results
Increased Skp2 Protein Expression Is Associated with Reduced p27 During Progression from Oral Epithelial Dysplasia to Invasive Carcinoma.
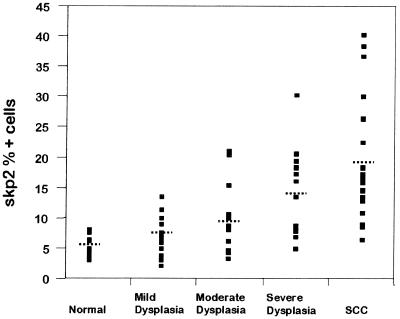
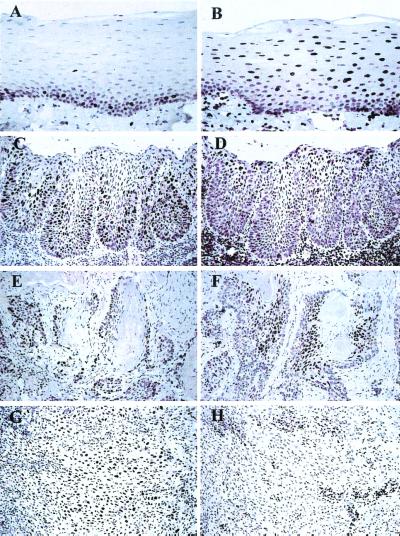
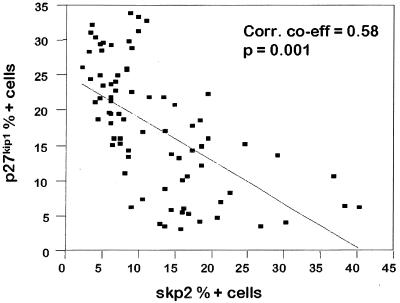
We studied the expression of Skp2 and p27kip1 proteins in 49 oral epithelial dysplasias, 24 oral carcinomas, and 16 normal epithelial tissue controls by immunohistochemistry and found that both Skp2 and p27 are frequently altered in oral precancerous lesions and in oral cancers. Computer image analysis allowed accurate quantitation of the number of positive cells as a proportion of total lesional epithelial cells. The scores for Skp2, p27, and Ki-67 proteins (percentage positive nuclei) for normal epithelium, dysplastic epithelium, and carcinomas are summarized in Table 1. Skp2 and p27kip1 levels showed a strong inverse correlation (correlation coefficient = 0.58, P = 0.001) (Fig. 1), and an inverse topographical distribution of these two proteins was seen within the oral tissues (Fig. 3). Skp2 protein was significantly overexpressed in both the epithelial dysplasias [mean 10.1% ± 1.6% nuclei positive (95% confidence interval), range = 2.2–30.4%] and carcinomas (mean 19.3% ± 3.7% nuclei positive, range = 6.6–40.3) compared with normal epithelial controls (mean 5.2% ± 0.7% nuclei positive, range = 3.1–8.2%) (P < 0.05) (Table 1). Within the dysplasias, there was a general trend to increasing Skp2 scores with worsening grades of epithelial dysplasia (see Fig. 2 and Table 1).
Table 1.
Summary of mean Skp2, p27, and Ki-67 scores in increasing grades of epithelial dysplasia and in carcinomas
| Diagnosis | No. of cases | Score
|
||
|---|---|---|---|---|
| Skp2 | p27 | Ki-67 | ||
| Normal | 16 | 5.2 ± 0.7 | 37.6 ± 5.2 | 5.6 ± 0.7 |
| Dysplasia total | 49 | 10.1 ± 1.6* | 20.4 ± 2.1* | 8.4 ± 1.6* |
| Mild | 17 | 7.1 ± 1.3 | 22.7 ± 2.4* | 5.8 ± 1.6 |
| Moderate | 17 | 9.3 ± 2.5* | 21.1 ± 3.7* | 7.9 ± 1.9 |
| Severe | 15 | 14.3 ± 3.4* | 16.8 ± 4.0* | 12.0 ± 3.6* |
| Carcinoma | 24 | 19.3 ± 3.7* | 10.8 ± 3.2* | 7.8 ± 2.0 |
The score is the percent positive cells per total number of epithelial cells (normal tissue) or lesional epithelial cells; results are given ±95% confidence interval. *, Scores that are significantly different from control values.
Figure 1.
Distribution of scores for Skp2-positive cells in normal epithelium, in mild, moderate, and severe dysplasia, and in squamous cell carcinomas. The dotted lines indicate the mean for the group.
Figure 3.
Skp2 (A, C, E, and G) and p27 (B, D, F, and H) immunostaining in normal oral mucosa, epithelial dysplasia, and squamous cell carcinoma. Paraffin-embedded tissue sections were stained for Skp2 or p27 and counterstained with hematoxylin. Skp2 staining was performed with an affinity-purified polyclonal anti-Skp2 antibody. (A) Skp2 staining in normal oral epithelium, showing scattered positive cells in the basal and parabasal proliferative layers. (B) p27 staining in normal oral epithelium showing positive cells in the suprabasal, terminally differentiated keratinocytes. (C) Skp2 immunostaining in severe epithelial dysplasia, showing expansion of the number and distribution of the positive cells into the suprabasal layers. (D) p27 staining in severe epithelial dysplasia is reduced and confined to the superficial keratinocytes. (E) Skp2 staining in a well differentiated carcinoma is confined to the peripheral cells of tumor islands. (F) p27 staining is reduced at the periphery of a well differentiated carcinoma but increased in the central areas. (G) Increased Skp2 staining (>20% nuclei positive) in a poorly differentiated carcinoma. (H) p27 immunostaining is markedly reduced with only infiltrating lymphocytes positive.
Figure 2.
Scatter plot of Skp2 versus p27 percentage positive cells for epithelial dysplasia and carcinomas. The line of best fit is shown with a Pearson correlation coefficient of 0.58.
The levels of p27 protein were reduced in both the premalignant lesions and oral cancers compared with normal oral epithelium. The mean percentage positive nuclei scores for p27 (mean ± 95% confidence interval) were 20.4% ± 2.1% (range = 4.8–33.9%) for the dysplasia group and 10.8% ± 3.3% (range = 3.3–32.9%) for the carcinomas, compared with 37.6% ± 5.2% (range = 38.1–55.4%) for normal epithelial controls (P < 0.05). Likewise, the mean p27 scores for each grade of dysplasia were significantly lower than the mean p27 score for the normal epithelial controls (P < 0.05). Using a cut-off at 20% to separate specimens showing high and low p27 protein levels, we found that 47 of 73 dysplasias and carcinomas showed low p27 protein expression.
In normal epithelial controls, Skp2 protein expression was confined to the basal and parabasal proliferative compartment (Fig. 3). There were no Skp2-positive cells in the terminally differentiated suprabasal epithelial regions. The topographical distribution of p27-positive cells was the inverse of that of Skp2, with p27 expression seen almost exclusively in a majority of nuclei of the terminally differentiated, suprabasal epithelial cells (Fig. 3). Only a few scattered basal epithelial cells showed p27 immunoreactivity, with the majority of cells in the basal layer showing no reaction. With increasingly severe grades of epithelial dysplasia there was a marked expansion of the Skp2 positive cells and a corresponding reduction in p27-positive cells (Fig. 3). We also identified elevated Skp2 protein expression in a subset of breast carcinomas and high-grade malignant lymphomas (data not shown).
Statistical analysis showed an inverse correlation between Skp2 and p27 scores for epithelial dysplasia and carcinoma (correlation co-efficient = 0.58, P = 0.001) (Fig. 2). Well differentiated carcinomas tended to show high p27 staining (defined as >20% tumor nuclei positive) and in these Skp2 was rarely detected. Indeed, none of 26 lesions showing high p27 had high Skp2 scores (defined as >20% positive cells) (Table 2). Moreover, the subset of poorly differentiated cancers with high Skp2 protein expression invariably showed reduced or absent p27 staining. All 11 cases with abundant Skp2 showed low p27 expression (P = 0.013, Fisher's exact test). Within the carcinomas, there was an inverse topographical distribution of Skp2- and p27-positive cells, with Skp2-positive cells in the periphery of tumor islands and p27 restricted to the central more differentiated areas (Fig. 3). No case showed high protein expression of both Skp2 and p27.
Table 2.
Comparison of the number of cases showing high and low protein expression of Skp2 and p27 in oral epithelial dysplasias and carcinomas
| Low Skp2 | High Skp2 | |
|---|---|---|
| Low p27 | 36 | 11 |
| High p27 | 26 | 0 |
For both markers, the cut-off for high expression was defined as >20% nuclei positive. P = 0.013, Fisher's exact test.
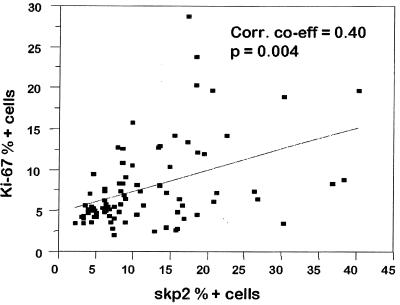
The mean Ki-67 scores were higher in both the dysplasia group 8.4% ± 1.6% (range 2.1–28.8%) and in the carcinomas 7.8% ± 2.0% (range 2.6–20.4%) compared with the control epithelium 5.6% ± 0.7% (range 4.4–8.5%). Only the severe dysplasia group had a significantly greater Ki-67 score than the normal controls (P < 0.05). There was a weak positive correlation between Skp2 and Ki-67 scores (correlation co-efficient = 0.40, P = 0.004) most notable in the normal epithelial samples (Fig. 4), but p27 and Ki-67 were not significantly associated.
Figure 4.
Scatter plot of Skp2 versus Ki-67 percentage positive cells for epithelial dysplasia and carcinomas. The line of best fit is shown with a Pearson correlation coefficient of 0.40.
Transforming Activity of Skp2 in Primary REFs.
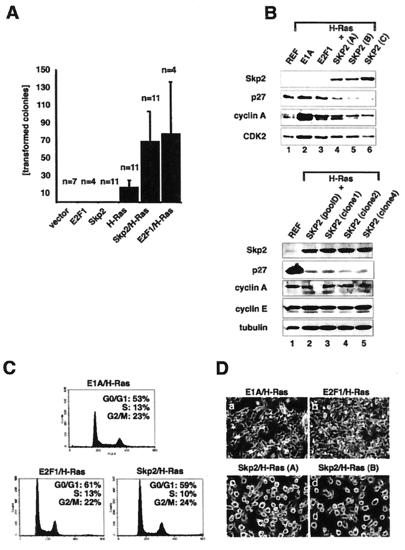
Having observed increasing levels of Skp2 overexpression accompanying the progression from dysplasia to oral carcinoma, we next asked whether Skp2 has oncogenic potential in tissue culture. Therefore, mammalian expression plasmids encoding Skp2 and H-RasG12V were transfected either alone or in combination into primary REFs. REFs were also transfected with either E2F-1 alone or E2F-1 together with H-RasG12V. After selection in puromycin for 2 weeks, plates were scored for the presence of morphologically transformed colonies. In the absence of H-RasG12V, neither Skp2 nor E2F-1 alone gave rise to morphologically transformed foci. A few foci (17 on average) were formed upon transfection of H-RasG12V alone (Fig. 5A). In contrast, cotransfection of Skp2 together with H-RasG12V increased the mean number of transformed foci by 4-fold (73 foci on average per transfected 10-cm dish) (Fig. 5A). Similar numbers of transformed foci were obtained upon cotransfection of REFs with E2F-1 and H-RasG12V (Fig. 5A).
Figure 5.
Characterization of Skp2/H-RasG12V-transfected primary REFs. (A) REFs were transfected with expression plasmids as indicated and selected in puromycin for 2–3 weeks, and visible colonies were counted. Black bars represent the combined average of transformed colonies per transfection. The numbers of transfection experiments (n) are superimposed on the corresponding bars of the diagram. The vertical lines indicate standard errors. (B) (Upper) Colonies produced by transfection of REFs with H-RasG12V together with E1A, E2F1, or Skp2 were established as uncloned mass cultures. Lysates were prepared from each cell population, equalized for protein content, and processed for Western blotting with anti-Skp2 monoclonal (Top), anti-p27 (Second), anti-cyclin A (Third), or anti-Cdk2 (Bottom) antibodies. Lane 1, normal REFs; lane 2, E1A/H-RasG12V-transformed pool; lane 3, E2F1/H-RasG12V-transformed pool; lanes 4–6, three independently established Skp2/H-RasG12V-transformed pools. (Lower) Colonies produced by transfection of REFs with H-RasG12V together with Skp2 were established as either uncloned mass cultures or clones and processed for Western blotting with anti-Skp2 monoclonal (Top), anti-p27 (Second), anti-cyclin E (Third), anti-cyclin A (Fourth), or anti-tubulin (Bottom) antibodies. Lane 1, normal REFs; lane 2, Skp2/H-RasG12V-transformed pool; lanes 3–5, Skp2/H-RasG12V-transformed clones isolated form independent transfection experiments. (C) Representative mass cultures of transformed cells described for B were processed for flow cytometric analysis. The x axis shows DNA content and the y axis shows the number of cells. The percentages of cells in G0/G1, S, and G2/M are indicated. (D) Representative photomicrograph of established cell pools analyzed in B. (a) E1A/H-RasG12V-transformed pool. (b) E2F1/H-RasG12V-transformed pool. (c and d) Two independently established Skp2/H-RasG12V-transformed pools.
Colonies produced by cotransfection of Skp2 and H-RasG12V were easily established either as mass cultures or as individual clones that grew rapidly in culture. The expression of human Skp2 protein and H-RasG12V (data not shown) in these established cell pools was assayed by Western blot analysis. As shown in Fig. 5B, Skp2 was readily detected in extracts from three independently established cell pools (Upper, lanes 4–6, and Lower, lanes 2–5). Skp2 was not detected in lysates from normal REFs, E1A/H-RasG12V, or E2F1/H-RasG12V-transformed cell pools (Fig. 5B Upper, lanes 1–3, respectively). Interestingly, Skp2/H-RasG12V transformants contained significantly less p27 than E1A/H-RasG12V-, or E2F1/H-RasG12V-transformed cultures (Fig. 5B Upper, compare lanes 4–6 with lanes 2 and 3 and Lower, compare lanes 2–5 with lane 1). In contrast to p27, cyclin E protein levels remained unchanged in Skp2/H-RasG12V transformants compared with REFs (Lower, lanes 2–5). We were unable to detect endogenous E2F-1 in these cells. Flow cytometric analysis revealed similar cell cycle distributions in these various transformed cultures (Fig. 5C). Hence, the differences in p27 levels in Skp2/H-RasG12V-transformed cells relative to E1A/H-RasG12V- or E2F1/H-RasG12V-producing cells cannot be attributed simply to changes in proliferative rate and may directly reflect Skp2's capacity to promote p27 degradation (4–7). Cyclin A protein levels were higher in all of these transformed cultures relative to normal REFs, whereas Cdk2 levels were not significantly altered (Fig. 5B). Microscopic examination of the Skp2/H-RasG12V-transformed cells revealed an unusual cell morphology, characterized by a rounded cell shape and almost complete failure to attach to the culture dish (Fig. 5D, c and d). E1A/H-RasG12V- or E2F1/H-RasG12V-expressing cells displayed the characteristic transformation-associated spindle morphology (Fig. 5D, a and b, respectively).
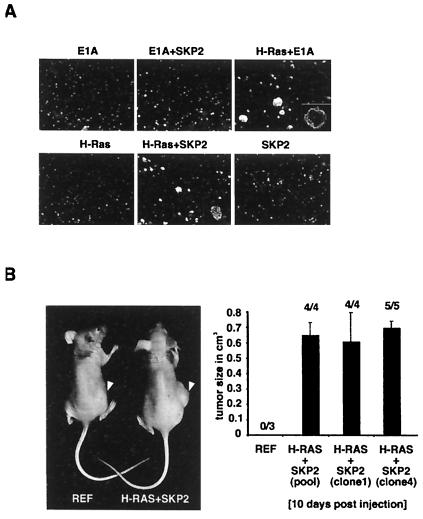
Anchorage-independent growth is a characteristic of malignantly transformed cultured cells. Skp2/H-RasG12V-transformed cell pools formed colonies in soft agar (see Fig. 6A). Relevant controls showed no anchorage-independent growth (Fig. 6A). Skp2/H-RasG12V-producing cells yielded colonies that were generally smaller than those produced by E1A/H-RasG12V transformants (Fig. 6A, compare fifth and third panels). This difference was reproducible among cells established from four independent transformations with Skp2 and H-RasG12V. We estimated from several experiments that about 30–40% of Skp2/H-RasG12V-producing cells yielded colonies in these assays. Finally, the tumorigenic potential of Skp2/H-RasG12V-producing cells was assessed in nude mice (Fig. 6B). After 10 days, tumors were detected in all experimental animals injected s.c. with Skp2/H-RasG12-transformed cells, suggesting that Skp2 can function as an oncogene product. For control, no tumors were observed after injection of primary REFs or REFs transfected with Skp2 cDNA alone (data not shown). In accordance with the latter, transgenic mice that express Skp2 under the control of the lymphotropic papovavirus (LPV) transcriptional signals did not develop lymphomas at an age of 7 months (George Imbert and W.K., unpublished observations).
Figure 6.
REFs transformed by Skp2 and H-RasG12V grow in soft agar and are tumorigenic. (A) REFs were transfected with expression plasmids as indicated, selected in puromycin, and grown in soft agar. Cells were photographed after 2 weeks in semisolid agarose. Only the results of one pool of the various independently established cultures are shown here. (B) (Left) A tumor in a flank of a mouse injected with Skp2/H-RasG12V-expressing cells (right mouse). Tumors did not appear after injection of nontransfected REFs (left mouse). (Right) Pooled populations or cells of individual clones expressing Skp2 and H-RasG12V were independently injected into nude mice. After 10 days, palpable tumors were measured with a caliper to estimate tumor volume. The numbers on top of each bar represent the proportion of injected mice that had detectable tumors at 10 days after injection. Note that all mice that were injected with Skp2/H-RasG12V-expressing cells formed tumors. The vertical lines indicate standard errors.
Discussion
Almost all human tumors contain either loss-of-function mutations in Rb or mutations in genes encoding upstream regulators of pRb—i.e., cyclin D1, Cdk4, and p16 (1). These mutations are thought to deregulate the numerous transcription factors and cellular proteins that interact with pRb, including members of the E2F transcription factor family. Like pRb, p27 controls activation of the cell cycle in response to mitogenic stimuli (29). Thus, regulation of p27 is an essential step in the pathway that links mitogenic signals to cell cycle progression and provides a critical control of cell cycle commitment. p27 has also been identified as a tumor suppressor for multiple tissues (23). But unlike pRb, p27 does not conform to the paradigm of two-hit gene inactivation in tumors. While p27 gene mutations are rarely seen in human cancers, its tumor suppressor effects are frequently lost through mechanisms leading to its enhanced proteolysis. The frequent reduction of p27 levels in human cancers and the observation that p27 haploinsufficient mice are more tumor-prone suggest that reduced p27 may predispose to tumorigenesis. The enhanced proteolysis of p27 could emerge, in part, by mutations in genes that modulate the expression of components that control the abundance of p27.
Previous biochemical studies have demonstrated that Skp2 regulates p27 degradation (4–7). Results presented here show that expression of Skp2 protein is frequently altered in oral precancerous lesions and in oral cancers. We found that Skp2 protein was significantly overexpressed in the epithelial dysplasias and carcinomas compared with normal epithelial controls. In addition, Skp2 levels increased with worsening grades of epithelial dysplasia, suggesting that Skp2 overexpression may occur at the precancerous stage, before the acquisition of an invasive phenotype during oral cancer development. There was a weak positive correlation between Skp2 and levels of the proliferation marker Ki-67; however, a subpopulation of oral cancers (12%) showed high Skp2 protein but low proliferation and vice versa. This observation suggests that in a proportion of cases, Skp2 may contribute to the malignant phenotype by a mechanism that is independent of dysregulated cell proliferation. We also found that p27 and Ki-67 levels correlated poorly in the oral cancer samples, consistent with findings in other tumors, such as breast (9, 10) and colon carcinoma (12). Thus the oncogenic effects of high Skp2 levels and reduced p27 may not act uniquely through increased proliferation. Reduced p27 has been shown to affect tumor cell–cell adhesion (30) and could influence metastatic potential.
In general, we found an inverse correlation between Skp2 and p27 levels and an inverse topographical distribution of these two proteins within the oral tissues. Lesions with high levels of p27 showed rare expression of Skp2. Although the number of cases with reduced p27 exceeded that with elevated Skp2 expression, a striking finding was that poorly differentiated cancers with abundant Skp2 (defined as >20% positive cells) invariably showed low p27 (<20% positive cells) protein expression. Thus, overexpression of Skp2 may represent an important mechanism to deregulate p27 in oral dysplasia and carcinomas and may, in a subset of tumors, contribute to malignant transformation of epithelial cells by enhancing p27 degradation.
Having observed that Skp2 is overexpressed in a subset of oral and breast cancers and lymphomas, we tested the oncogenicity of deregulated Skp2 expression directly. We found that Skp2 cooperates with H-RasG12V to transform primary rodent fibroblasts and that Skp2/H-RasG12V transformants express significantly less p27 than, for example, E1A/H-RasG12V transformants (Figs. 5 and 6). Skp2 and Ras cooperate also in the development of T cell lymphomas (31). Hence, unregulated Skp2 function is linked to the acquisition of a neoplastic phenotype, consistent with the view that increased Skp2 expression may represent a mechanism for p27 loss and contribute to tumor progression.
The synergy between Skp2 and Ras in promoting neoplastic transformation may reflect the effects of Ras to promote the inactivation of the pRb pathway (32, 33), whereas Skp2 counters p27 function (4–7). That pRb and p27 may integrate different regulatory signals has been previously suggested on the basis of the observation that these tumor suppressors cooperate to suppress tumor development in mice (34). Skp2 has also been implicated in mediating the ubiquitination of two positive regulators of cell cycle progression, namely cyclin E (7) and E2F-1 (8). However, in the Skp2/H-RasG12V transformants, cyclin E levels did not change significantly. One possibility that remains to be investigated is that some other component and/or posttranslational modification required for cyclin E degradation by Skp2 is limiting.
Intragenic mutations, chromosome deletions, and gene silencing are well documented routes for loss of tumor suppressor expression in human cancers (35). The observation that Skp2 not only has oncogenic potential in vitro but also is overexpressed in certain human tumors suggests that deregulated Skp2 expression may be a mechanism for loss of the tumor-suppressive effects of p27. In addition to overexpression of Skp2, increased p27 proteolysis in human tumors may result from oncogenic activation of c-myc with consequent overexpression of the SCFSkp2 subunit, Cul1 (36). Studies that elucidate the oncogenic pathways leading to increased and deregulated Skp2 expression and the consequences thereof may yield important targets for development of anticancer drugs.
Acknowledgments
We thank members of our laboratories for helpful discussions and Dr. A. Marti for help with nude mouse experiments. We thank Dr. B. Amati (DNAX, Palo Alto, CA) for H-Ras plasmids. We thank Drs. M. Loda and M. Pagano for sharing results of their Skp2 studies before publication. M.G. is supported by a grant from the Swiss Cancer League. J.S. is supported by Cancer Care Ontario, by grants from the Canadian Breast Cancer Research Initiative, and by career awards from the Burroughs Welcome Fund and the U.S. Army Department of Defense Breast Cancer Research Program. R.J. is supported by grants from the Medical Research Council of Canada. W.K. is a START Fellow and is supported by the Swiss National Science Foundation and by the Novartis Research Foundation.
Abbreviations
- Cdk
cyclin-dependent protein kinase
- pRb
retinoblastoma tumor suppressor protein
- REFs
rat embryo fibroblasts
Footnotes
This paper was submitted directly (Track II) to the PNAS office.
References
- 1.Sherr C J. Science. 1996;274:1672–1677. doi: 10.1126/science.274.5293.1672. [DOI] [PubMed] [Google Scholar]
- 2.Deshaies R J. Annu Rev Cell Dev Biol. 1999;15:435–467. doi: 10.1146/annurev.cellbio.15.1.435. [DOI] [PubMed] [Google Scholar]
- 3.Koepp D M, Harper J W, Elledge S J. Cell. 1999;97:431–434. doi: 10.1016/s0092-8674(00)80753-9. [DOI] [PubMed] [Google Scholar]
- 4.Sutterlüty H, Chatelain E, Marti A, Wirbelauer C, Senften M, Müller U, Krek W. Nat Cell Biol. 1999;1:207–214. doi: 10.1038/12027. [DOI] [PubMed] [Google Scholar]
- 5.Tsvetkov L M, Yeh K H, Lee S H, Sun H, Zhang H. Curr Biol. 1999;9:661–664. doi: 10.1016/s0960-9822(99)80290-5. [DOI] [PubMed] [Google Scholar]
- 6.Carrano A, Eytan E, Hershko A, Pagano M. Nat Cell Biol. 1999;1:193–199. doi: 10.1038/12013. [DOI] [PubMed] [Google Scholar]
- 7.Nakayama K, Nagahama H, Minamishima Y A, Matsumoto M, Nakamichi I, Kitagawa K, Shirane M, Tsunematsu R, Tsukiyama T, Ishida N, et al. EMBO J. 2000;19:2069–2081. doi: 10.1093/emboj/19.9.2069. [DOI] [PMC free article] [PubMed] [Google Scholar]
- 8.Marti A, Wirbelauer C, Scheffner M, Krek W. Nat Cell Biol. 1999;1:14–19. doi: 10.1038/8984. [DOI] [PubMed] [Google Scholar]
- 9.Catzavelos C, Bhattacharya N, Ung Y C, Wilson J A, Roncari L, Sandhu C, Shaw P, Yeger H, Morava-Protzner I, Kapusta L, et al. Nat Med. 1997;3:227–230. doi: 10.1038/nm0297-227. [DOI] [PubMed] [Google Scholar]
- 10.Porter P L, Malone K E, Heagerty P J, Alexander G M, Gatti L A, Firpo E J, Daling J R, Roberts J M. Nat Med. 1997;3:222–226. doi: 10.1038/nm0297-222. [DOI] [PubMed] [Google Scholar]
- 11.Tan P, Cady B, Wanner M, Worland P, Cukor B, Magi-Galluzzi C, Lavin P, Draetta G, Pagano M, Loda M. Cancer Res. 1997;57:1259–1263. [PubMed] [Google Scholar]
- 12.Loda M, Cukor B, Tam S W, Lavin P, Fiorentino M, Draetta G F, Milburn Jessup J, Pagano M. Nat Med. 1997;3:231–234. doi: 10.1038/nm0297-231. [DOI] [PubMed] [Google Scholar]
- 13.Jordan R C, Bradley G, Slingerland J. Am J Pathol. 1998;152:585–590. [PMC free article] [PubMed] [Google Scholar]
- 14.Coltrera M D, Zarbo R J, Sakr W A, Gown A M. Am J Pathol. 1992;141:817–825. [PMC free article] [PubMed] [Google Scholar]
- 15.Girod S C, Pape H D, Krueger G R. Eur J Cancer B Oral Oncol. 1994;30B:419–423. doi: 10.1016/0964-1955(94)90023-x. [DOI] [PubMed] [Google Scholar]
- 16.Huang W Y, Coltrera M, Schubert M, Morton T, Truelove E. Oral Surg Oral Med Oral Pathol. 1994;78:748–754. doi: 10.1016/0030-4220(94)90091-4. [DOI] [PubMed] [Google Scholar]
- 17.Girod S C, Krueger G, Pape H D. Int J Oral Maxillofac Surg. 1993;22:285–288. doi: 10.1016/s0901-5027(05)80517-x. [DOI] [PubMed] [Google Scholar]
- 18.Warnakulasuriya K A, Johnson N W. J Oral Pathol Med. 1994;23:246–250. doi: 10.1111/j.1600-0714.1994.tb00053.x. [DOI] [PubMed] [Google Scholar]
- 19.Kushner J, Bradley G, Jordan R C. J Pathol. 1997;183:418–423. doi: 10.1002/(SICI)1096-9896(199712)183:4<418::AID-PATH946>3.0.CO;2-T. [DOI] [PubMed] [Google Scholar]
- 20.Shin D M, Voravud N, Ro J Y, Lee J S, Hong W K, Hittelman W N. J Natl Cancer Inst. 1993;85:971–978. doi: 10.1093/jnci/85.12.971. [DOI] [PubMed] [Google Scholar]
- 21.Tsuji T, Shrestha P, Yamada K, Takagi H, Shinozaki F, Sasaki K, Maeda K, Mori M. Virchows Arch A Pathol Anat Histopathol. 1992;420:377–383. doi: 10.1007/BF01600508. [DOI] [PubMed] [Google Scholar]
- 22.Zoeller J, Flentje M, Sinn P, Born I A. Anal Cell Pathol. 1994;7:77–88. [PubMed] [Google Scholar]
- 23.Fero M L, Randel E, Gurley K E, Roberts J M, Kemp C J. Nature (London) 1998;396:177–180. doi: 10.1038/24179. [DOI] [PMC free article] [PubMed] [Google Scholar]
- 24.MacDonald D G, Saka S M. Structural Indicators of the High Risk Lesion. Cambridge, U.K.: Cambridge Univ. Press; 1991. [Google Scholar]
- 25.Catzavelos C, Tsao M S, DeBoer G, Bhattacharya N, Shepherd F A, Slingerland J M. Cancer Res. 1999;59:684–688. [PubMed] [Google Scholar]
- 26.Kushner J, Bradley G, Young B, Jordan R C. J Oral Pathol Med. 1999;28:77–81. doi: 10.1111/j.1600-0714.1999.tb02000.x. [DOI] [PubMed] [Google Scholar]
- 27.Lisztwan J, Marti A, Sutterlüty H, Gstaiger M, Wirbelauer C, Krek W. EMBO J. 1998;17:368–383. doi: 10.1093/emboj/17.2.368. [DOI] [PMC free article] [PubMed] [Google Scholar]
- 28.Xu G, Livingston D M, Krek W. Proc Natl Acad Sci USA. 1995;92:1357–1361. doi: 10.1073/pnas.92.5.1357. [DOI] [PMC free article] [PubMed] [Google Scholar]
- 29.Coats S, Flanagan W M, Nourse J, Roberts J M. Science. 1996;272:877–880. doi: 10.1126/science.272.5263.877. [DOI] [PubMed] [Google Scholar]
- 30.St Croix B, Florenes V A, Rak J W, Flanagan M, Bhattacharya N, Slingerland J M, Kerbel R S. Nat Med. 1996;2:1204–1210. doi: 10.1038/nm1196-1204. [DOI] [PubMed] [Google Scholar]
- 31.Latres E, Chiarle R, Schulman B A, Pavletich N P, Pellicer A, Inghirami G, Pagano M. Proc Natl Acad Sci USA. 2001;98:2515–2520. doi: 10.1073/pnas.041475098. . (First Published February 20, 2001; 10.1073/pnas.041475098) [DOI] [PMC free article] [PubMed] [Google Scholar]
- 32.Peeper D S, Upton T M, Ladha M H, Neuman E, Zalvide J, Bernards R, DeCaprio J A, Ewen M E. Nature (London) 1997;386:177–181. doi: 10.1038/386177a0. [DOI] [PubMed] [Google Scholar]
- 33.Leone G, DeGregori J, Sears R, Jakoi L, Nevins J R. Nature (London) 1997;387:422–426. doi: 10.1038/387422a0. [DOI] [PubMed] [Google Scholar]
- 34.Park M, Rosai J, Nguyen H T, Capodieci P, Cordon-Cardo C, Koff A. Proc Natl Acad Sci USA. 1999;96:6382–6387. doi: 10.1073/pnas.96.11.6382. [DOI] [PMC free article] [PubMed] [Google Scholar]
- 35.Fearon E R. Science. 1997;278:1043–1050. doi: 10.1126/science.278.5340.1043. [DOI] [PubMed] [Google Scholar]
- 36.O'Hagan R C, Ohh M, David G, Moreno de Alboran I, Alt F W, Kaelin W G, DePinho R A. Genes Dev. 2000;14:2185–2191. doi: 10.1101/gad.827200. [DOI] [PMC free article] [PubMed] [Google Scholar]


