

ABSTRACT
In the present study, the effects of the probiotic Lactobacillus rhamnosus IMC 501 on the acquisition of oocyte maturational competence was examined in zebrafish (Danio rerio). L. rhamnosus administration induced the responsiveness of incompetent follicles (stage IIIa) to 17,20-dihydroxy-4-pregnen-3-one and their in vitro maturation. Acquisition of competence by the stage IIIa follicles was further validated by changes of lhr, mprb, inhbaa (activin betaA1), tgfb1, and gdf9 gene expression, which have recently emerged as key regulators of oocyte acquisition of maturational competence, and pou5f1 gene expression, which in other models has been shown to govern the establishment of developmental competence of oocytes. In addition, a DNA microarray experiment was conducted using the same follicles, and with relative gene ontology (GO) data analysis, the molecular effects of probiotic administration emerged. Molecular analysis using PCR-DGGE (denaturing gradient gel electrophoresis) approach, providing information about only the most abundant bacterial members of the microbial community, revealed that the probiotic was able to populate the gastrointestinal tract and modulate the microbial communities, causing a clear shift in them and specifically enhancing the presence of the lactic acid bacteria Streptococcus thermophilus. At the same time, PCR-DGGE analysis revealed that the probiotic was not directly associated with the ovaries. Finally, the effects of probiotic treatment on zebrafish follicle development were also analyzed by FPA (focal plane array) Fourier transform-infrared (FT-IR) imaging, a technique that provides the overall biochemical composition of samples. Changes were found above all in stage IIIa follicles from probiotic-exposed females; the modifications, observed in protein secondary structures as well as in hydration and in bands related to phosphate moieties, allowed us to hypothesize that probiotics act at this follicle stage, affecting the maturation phase.
Keywords: DNA array, fish reproduction, FPA FT-IR imaging, follicle maturation, gamete biology, gene expression, nutrition, oocyte maturation, PCR-DGGE, real-time PCR, zebrafish
The probiotic Lactobacillus rhamnosus IMC501 enhances the ability to acquire maturational competence of zebrafish follicles.
INTRODUCTION
Acquisition of maturational competence in oocytes represents a very important stage of oogenesis that signals the transition from the growth phase to the maturation phase. This process involves the ability of the follicle cells to produce maturation-inducing hormone (MIH) and the responsiveness of oocytes to MIH. The hormonal control of the acquisition of oocyte maturational competence has been studied by several authors, and the crucial role of luteinizing hormone (LH) on this phase has been reported in several fish species, including zebrafish [1–5].
In zebrafish, it has been more recently established that in addition to the actions of LH, local factors directly produced by the ovary play an important role in the acquisition of maturational competence. Among these molecules are members of the transforming growth factor-β (Tgfb) superfamily and others molecules, such as the membrane receptors of progesterone (Mprs) [3–8].
The zebrafish model provides several advantages for studying the regulation of follicle development and maturation. Zebrafish ovaries are asynchronous, containing follicles at all stages of development [9] as well as mature eggs. Growth and maturation of the oocyte occurs over a period of approximately 10 days [10, 11], and in laboratory conditions, eggs are spawned throughout the year [12]. In addition, the mapped genome of this model facilitates the use of molecular techniques to identify the regulation of target genes.
In zebrafish, oocytes at the midvitellogenic stage, referred as stage IIIa, with a diameter of between 0.31 and 0.51 mm, are known to be maturationally incompetent. In fact, they are unable to undergo maturation in response to MIH. Only fully grown, vitellogenic oocytes (stage IIIb), with a diameter of between 0.52 and 0.70 mm, acquire the ability to respond to MIH [1, 2], which by binding directly to membrane receptors on the surface of fully grown oocytes leads to the final oocyte maturation.
Using zebrafish as a model, our group recently found evidence for the positive effect of a probiotic, Lactobacillus rhamnosus, on reproduction; we demonstrated the induction of oocyte maturation and the increase of fecundity after probiotic administration [13–16]. These results led us to hypothesize that probiotic could induce earlier oocyte maturation. Therefore, in the present study, we investigated the role of L. rhamnosus IMC 501 administration on the acquisition of oocyte maturational competence in zebrafish.
The present study had several objectives. The first was to determine whether L. rhamnosus administration could induce the ability of the stage IIIa follicles to respond to MIH. The second was to provide an overview of the transcriptome follicles (stages IIIa and IIIb) from both probiotic-treated and control females by DNA microarray analysis, highlighting specifically the pathways that are affected, but also those that are unaffected, by the probiotic treatment.
The third objective was to examine whether probiotic treatment in stage IIIa and IIIb follicles modulates the transcription of specific mRNAs involved in the acquisition of competence. To this end, changes in gene expression of transforming growth factor-β1 (tgfb1) and growth differentiation factor 9 (gdf9), which are known to inhibit follicle maturation [8, 17], were analyzed. In addition, expression of activinβA1 (inhbaa), which stimulates oocyte maturation [10, 18]; LH receptor (lhr); β isoform of membrane progestin receptor (mprb), which mediates the effects of MIH on oocyte maturation; and pou5f1 were also examined.
The fourth objective was to assess the impact of the probiotic on the gastrointestinal (GI) microbiome, an important microbial population that is known to influence host development, stress responses, nutrition, immunity, and disease resistance [19, 20] and to identify any potential microbial populations associated with the ovaries using PCR-DGGE (denaturing gradient gel electrophoresis). Finally, the last objective was to pinpoint, using FPA (focal plane array) Fourier transform-infrared (FT-IR) imaging, the modifications occurring in the biochemical composition of stage IIIa and IIIb follicles as a result of probiotic administration [16, 21, 22].
MATERIALS AND METHODS
Animals and Probiotic Administration
Adult Danio rerio (zebrafish) females, purchased from a commercial dealer (Acquario di Bologna), were kept in aquaria at 28°C with oxygenated water. Fish were fed four times daily, twice with commercial food (Vipagran) and twice with Artemia salina. Eggs laid by parental fish were kept and grown to approximately 6 mo of age to test the effects of the probiotic on reproductive processes.
Two experimental groups were evaluated: a control group, which was fed a commercial diet only, and a probiotic-treated group, which was fed the commercial diet containing the lyophilized probiotic at a final concentration of 106 colony-forming units/g for 10 days. To exclude the possible effect of feeding rate on reproduction and to focus only on possible probiotic effects on reproduction, the fish were underfed (1.5%–2% of body weight of commercial diet per day). In addition, to avoid any possible external contaminations, both groups (control and probiotic-treated) never received Artemia sp. during the 10 days of treatment. The experiment was conducted in triplicate, and for each replicate tank, the final housing density was 15 females and 5 males. The probiotic strain used was L. rhamnosus IMC 501, provided by Synbiotec s.r.l., and was mixed into the diet just before providing the food to the fish.
After 10 days of treatment, 10 females from each experimental group were killed by a lethal overdose of anesthesia (500 mg/L of 3-aminobenzoic acid ethyl ester [MS-222] buffered to pH 7.4; Sigma). Ovaries from each of the experimental groups were teased into separate follicles using transfer pipettes (Samco Scientific Corp.) without trypsinization. Therefore, follicles were separated into different maturational stages according to their diameters as determined with an ocular micrometer under a dissecting microscope. Stage IIIa (diameter, 0.31–0.51 mm) and stage IIIb (diameter, 0.52–0.70 mm) follicles were sampled for in vitro maturation, molecular, and FT-IR assays.
Procedures were performed in accordance with the guidelines on the handling and training of laboratory animals by the Universities Federation for Animal Welfare (UFAW) and with the Italian animal welfare legislation (D.L. 116/92).
DNA Array
RNA extraction, fluorescent target labeling and microarray hybridizations.
Total RNA was extracted from samples composed of 25 follicles (stage IIIa or IIIb follicles, separately), were mechanically isolated from all experimental groups using the Minikit RNAeasy (Qiagen) extraction kit following the manufacturer's protocol. Total RNA extracted was eluted in 25 μl of RNase-free water. Total RNA was treated with DNase (10 IU at 37°C for 10 min; MBI Fermentas), and final RNA concentrations were determined by absorbance readings (optical density [OD]) at 260 nm using an ND-1000 (Nanodrop). RNA was further assessed for integrity with the 6000 Nano LabChip assay (Agilent). Total RNA (100 ng) was converted into fluorescently labeled Cy3 cRNA using the Low RNA Input Fluorescent Linear Amplification Kit (Agilent). Fluorescent targets were purified to remove unincorporated nucleotides using RNeasy (Qiagen). Absorbance (OD) at 260 nm was used to quantify the cRNA concentrations, and absorbance at 550 and 650 nm was used to measure the efficiency of Cy3 dye incorporation. An incorporation efficiency of 9 pmol/μg or greater was deemed to be necessary before proceeding with hybridization. The Agilent Zebrafish Oligo Microarray V1, containing 21 495 probes representing all existing predicted zebrafish genes from the most recent public databases, such as RefSeq, Unigene, and TIGR Gene Index, was used. Each array also contained quality-control probes for monitoring any experimental variations. For each sample, 1 μg of fragmented cRNA was hybridized to the zebrafish microarray in accordance with single-color Agilent hybridization protocols. Data were collected using an Agilent Microarray Scanner and Feature Extraction Software V10.5.
Statistical and bioinformatic analysis of microarray data.
Array data have been deposited in the EBI ArrayExpress database (accession number pending). Statistical analysis of our microarray experiment was carried out in three steps: 1) normalization of microarray data, 2) sorting of genes according to interest, and 3) statistical analysis of pathways and gene ontology (GO) terms represented by the sorted list of genes. For normalization of microarray data, the Agilent Feature Extraction Software (v10.5) provides high-quality, expression-level reports for Agilent microarrays. Nevertheless, these data must be normalized to remove subtle biases due to variations in hybridization conditions or, perhaps, manufacture. We normalized all samples simultaneously using a multiple-loess technique as described previously [23].
For sorting the genes according to interest, we borrowed ideas from Cole et al. [24] and their software package Focus. The interest statistic reflects a biologist's understanding that a gene with a greater fold-change (in absolute value) than other genes is potentially the more interesting one. Also, given two genes with the same fold-changes, the gene with a higher expression level (and, therefore, the higher absolute change) is the more interesting one.
For statistical analysis of GO terms, we note that the sorted list of genes obtained in step 2 does not imply statistical significance for any individual gene; however, it does contain information on which groups of genes are responsible for the studied phenotype. We calculated P-values for groups of genes by performing GO analysis (http://www.geneontology.org/). All GO terms define groups of genes for which we calculate P-values. Because of the hierarchical structure of the GO database (it is a directed acyclic graph in which the nodes are GO terms), every term contains all the genes of its daughter terms, and the daughter terms are not independent of the parent term(s). It is therefore possible and, indeed, even likely that a term may appear to be statistically significant because its parent or daughter term is statistically significant. It is not clear, however, which term, or if both, should be reported. The parent-daughter dependence poses a problem for a purist's P-value interpretation, but in practice, it does not matter whether the same biological process gets reported multiple times. A heuristic method that eliminates the problem of parent-daughter dependence on the GO graph was proposed previously [25]. The parent-daughter dependence means the same biological process may get reported multiple times, which makes it difficult to meaningfully adjust the P-values for multiple testing. We find that a simple Bonferroni adjustment is somewhat useful, even though it is very conservative.
Real-Time PCR
A total amount of 1 μg of RNA was used for cDNA synthesis, employing iScript cDNA Synthesis Kit (Bio-Rad). PCRs were performed with SYBR green method in an iQ5 iCycler thermal cycler (Bio-Rad). Triplicate PCR reactions were carried out for each sample analyzed. The reactions were set on a 96-well plate by mixing; each reaction mixture consisted of 2 μl of diluted (1:10) cDNA and 10 μl of 2× concentrated iQ SYBR Green Supermix (Bio-Rad) containing SYBR Green as a fluorescent intercalating agent, 0.3 μM of forward primer, and 0.3 μM of reverse primer. The thermal profile for all reactions was 3 min at 95°C and then 45 cycles of 20 sec at 95°C, 20 sec at 60°C, and 20 sec at 72°C. Fluorescence monitoring occurred at the end of each cycle. Additional dissociation-curve analysis was performed and, in all cases, showed a single peak.
Both actb and arp were used as housekeeping genes in each sample to standardize the results by eliminating variation in mRNA and cDNA quantity and quality. No amplification product was observed in negative controls, and no primer-dimer formation was observed in the control templates. The data obtained were analyzed using the iQ5 optical system software version 2.0 (Bio-Rad) including GeneEx Macro iQ5 Conversion and genex Macro iQ5 files. Modification of gene expression is represented with respect to the control sampled at the same time as the treatment. The primer sequences, designed using Primer3 (v. 0.4.0) software were as follows: lhr forward, 5′-ggcgaaggctagatggcacat-3′; lhr reverse, 5′-tcgccatctggttcatcaata-3′; inhb forward, 5′-caacttagatggacacgctg-3′; inhb reverse, 5′-gtggatgtcgaggtcttgtc-3′; mprb forward, 5′-caacgagctgctgaatgtgt-3′; mprb reverse,-5′gggccagttcagagtgagac-3′; tgfb1 forward, 5′-tcgctttgtctccaaggact-3′; tgfb1 reverse, 5′-tgcaagagagttgccatttg-3′; gdf9 forward, 5′-cgaccacaaccacctctctcc-3′; gdf9 reverse, 5′-gggactgagtgctggatgcc-3′; pou5f1 forward, 5′-caaattacggcccaagctaa-3′; pou5f1 reverse, 5′-cagaatcactgcatcctcca-3′; actb forward, 5′-ggtacccatctcctgctccaa-3′; actb reverse, 5′-gagcgtggctactccttcacc-3′; arp forward, 5′-ctgaacatctcgcccttctc; and arp reverse, 5′-tagccgatctgcagacacac-3.′
Western Blot Analysis
For the Mprb assays, stage IIIa and IIIb follicles from each of the experimental groups were electrophoresed and transferred into polyvinylidene fluoride as described previously [26]. Briefly, 20 μg of each protein sample were separated using a 4% stacking gel and a 10% separating SDS-PAGE and then electroblotted onto a Bio-Rad filter using a Bio-Rad Mini Trans-Blot Electrophoretic Transfer Cell. The transfer was carried out for 2 h at 250 mA at 4°C using 25 mM Tris base, 192 mM glycine, and 20% methanol as electrode solution. The membrane was soaked in 5% Nonidet-P40 for 1 h to remove SDS and then incubated overnight at 4°C with 2% bovine serum albumin (Sigma) in PBS buffer. For the Mprb assay, the primary antibody (anti-Mprb), diluted 1:1000, was kindly supplied by Dr. Yong Zhu at the Department of Biology, East Carolina University, Greenville, North Carolina, USA. Anti-β-tubulin antibody (l g/ml; Gene Tex, Inc.) was used to normalize the sample loading. The antibody reaction was visualized with ECL-PLUS (GE Healthcare) chemiluminescent reagent for Western blot. The densitometric analysis was performed by ImageJ software (U.S. National Institutes of Health, Bethesda, MD) for Windows.
In Vitro Follicle Maturation Assay
In vitro maturation assays were conducted as described previously [17, 27]. Briefly, stage IIIa and IIIb follicles derived from both control and probiotic-treated groups were incubated in 1 ml of 60% Lebovitz L-15 Medium (Gibco, Invitrogen) containing 200 μg/L of gentamicin (Sigma Aldrich) at 25°C in the dark in 24-well culture plates. Both stage IIIa and IIIb follicles isolated from control and probiotic-treated ovaries were incubated separately in L15 and in L15 plus MIH (1 μg/ml). The MIH used here was 17α,20β-dihydroxyprogesterone (100 ng/ml; Sigma Aldrich). Maturation was scored after 18 h of incubation. Follicles that underwent germinal vesicle breakdown (GVBD) could be identified by their acquired translucency. Each experiment was conducted in four wells, with approximately 20 follicles/well, and all experiments were repeated three times.
PCR-DGGE Analysis of GI Tract and Ovarian Microbiota
At the end of the trial, six individual fish per tank were sampled aseptically to isolate the ovaries and GI material. These samples were pooled by tank to provide three samples of ovaries and three samples of the GI tract, each derived from six individuals, for the assessment of probiotic populations and the impact of such potential populations on indigenous microbial populations. DNA extraction, PCR amplification of the 16S rRNA V3 region, and a 40%–60% DGGE were conducted as described previously [28]. A known sample of pure L. rhamnosus culture was processed in the same manner to allow the identification of the probiotic in the DGGE fingerprints. Selected bands of interest, including the presumptive L. rhamnosus phylotype, were excised. DNA was eluted from the excised bands in 50 μl of molecular-grade water at 4°C overnight before a second PCR amplification. The PCR product was cleaned (QIAquick PCR Purification Kit; Qiagen) and sequenced by GATC Biotech. The nucleotide sequence (GenBank accession nos. JF431929 to JF431934) were then submitted to a BLAST search in GenBank (http://blast.ncbi.nlm.nih.gov/Blast.cgi) to retrieve the closest known alignment identities for the partial 16S rRNA sequences.
FT-IR Measurements
The FT-IR measurements were carried out at the infrared beamline SISSI@ELETTRA synchrotron [29] using a Bruker VERTEX 70 interferometer coupled with a Hyperion 3000 Vis-IR microscope and equipped with a liquid nitrogen-cooled FPA detector (detector area, 64 × 64 pixels). Because of the follicle dimensions, representative areas were chosen for IR imaging in transmission mode at room temperature using a 15× condenser/objective (pixel resolution, ∼2.6 μm). Each IR image (OPUS 6.5 software package; Bruker), acquiring simultaneously groups of 4096 spectra, was collected by averaging 128 scans for each detector pixel, with a spectral resolution of 4 cm−1, rationing the background single-channel image against the sample single-channel image. All the samples were compared with independent trials. Total absorbance cartograms, representing the total intensity of the infrared absorption, were generated for each sample by integrating the total area between 1800 and 900 cm−1 (not shown).
Average spectra were extracted from IR images by using OPUS 6.5, with the number of selected spectra ranging from 4096 to 16 384. All the average spectra were two-point baseline linear-fitted in the spectral range of 4000 to 900 cm−1 and vector normalized [30].
To better evidence small changes observed in normal spectra, the second derivative procedure was applied. At the same time, peak fitting procedure was useful to discriminate in a convoluted band (like amide I and II) the various subcomponents and to evaluate the corresponding absorbance intensity of a single band. Using the GRAMS/AI 7.02 (Galactic Industries, Inc.) software package, peak fitting was performed on average spectra (interpolated in the range of 1775 to 1580 cm−1 and two-point baseline linear-fitted); to identify the underlying component bands, the number of peaks together with their center values were carefully individuated according to second derivative results and fixed before running the iterative process to obtain the best reconstructed curve (residual near zero). Mean values of areas and wavelength were calculated for each component peak. Attribution of the bands was done as described in the literature [31–34].
For data handling, the following software packages were used: Opus 6.5, Spectrum 6.3.1 (PerkinElmer), and GRAMS/AI 7.02.
Statistical Analysis
Gene expression, protein levels, and GVBD rate data are presented as the mean ± SD for all experiments. Significant differences between treatment groups were determined with a factorial (one-way) ANOVA followed by Bonferroni multiple-comparison test using the statistical software package Prism5 (GraphPad Software, Inc.). Statistical significance was accepted at P < 0.05.
The DGGE banding patterns were transformed into presence/absence matrices for assessment between treatments using Quantity One software (V4.6.3; Bio-Rad). Dice coefficients of similarity were calculated to compare fingerprints, and band intensities were measured. Similarity percentages (SIMPER), a one-way analysis of similarity (ANOSIM), and a Bray-Curtis similarity matrix were used to represent the relative similarities between treatments and replicates using Primer V6 [35]. The species richness was assessed using the Margalef d measure of richness, and species diversity was assessed using the Shannon-Weaver index. These parameters were compared using an independent sample t-test (SPSS 17.0 software; IBM, Chicago, IL).
RESULTS
Stimulation of GVBD
In a series of four experiments, each replicated three times, very few stage IIIa follicles isolated from control or probiotic-treated females underwent spontaneous maturation (3% ± 1.11% and 5% ± 1.51%, respectively) after 18 h in the absence of MIH. In contrast, a much higher proportion of control-derived stage IIIa follicles underwent maturation (GVBD) when exposed to MIH for 18 h (19.9% ± 1.7%), whereas a significantly higher GVBD rate (41.8% ± 2.9%) was reached by stage IIIa follicles isolated from probiotic-treated females when exposed to MIH.
The stage IIIb follicles isolated from the ovaries of probiotic-treated females incubated with MIH showed the greatest rate (95.7% ± 4.1%) of GVBD (Fig. 1). In contrast, only 69.8% ± 3.8% of stage IIIb follicles isolated from the control females incubated with MIH showed GVBD.
FIG. 1.

Rate (%) of GVBD in D. rerio stage IIIa and IIIb follicles isolated from control group ovaries incubated in L15 (CTRL) and in L15 plus MIH (1 μg/ml; MIH) and in D. rerio stage IIIa and IIIb follicles isolated from treated group ovaries incubated in L15 (PROBIO) and in L15 plus MIH (PROBIO+MIH; n = 20). Raw data are presented as the mean ± SD (error bars). Different letters indicate statistically significant differences (P < 0.05, ANOVA followed by Bonferroni multiple-comparison test) after arcosin transformation of raw data.
GO Analysis
Numerous prominent and putatively regulated functions and processes were revealed in the present study to be regulated by L. rhamnosus during follicle development. In the control group, on going from stage IIIa to stage IIIb and, therefore, during the normal progression of maturational competence, several genes involved in Biological Processes, such as multicellular organismal development, organ and anatomical structure development, regulation of cell growth, and regulation of transcription, were modulated. In addition, in the same samples, the GO analysis of Molecular Function also revealed that gene families involved in transcription, heme binding, tetrapyrrole binding, and iron binding were modified (Table 1).
TABLE 1.
List of Gene Ontology Terms from Biological Process and Molecular Function that are altered significantly between untreated zebrafish stage IIIa and stage IIIb follicles.

Comparing stage IIIa follicles from control versus probiotic-treated females, it was found that the probiotic administration modulated several genes belonging to Biological Processes involved in the generation, transmission, reception, or interpretation of a signal (e.g., signal transmission, signal transduction, and response to chemical stimuli). Also interesting is its effect in regulating transcripts associated with development (regulation of anatomical structure size) and regulation of biological quality, which is involved in any process that modulates the frequency, rate, or extent of a measurable attribute of an organism or part of an organism, such as size, mass, shape, and color (GO definition) (Table 2).
TABLE 2.
List of Gene Ontology Terms from Biological Process and Molecular Function that are altered significantly in stage IIIa follicles treated with probiotic.

The GO analysis of Molecular Function in stage IIIa follicles revealed that L. rhamnosus regulated the expression of two main groups of genes: 1) those involved in the selective interaction of a molecule with one or more specific sites on another molecule, such as heme binding, tetrapyrrole binding, iron ion binding, GTP binding, and guanyl ribonucleotide binding; and 2) those involved in oxidoreductase activity and mono-oxygenase activity (Table 2).
In stage IIIb follicles, both Biological Process and Molecular Function highlighted the regulation of many genes involved in transcription, including regulation of transcription DNA-dependent (Biological Process) and transcription factor activity, transcription regulator activity, and sequence-specific DNA binding (Molecular Function) (Table 3). Moreover, the Biological Process analysis also revealed a regulation of transcripts involved in development: developmental process, multicellular organismal development, anatomical structure development, and organ morphogenesis.
TABLE 3.
List of Gene Ontology Terms from Biological Process and Molecular Function that are altered significantly in stage IIIb follicles treated with probiotic.

Effects of L. rhamnosus Administration on lhr and inhbaa Gene Expression in Stage IIIa and IIIb Follicles
The quantitative measurements of lhr and inhbaa mRNA are shown in Figure 2. Stage IIIa and IIIb follicles isolated from probiotic-treated females showed significantly higher lhr and inhbaa mRNA levels with respect to follicles isolated from the control. In particular, the levels of these genes in stage IIIa follicles from probiotic-treated females were similar to those found in stage IIIb follicles isolated from control females.
FIG. 2.

lhr (top) and inhbaa (bottom) mRNA levels normalized against actb and arp genes in stage IIIa and IIIb follicles of control (CTRL) and probiotic-treated (PROBIO) fish (n = 10). Data are presented as the mean ± SD (error bars). Different letters indicate statistically significant differences (P < 0.05; ANOVA followed by Bonferroni multiple-comparison test).
Effects of L. rhamnosus Administration on mprb Gene Expression and Protein Levels in Stage IIIa and IIIb Follicles
The stage IIIa and IIIb follicles isolated from probiotic-treated females showed significantly higher mprb mRNA levels compared to follicles isolated from control females. In particular, stage IIIa follicles from probiotic-treated females reached the same levels found in stage IIIb follicles isolated from control females (Fig. 3).
FIG. 3.

mprb mRNA (top) normalized against actb and arp genes and protein levels (bottom) normalized against β-tubulin in stage IIIa and IIIb follicles of control (CTRL) and probiotic-treated (PROBIO) fish (n = 10). Data are presented as the mean ± SD (error bars). Different letters indicate statistically significant differences (P < 0.05, ANOVA followed by Bonferroni multiple-comparison test).
Regarding the Mprb protein, as evidenced by Western blot analysis, a similar trend of the gene expression was found. However, the increase at protein levels was more modest in respect to the gene expression (Fig. 3).
Effects of L. rhamnosus Administration on tgfb1 and gdf9 Gene Expression in Stage IIIa and IIIb Follicles
The quantitative measurements of tgfb1 and gdf9 mRNA are reported in Figure 4. Stage IIIb follicles isolated from probiotic-treated females showed significantly lower tgfb1 mRNA levels with respect to follicles isolated from control females. Regarding stage IIIa follicles, a significant decrease of gdf9 gene expression was observed in follicles isolated from probiotic-treated females. The levels were similar to those found in stage IIIb follicles isolated from the controls.
FIG. 4.

tgfb1 (top) and gdf9 (bottom) mRNA levels normalized against actb and arp genes in stage IIIa and IIIb follicles of control (CTRL) and probiotic-treated (PROBIO) fish (n = 10). Data are presented as mean ± SD (error bars). Different letters indicate statistically significant differences (P < 0.05, ANOVA followed by Bonferroni multiple-comparison test).
Effects of L. rhamnosus Administration on pou5f1 Gene Expression in Stage IIIa and IIIb Follicles
The quantitative measurements of pou5f1 mRNA are shown in Figure 5. Stage IIIa and IIIb follicles isolated from probiotic-treated females showed significantly higher pou5f1 mRNA levels with respect to follicles isolated from control females. In particular, the expression of this gene in stage IIIa follicles from the probiotic-treated females was similar to that found in stage IIIb follicles isolated from control females.
FIG. 5.

pou5f1 mRNA levels normalized against actb and arp genes in stage IIIa and IIIb follicles of control (CTRL) and probiotic-treated (PROBIO) fish (n = 10). Data are presented as the mean ± SD (error bars). Different letters indicate statistically significant differences (P < 0.05, ANOVA followed by Bonferroni multiple-comparison test).
Effects of L. rhamnosus Administration on GI Tract and Ovarian Microbiota
Lactobacillus rhamnosus was present in all replicates of the probiotic-treated group and was absent in all replicates of the control group. The presence of the probiotic had a clear and distinctive effect on the microbial communities, causing a shift in microbial fingerprints that is reflected by the dendrogram in Figure 6; the replicates of the two treatments are clustered into two distinct groups, characterized by low similarity of approximately 50% between the groups. Despite the large dissimilarity between the groups, no significant differences were observed in terms of microbial community ecological parameters (Table 4). However, trends toward differences were observed in respect to microbial richness (P = 0.105), evenness (P = 0.138), and diversity (P = 0.112). Additionally, the ANOSIM showed a trend toward significance (P = 0.10), with an R value of one (indicating that the replicates within the groups are more similar to one another than they are to the replicates of the other group).
FIG. 6.

PCR-DGGE profiles and dendrogram of the GI microbial populations of zebrafish. Each lane represents replicates of the control (C1–C3) or the probiotic-treated (P1–P3) fish. Lane Lr represents the migration point of a known L. rhamnosus culture. The location of sequenced phylotypes is also presented.
TABLE 4.
Microbial community analysis from PCR-DGGE fingerprints of the GI microbiota zebrafish from each group (n = 3 per group).a

The PCR-DGGE fingerprints revealed, as supported by the high dissimilarity between the groups, that the impact of the probiotic on the GI populations affected individual phylotypes (bands, which represent presumed individual bacterial species/strains) either by suppressing them (to nondetectable levels, in some cases) or by stimulating the presence of certain phylotypes that were absent or nondetectable in the other group. A clear example was the low to undetectable levels of the phylotype JF431931, identified as Streptococcus thermophilus (Table 5), from the control replicates, which was clearly stimulated by the presence of the probiotic (Fig. 6). Other phylotypes sequenced are displayed in Table 5. PCR-DGGE analysis showed the ovaries to be devoid of L. rhamnosus; indeed, these samples were devoid of any detectable bacterial rRNA (data not shown).
TABLE 5.
Isolated bacterial bands and their closest relatives (BLAST) from PCR-DGGE of the GI communities of zebrafish.

Effects of L. rhamnosus Administration on Macromolecular Building of Stage IIIa and IIIb Follicles
Average vibrational spectra of stage IIIa and IIIb follicles (control and probiotic-treated groups) in the spectral range of 4000 to 900 cm−1 and their corresponding second derivatives (DII; five-point smoothing) in the range of 1800 to 900 cm−1 are reported in Figure 7. The spectra corresponding to stage IIIb follicles of both control and probiotic-treated groups were similar, whereas changes were observed in spectra related to stage IIIa follicles. In particular, modifications in amide I band shape and in the bands associated with phosphate moieties were found in the spectrum corresponding to stage IIIa oocytes in the probiotic-treated group with respect to stage IIIa oocytes in the control group.
FIG. 7.

Left) Average spectra of stage IIIa and IIIb follicles in the range of 4000 to 900 cm−1. Right) Corresponding second derivatives (five-point smoothing) in the range of 1800 to 900 cm−1 (stage IIIa probiotic-treated [P], stage IIIb control [C], and stage IIIb P spectra were shifted along the y-axis; – · · – control; ——, probiotic treated).
The analysis of amide I, a convoluted band strictly related to protein secondary structures, is considered crucial to approach the proteic pattern of biological samples. In our case, because the spectroscopic data were acquired on the whole follicles, this band was affected by either cytoplasmic or membrane proteins. To ascertain amide I component bands, the peak fitting procedure (GRAMS/AI 7.02) was applied on average spectra in the range of 1775 to 1580 cm−1, and the areas of the component bands were calculated. In all specimens, it was possible to distinguish intermolecular (1692 ± 2 and 1615 ± 2 cm−1) from intramolecular (1679 ± 1 and 1629 ± 1 cm1) β structures as well as three-turn helix (1667 ± 1 cm−1), α-helix (1655 ± 2 and 1646 ± 2 cm−1), and random coil (1639 ± 1 cm−1) components.
By analyzing the total areas relative to helical, β, and random coil components, the following considerations were drawn: First, in both groups, on maturation, helical and random coil structures increased with respect to β structures. Second, stage IIIa follicles derived from probiotic-treated females showed helical and β structures with values intermediate between those found in stage IIIa and IIIb follicles from the control group. Third, stage IIIb follicles from both control and probiotic-treated groups exhibited similar values for helical and β structures. Fourth, the random coil moiety was always higher in follicles of probiotic-treated females (Table 6).
TABLE 6.
Percentages of helical, β, and random coil structures in amide I band (1775–1580 cm−1) for IIIa and IIIb follicles from control and probiotic-treated females.

On maturation, an increase in hydration was observed in stage IIIa follicles of the probiotic-treated group, in which the band at 1157 cm−1 (νC-OH) was prevalent with respect to that at 1167 cm−1 (νC-OP). In stage IIIa follicles of the control group, an inverted trend was observed (Fig. 8).
FIG. 8.
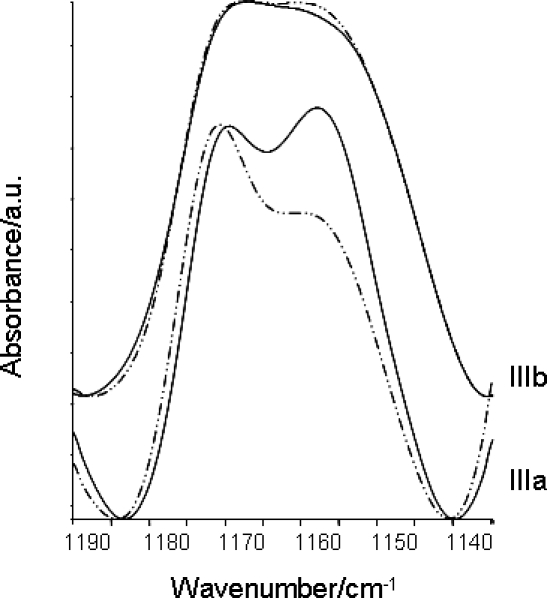
Average spectra of stage IIIa and IIIb follicles (– · · –, control; ——, probiotic treated) in the range of 1190 to 1130 cm−1 (stage IIIb spectra were shifted along the y-axis).
The hydration increase observed in stage IIIa follicles of the probiotic-treated group was also confirmed by the analysis of the asymmetric and symmetric stretching modes of phosphates at 1240 and 1085 cm−1, respectively (DII spectra in the range of 1275 to 1045 cm−1) (Fig. 9). The asymmetric stretching mode was composed by two bands at 1245 cm−1 (non-hydrogen-bonded) and 1236 cm−1 (hydrogen-bonded): In stage IIIa follicles isolated from control females, these two components showed the same intensity, whereas in stage IIIa follicles isolated from probiotic-treated females, the latter component was prevalent. The same trend was also observed in the symmetric stretching mode that, in the spectrum related to stage IIIa follicles isolated from probiotic-treated females, resulted in a split into two bands at 1089 and 1082 cm−1 (non-hydrogen- and hydrogen-bonded, respectively).
FIG. 9.

Second derivative spectra (five-point smoothing) of stage IIIa control (C) and probiotic-treated (P) follicles in the range of 1275 to 1045 cm−1 (– · · –, control; ——, probiotic treated; stage IIIa P spectrum was shifted along the y-axis).
DISCUSSION
Recent research on the molecular biology and genomics of probiotics has focused on the interaction of gut microbiota with the immune system [36], brain development [37], potential as an anticancer agent [38], and potential as a biotherapeutic agent in many diseases [39]. Very recently, our group observed a positive role of a probiotic, L. rhamnosus IMC 501, on fecundity and on endocrine and paracrine control of follicle development in zebrafish females [13–15]. Ten-day administration of this bacterial species affected the number of ovulated eggs in vivo and the GVBD rate in vitro [13]. In addition, using FT-IR microspectroscopy analysis to investigate ovarian sections, we clearly observed molecular changes induced by probiotic administration on follicle molecular building, such as the increase of water uptake and phosphorylation processes, together with the modification of protein secondary structures. However, no direct evidence for the effect of this probiotic on the acquisition of maturational competence in the oocyte was found.
In the present investigation, we studied the possible role of L. rhamnosus on zebrafish oocyte competence. We showed that 10-day administration of L. rhamnosus significantly enhanced responsiveness of stage IIIa follicles to MIH. In addition, and to our knowledge for the first time, we performed a DNA microarray experiment to elucidate the biological processes and molecular functions modulated by L. rhamnosus that may have been involved in the acquisition of maturational competence.
The GO analysis revealed the modulation of genes implicated in any biological process involved in the generation, transmission, reception, or interpretation of a signal and in a change in state or activity of a cell or an organism (e.g., in terms of movement, secretion, enzyme production, or gene expression) as a result of a stimulus that, in this case, was the probiotic administration. After probiotic administration, we found in stage IIIa follicles a modulation of several gene family members involved in heme, tetrapyrrole, and ion binding, which are modulated on going from stage IIIa to stage IIIb during the normal progression of maturational competence. In addition, probiotic treatment in stage IIIb follicles modulated several genes belonging to Biological Processes and Molecular Functions, such as multicellular organismal development and process, anatomical structure development, and transcription activity regulation, which also are modulated during normal follicle development. These results can better explain the mechanisms through which L. rhamnosus could stimulate still-incompetent oocytes (stage IIIa) to become responsive to MIH, inducing in the oocyte the prerequisite changes for the next developmental stage and future embryonic stages.
The quantitative PCR results revealed that the probiotic treatment induced lhr, inhbaa, and mprb levels and concomitantly reduced tgfb1 and gdf9 mRNA levels in stage IIIa follicles in comparison with the control group. These observations suggest that L. rhamnosus has the capability to give advance acquisition of oocyte maturational competence by modulating the gene and protein levels of some molecules that have recently emerged as regulators of this delicate phase at both endocrine and local/paracrine levels. The effect of LH on the acquisition of oocyte maturational competence has been reported in several fish species [2, 40, 41], and the increase of the mRNA of its receptor indicates a major responsiveness of the follicles to the LH produced and released by the pituitary. At the same time, activin is an important member of the transforming growth factor superfamily that has been extensively studied in mammals [42] and zebrafish [8], and its role in regulation of the development of oocyte maturational competence and in stimulation of the final maturation of full-grown oocytes in the maturational stage has been demonstrated [1, 4, 8, 43].
In accordance with the levels previously reported by other authors [4, 8], the mprb mRNA and protein levels significantly increase in stage IIIb control follicles compared to stage IIIa. The stage IIIa follicles isolated from probiotic-treated females showed a major capability to respond to MIH by significantly enhancing the mRNA and protein levels of its membrane receptor. At the same time, these increases were associated with the down-regulation of local factors, such as tgfb1 and gdf9 genes. These two intraovarian molecules inhibit follicle maturation by blocking the resumption of meiosis [8, 17], acting at multiple sites. In particular, tgfb1 suppresses both human chorionic gonadotropin- and MIH-induced oocyte maturation [44] by regulating the expression of several key genes in the maturation pathway, including lhr and mprb [45]. The decrease in mRNA levels of these genes after probiotic administration is in accord with previous results found in the whole ovary [13].
In addition, pou5f1gene expression was evaluated in stage IIIa and IIIb follicles, to our knowledge for the first time. pou5f1 is a class V POU domain transcription factor expressed in pluripotent embryonic and germ line cells. In mammals, pou5f1 is critical to maintain pluripotency of the inner cell mass and survival of germ cells [46–48], and it is a key regulator of embryonic development [49]. Recently, in mice, it emerged that Pou5f1 was also involved on the molecular events that govern the establishment of the developmental competence of mouse oocytes [50, 51].
Patterns of pou5f1 mRNA and protein expression have been well characterized during embryonic development in zebrafish and medaka [52, 53] and in primordial germ cells and adult gonads in medaka [53]; to our knowledge, however, the mRNA levels of this gene have never been evaluated in follicles at different stages of development. In control females of the present study, the pou5f1 mRNA levels significantly increased from stage IIIa to IIIb follicles, suggesting that this signal may be involved in the acquisition of maturational competence. The increase in pou5f1 mRNA levels in both stage IIIa and stage IIIb follicles due to probiotic administration may be related to enhanced fecundity as previously observed [13–15] as well as to advancing the acquisition of maturational competence.
For a deeper insight regarding the acquisition of maturational competence due to probiotic administration, FPA FT-IR imaging was applied to intact stage IIIa and IIIb follicles. FT-IR imaging is a powerful technique to study the composition and the macromolecular chemistry of cells and tissues, providing a biochemical fingerprint of samples under investigation, and it represents an objective and promising tool to study oocyte building [16, 19, 22]. The use of the bidimensional FPA detector was fundamental for the fast acquisition of chemical images at high spatial resolution and good signal:noise ratio [54]. Using bidimensional IR detectors, a large number of microspectra can be acquired, simultaneously retrieving spatially resolved information on the biochemical and structural features of the sample. In detail, 4096 microspectra were collected in a sample area of 170 × 170 μm2 using a 64- × 64-pixel FPA detector, therefore achieving a pixel resolution of approximately 2.6 μm. The data obtained in the current study showed significant differences between stage IIIa follicles isolated from probiotic-treated females with respect to controls.
In particular, the spectral data relative to the amide I band (peak fitting procedure) pinpointed a modification of protein secondary structures in follicles isolated from probiotic-treated females with respect to those isolated from control females, probably due to the de novo synthesis or uptake of proteic components into the follicles [16, 22]. At the same time, changes in the 1167/1157 cm−1 band ratio were attributable to an increase of the hydration process [16, 22], because under normal conditions this process starts in late stage IIIb/IV follicles, this indicates an early water uptake in stage IIIa follicles from probiotic-treated females. This behavior was also confirmed by the analysis of the asymmetric and symmetric stretching modes of phosphates, at 1240 and 1085 cm−1, respectively, showing an increase in hydrogen bonding.
The microbiological results within the present investigation indicate that the dietary application of the lactic acid bacteria (LAB) L. rhamnosus was also able to elevate the abundance of other indigenous LAB species, such as S. thermophilus. Molecular analysis using PCR-DGGE revealed that the probiotic was able to populate the GI tract and modulate the microbial communities, causing a clear shift in those communities. Analysis of the ovaries revealed that the probiotic was not directly associated with the ovaries, excluding a possible local, direct role of the probiotic in the ovary and indicating that systemic effects were indirectly mediated, most likely by host-microbe (e.g., probiotic and/or S. thermophilus) interactions in the GI tract. These results are in accordance with, and greatly support, data obtained in a previous study [13], which offered evidenced that at both the gut and the brain level, the probiotic treatment induced a significant increase in leptin gene expression, a key hormone in energy homeostasis and neuroendocrine functions. In that same study, this increase was correlated with a significant rise of kiss1, kiss2, and gnrh3 gene expression in the brain. Taken together, these results could suggest that the probiotic may act indirectly in the ovary by activating in the gut the synthesis of a potent metabolic hormone, such as leptin, and that this hormone (either alone or with other hormones) may represent the link between the metabolic and reproductive systems in which the probiotic may act. At the same time, the finding that L. rhamnosus IMC 501 administration can modulate the intraovarian signals, such as tgfb1 and gdf9, may suggest an additional role of leptin directly on the ovary given that the leptin receptor (lepr) is expressed on zebrafish ovary [55]. Future studies should elucidate if these changes are induced by the presence of GI L. rhamnosus, elevated abundance of S. thermophilus, or a combination of both.
In conclusion, the present results demonstrate the enhancing role of L. rhamnosus on acquisition of maturational competence in zebrafish follicles, confirming the positive role of L. rhamnosus in reproduction and representing an important step in understanding of the mechanisms by which this functional feed additive may act on follicle development.
ACKNOWLEDGMENT
Special thanks go to Francesca Maradonna, Chiara Piccinetti, Eugenia Ricciardelli, and Silvia Falcinelli for their help at various stages of the present study. Special thanks also go to Dr. Yong Zhu for kindly providing the anti-Mprβ, to James Sprague at the University of California–San Diego Biomedical Genomics Laboratory (BIOGEM) for Agilent microarray processing, and Dr. Roman Sasik for help with the data analysis.
Footnotes
Supported by the Fondi di Ateneo 2008–2009 to O.C. and National Institutes of Health grants DK063491, CA023100, and DK080506 to G.H.
REFERENCES
- Pang Y, Ge W. Gonadotropin and activin enhance maturational competence of oocytes in the zebrafish (Danio rerio). Biol Reprod 2002; 66: 259 265 [DOI] [PubMed] [Google Scholar]
- Pang Y, Ge W. Gonadotropin regulation of activin betaA and activin type IIA receptor expression in the ovarian follicle cells of the zebrafish, Danio rerio. Mol Cell Endocrinol 2002; 188: 195 205 [DOI] [PubMed] [Google Scholar]
- Kazeto Y, Goto-Kazeto R, Trant JM. Membrane-bound progestin receptors in channel catfish and zebrafish ovary: changes in gene expression associated with the reproductive cycles and hormonal reagents. Gen Comp Endocrinol 2005; 142: 204 211 [DOI] [PubMed] [Google Scholar]
- Tan Q, Balofsky A, Weisz K, Peng C. Role of activin, transforming growth factor-beta and bone morphogenetic protein 15 in regulating zebrafish oocyte maturation. Comp Biochem Physiol A Mol Integr Physiol 2009; 153: 18 23 [DOI] [PubMed] [Google Scholar]
- Tan Q, Zagrodny A, Bernaudo S, Peng C. Regulation of membrane progestin receptors in the zebrafish ovary by gonadotropin, activin, TGF-beta and BMP-15. Mol Cell Endocrinol 2009; 312: 72 79 [DOI] [PubMed] [Google Scholar]
- Patino R, Yoshizaki G, Thomas P, Kagawa H. Gonadotropic control of ovarian follicle maturation: the two-stage concept and its mechanisms. Comp Biochem Physiol B: Biochem Mol Biol 2001; 129: 427 439 [DOI] [PubMed] [Google Scholar]
- Nagahama Y, Yamashita M. Regulation of oocyte maturation in fish. Dev Growth Differ 2008; 50 (suppl 1): S195 S219 [DOI] [PubMed] [Google Scholar]
- Clelland E, Peng C. Endocrine/paracrine control of zebrafish ovarian development. Mol Cell Endocrinol 2009; 312: 42 52 [DOI] [PubMed] [Google Scholar]
- Selman K, Wallace RA, Sarka A, Qi X. Stages of oocyte development in the zebrafish, Brachydanio rerio. J Morphol 1993; 218: 203 224 [DOI] [PubMed] [Google Scholar]
- Wang Y, Ge W. Cloning of epidermal growth factor (EGF) and EGF receptor from the zebrafish ovary: evidence for EGF as a potential paracrine factor from the oocyte to regulate activin/follistatin system in the follicle cells. Biol Reprod 2004; 71: 749 760 [DOI] [PubMed] [Google Scholar]
- Wang Y, Ge W. Developmental profiles of activin betaA, betaB, and follistatin expression in the zebrafish ovary: evidence for their differential roles during sexual maturation and ovulatory cycle. Biol Reprod 2004; 71: 2056 2064 [DOI] [PubMed] [Google Scholar]
- Lawrence C. The husbandry of zebrafish (Danio rerio): a review. Aquaculture 2007; 269: 1 20 [Google Scholar]
- Gioacchini G, Maradonna F, Lombardo F, Bizzaro D, Olivotto I, Carnevali O. Increase of fecundity by probiotic administration in zebrafish (Danio rerio). Reproduction 2010; 140: 953 959 [DOI] [PubMed] [Google Scholar]
- Gioacchini G, Bizzaro D, Giorgini E, Ferraris P, Sabbatini S, Carnevali O. Oocytes maturation induction by Lactobacillus rhamnosus in Danio rerio: in vivo and in vitro studies. Hum Reprod 2010; 25 (suppl 1): i205 i206 [Google Scholar]
- Gioacchini G, Giorgini E, Ferraris P, Tosi G, Bizzaro D, Silvi S, Carnevali O. Could probiotics improve fecundity? Danio rerio as case of study. J Biotech 2010; 150 (suppl 1): 59 60 [Google Scholar]
- Giorgini E, Conti C, Ferraris P, Sabbatini S, Tosi G, Rubini C, Vaccari L, Gioacchini G, Carnevali O. Effects of Lactobacillus rhamnosus on zebrafish oocyte maturation: an FTIR imaging and biochemical analysis. Anal Bioanal Chem 2010; 398: 3063 3072 [DOI] [PubMed] [Google Scholar]
- Clelland E, Tan Q, Balofsky A, Lacivita R, Peng C. Inhibition of premature oocyte maturation: a role for bone morphogenetic protein 15 in zebrafish ovarian follicles. Endocrinology 2007; 148: 5451 5458 [DOI] [PubMed] [Google Scholar]
- Di Muccio T, Mukai ST, Clelland E, Kohli G, Cuartero M, Wu T, Peng C. Cloning of a second form of activin-betaA cDNA and regulation of activin-betaA subunits and activin type II receptor mRNA expression by gonadotropin in the zebrafish ovary. Gen Comp Endocrinol 2005; 143: 287 299 [DOI] [PubMed] [Google Scholar]
- Merrifield DL, Dimitroglou A, Foey A, Davies SJ, Baker RTM, Bøgwald J, Castex M, Ringø E. The current status and future focus of probiotic and prebiotic applications for salmonids. Aquaculture 2010; 302: 1 18 [Google Scholar]
- Nayak SK. Role of gastrointestinal microbiota in fish. Aqua Res 2010; 41: 1553 1573 [Google Scholar]
- Wood BR, Chernenko T, Matthäus C, Diem M, Chong C, Bernhard U, Jene C, Brandli AA, McNaughton D, Tobin MJ, Trounson A, Lacham-Kaplan O. New light on the molecular architecture of oocytes using a combination of synchrotron Fourier transform-infrared and Raman spectroscopic mapping. Anal Chem 2008; 80: 9065 9072 [DOI] [PMC free article] [PubMed] [Google Scholar]
- Carnevali O, Conti C, Ferraris P, Garavaglia MG, Gioacchini G, Giorgini E, Rubini C, Sabbatini S, Tosi G. FT-IR microspectroscopy on molecular building of zebrafish oocytes. J Mol Struct 2009; 938: 207 213 [Google Scholar]
- Sasik R, Woelk CH, Corbeil J. Microarray truths and consequences. J Mol Endocrinol 2004; 33: 1 9 [DOI] [PubMed] [Google Scholar]
- Cole SW, Galic Z, Zack JA. Controlling false-negative errors in microarray differential expression analysis: a PRIM approach. Bioinformatics 2003; 19: 1808 1816 [DOI] [PubMed] [Google Scholar]
- Ogawa S, Lozach J, Jepsen K, Sawka-Verhelle D, Perissi V, Sasik R, Rose DW, Johnson RS, Rosenfeld MG, Glass CK. A nuclear receptor corepressor transcriptional checkpoint controlling activator protein 1-dependent gene networks required for macrophage activation. Proc Natl Acad Sci U S A 2004; 101: 14461 14466 [DOI] [PMC free article] [PubMed] [Google Scholar]
- Maradonna F, Carnevali O. Vitellogenin, zona radiata protein, cathepsin D and heat shock protein 70 as biomarkers of exposure to xenobiotics. Biomarkers 2007; 12: 240 255 [DOI] [PubMed] [Google Scholar]
- Clelland E, Kohli G, Campbell RK, Sharma S, Shimasaki S, Peng C. Bone morphogenetic protein-15 in the zebrafish ovary: complementary deoxyribonucleic acid cloning, genomic organization, tissue distribution, and role in oocyte maturation. Endocrinology 2006; 147: 201 209 [DOI] [PubMed] [Google Scholar]
- Merrifield DL, Davies SJ, Güroy D, Güroy B, Emery MJ, Llewellyn C, Skill S. Preliminary assessment of Chlorogloeopsis as a dietary supplement for red tilapia (Oreochromis niloticus). Aquaculture 2010; 299: 128 133 [Google Scholar]
- Lupi S, Nucara A, Perucchi A, Calvani P, Ortolani M, Quaroni L, Kiskinova M. Performance of SISSI, the infrared beamline of the ELETTRA storage ring. J Opt Soc Am B 2007; 24: 959 964 [Google Scholar]
- Wood BR, Chiriboga L, Yee H, Quinn MA, Mc Naughton D, Diem M. Fourier transform infrared (FTIR) spectral mapping of the cervical transformation zone, and dysplastic squamous epithelium. Gynecol Oncol 2004; 93: 59 68 [DOI] [PMC free article] [PubMed] [Google Scholar]
- Stuart B. Infrared Spectroscopy: Fundamentals and Applications. Chicester, U.K: John Wiley & Sons, Ltd.; 2004. [Google Scholar]
- Goormaghtigh E, Ruysschaert JM, Raussens V. Evaluation of the information content in infrared spectra for protein secondary structure determination. Biophys J 2006; 90: 2946 2957 [DOI] [PMC free article] [PubMed] [Google Scholar]
- Wong PTT, Papavassiliou ED, Rigas B. Phosphodiester stretching bands in the infrared-spectra of human tissues and cultured-cells. Appl Spectrosc 1991; 45: 563 1567 [Google Scholar]
- Ami D, Neri T, Natalello A, Mereghetti P, Doglia SM, Zanoni M, Zuccotti M, Garagna S, Redi CA. Embryonic stem cell differentiation studied by FT-IR spectroscopy. Biochim Biophys Acta 2008; 1783: 98 106 [DOI] [PubMed] [Google Scholar]
- Clarke KR, Gorley RN. Primer V6: User Manual/Tutorial. Plymouth, U.K: PRIMER-E; 2006. [Google Scholar]
- Verdenelli MC, Ghelfi F, Silvi S, Orpianesi C, Cecchini C, Cresci A. Probiotic properties of Lactobacillus rhamnosus and Lactobacillus paracasei isolated from human feces. Eur J Nutr 2009; 48: 355 363 [DOI] [PubMed] [Google Scholar]
- Diaz Heijtz R, Wang S, Anuar F, Qian Y, Björkholm B, Samuelsson A, Hibberd ML, Forssberg H, Pettersson S. Normal gut microbiota modulates brain development and behavior. Proc Natl Acad Sci U S A 2011; 108: 3047 3052 [DOI] [PMC free article] [PubMed] [Google Scholar]
- Hirayama K, Rafter J. The role of probiotic bacteria in cancer prevention. Microbes Infect 2000; 2: 681 686 [DOI] [PubMed] [Google Scholar]
- Iannitti T, Palmieri B. Therapeutical use of probiotic formulations in clinical practice. Clin Nutr 2010; 29: 701 725 [DOI] [PMC free article] [PubMed] [Google Scholar]
- Cerda J, Calman BG, LaFleur GJ, Jr, Limesand S. Pattern of vitellogenesis and follicle maturational competence during the ovarian follicular cycle of Fundulus heteroclitus. Gen Comp Endocrinol 1996; 103: 24 35 [DOI] [PubMed] [Google Scholar]
- Kagawa H, Tanaka H, Okuzawa K, Kobayashi M. GTH., II but not GTH I induces final maturation and the development of maturational competence of oocytes of red seabream in vitro. Gen Comp Endocrinol 1998; 112: 80 88 [DOI] [PubMed] [Google Scholar]
- Wu T, Patel H, Mukai S, Melino C, Garg R, Ni X, Chang J, Peng C. Activin, inhibin, and follistatin in zebrafish ovary: expression and role in oocyte maturation. Biol Reprod 2000; 62: 1585 1592 [DOI] [PubMed] [Google Scholar]
- Bobe J, Nguyen T, Fostier A. Ovarian function of the trout preovulatory ovary: new insights from recent gene expression studies. Comp Biochem Physiol A Mol Integr Physiol 2009; 153: 63 68 [DOI] [PubMed] [Google Scholar]
- Kohli G, Hu S, Clelland E, Di Muccio T, Rothenstein J, Peng C. Cloning of transforming growth factor-beta 1 (TGF-beta 1) and its type II receptor from zebrafish ovary and role of TGF-beta 1 in oocyte maturation. Endocrinology 2003; 144: 1931 1941 [DOI] [PubMed] [Google Scholar]
- Kohli G, Clelland E, Peng C. Potential targets of transforming growth factor-beta1 during inhibition of oocyte maturation in zebrafish. Reprod Biol Endocrinol 2005; 3: 53 [DOI] [PMC free article] [PubMed] [Google Scholar]
- Resnick J, Bixler L, Cheng L, Donovan PJ. Long-term proliferation of mouse primordial germ cells in culture. Nature 1992; 359: 550 551 [DOI] [PubMed] [Google Scholar]
- Nichols J, Zevnik B. Anastassiadis K, Niwa H, Klewe-Nebenius D, Chambers I, Schöler H, Smith A. Formation of pluripotent stem cells in the mammalian embryo depends on the POU transcription factor Oct4. Cell 1998; 95: 379 391 [DOI] [PubMed] [Google Scholar]
- Pesce M, Wang X, Wolgemuth D, Schöler HR. Differential expression of the Oct-4 transcription factor during mouse germ cell differentiation. Mech Dev 1998; 71: 89 98 [DOI] [PubMed] [Google Scholar]
- Wang J, Rao S, Chu J, Shen X, Levasseur DN, Theunissen TW, Orkin SH. A protein interaction network for pluripotency of embryonic stem cells. Nature 2006; 444: 364 368 [DOI] [PubMed] [Google Scholar]
- Zuccotti M, Merico V, Sacchi L, Bellone M, Brink TC, Bellazzi R, Stefanelli M, Redi CA, Garagna S, Adjaye J. Maternal Oct-4 is a potential key regulator of the developmental competence of mouse oocytes. BMC Dev Biol 2008; 8: 97 [DOI] [PMC free article] [PubMed] [Google Scholar]
- Zuccotti M, Merico V, Sacchi L, Bellone M, Brink TC, Stefanelli M, Redi CA, Bellazzi R, Adjaye J, Garagna S. Oct-4 regulates the expression of Stella and Foxj2 at the Nanog locus: implications for the developmental competence of mouse oocytes. Hum Reprod 2009; 24: 2225 2237 [DOI] [PubMed] [Google Scholar]
- Onichtchouk D, Geier F, Polok B, Messerschmidt DM, Mossner R, Wendik B, Song S, Taylor V, Timmer J, Driever W. Zebrafish Pou5f1-dependent transcriptional networks in temporal control of early development. Mol Syst Biol 2010; 6: 354 [DOI] [PMC free article] [PubMed] [Google Scholar]
- Sánchez-Sánchez, Camp E, Garcia-Espana A, Leal-Tassias A, Mullor JL. Medaka Oct4 is expressed during early embryo development, and in primordial germ cells and adult gonads. Dev Dyn 2010; 239: 672 679 [DOI] [PubMed] [Google Scholar]
- Tosi G, Conti C, Ferraris P, Garavaglia M, Giorgini E, Rubini C, Sabbatini S. Microimaging FTIR of head and neck tumors. Part IV. Microsc Res Tech 2009; 72: 67 75 [DOI] [PubMed] [Google Scholar]
- Liu Q, Chen Y, Copeland D, Ball H, Duff RJ, Rockich B, Londraville RL. Expression of leptin receptor gene in developing and adult zebrafish. Gen Comp Endocrinol 2010; 166: 346 355 [DOI] [PMC free article] [PubMed] [Google Scholar]