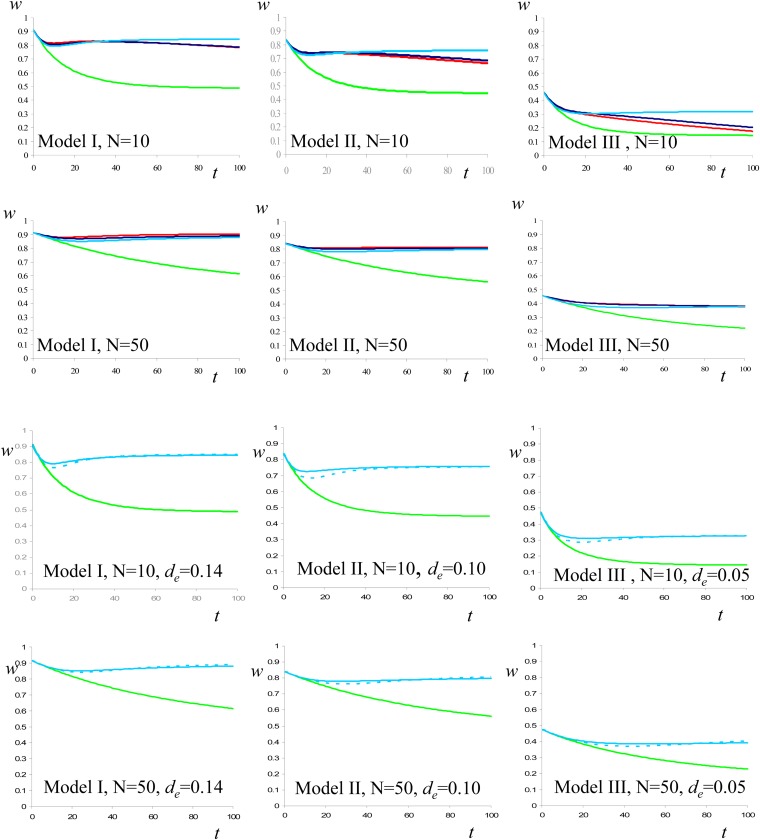
Figure 3 .
Evolution of mean fitness through 100 generations after the reduction of population size from the 103 value of the ancestral MSD balance population to two different N values (10 or 50) under the mutational models I, II and III used in Pérez-Figueroa et al. (2009). Six upper plates: Red: simulation results given by Pérez-Figueroa et al. (2009); green: neutral predictions computed ignoring new mutation; light blue: IP predictions; deep blue: FM predictions. Six lower plates: Green: neutral predictions computed ignoring new mutation; light blue solid line: IP predictions averaged over the joint distributions of s and h; light blue dashed line: IP predictions computed using de.

