Abstract
Ultrasound contrast agents (UCAs) have been explored as a means to enhance therapeutic techniques. Because the effectiveness of these techniques relies on the UCA concentration at a target site, it would be beneficial to estimate UCA concentration noninvasively. In this study, a noninvasive method for estimating UCA concentration was developed in vitro. Backscatter coefficients (BSCs) estimated from measurements of Definity® UCAs were fitted to a theoretical scattering model in the 15–25 MHz range using a Levenberg-Marquardt regression technique. The model was defined by the UCA size distribution and concentration, and therefore concentration estimates were extracted directly from the fit. Calculation of the BSC was accomplished using planar reference measurements from the back wall of a Plexiglas® chamber and an average of 500 snapshots of ultrasonic backscatter from UCAs flowing through the chamber. In order to verify the ultrasonically derived UCA concentration estimates, a sample of the UCAs was extracted from the flow path and the concentration was estimated with a hemacytometer. UCA concentrations of 1, 2, and 5 times the dose recommended by the manufacturer were used in experiments. All BSC-based estimates were within one standard deviation of hemacytometer based estimates for peak rarefactional pressures of 100–400 kPa.
INTRODUCTION
Ultrasound contrast agents (UCAs) have been used in clinical applications for enhanced imaging of blood perfused regions.1, 2, 3 However, their use is not without potential risks. Although UCAs exposed to low pressure ultrasound have a very low risk of damaging cellular structures,4 as the pressure is increased, UCAs can eventually violently collapse and cause damage to surrounding cells and tissues.5, 6 One early in vivo study7 performed imaging of the spinotrapezius muscle in rats, reporting that the inertial cavitation of UCAs due to an applied ultrasound field was directly responsible for the rupture of microvessels. The authors concluded that the magnitude of negative bioeffects depended on concentration and the type of UCA used. Many of the ex vivo studies that examined the potentially adverse effects of cavitation were done with concentrations much higher than are used clinically for diagnostics.8 It was also concluded in this study that any risks associated with the rupture of UCAs would be dependent upon UCA concentration, the duration of the applied ultrasound, and the maximum pressure amplitude in the tissue.
Because UCAs have been observed to produce bioeffects, it has been proposed that UCAs could also be used to produce beneficial and therapeutic effects. In the last 10 years, UCAs have been examined for potential use in therapy. Based on the mechanical effects of UCAs with ultrasound exposure, therapeutic applications such as sonoporation,9, 10 sonophoresis,11 angiogenesis,12 and lithotripsy13, 14 have been demonstrated to benefit from the inclusion of UCAs. To be most effective, it has been shown that each of these therapeutic applications requires a relatively high concentration of UCAs at the site where ultrasound is applied. However, current knowledge of UCA concentration is limited solely to the amount inserted at the injection site, and it was estimated that 75% of the UCAs that enter the bloodstream are lost through diffusion and fragmentation within 10 min.15 Therefore, it is very difficult to estimate the concentration of UCAs in the body, and so a method to quantify this value would be beneficial for minimizing negative bioeffects and/or enhancing therapeutic techniques.
A noninvasive method for estimating UCA concentration in vitro was developed in this study. The method relies upon accurate modeling of the scattering behavior of UCAs. For this reason, it was important to examine previously developed models which characterized the theoretical scattering behavior and dynamics of single UCAs, as well as the experimental backscatter and attenuation results from UCA populations. The results from these studies were then used to develop a scattering model from which UCA concentration estimates could be derived.
Studies performed to characterize the dynamic response of single insonified UCAs have typically been limited to frequencies less than 15 MHz because the focus of these studies was on UCA behavior near resonance.16, 17, 18, 19, 20 The Marmottant model20 was recently introduced as a more robust approximation of UCA dynamics, and was demonstrated to accurately predict the instantaneous radius of individual UCAs at 1 to 5 MHz. Other studies obtained good agreement with theoretical values of both instantaneous radius and backscattered power with the Marmottant model for frequencies under 10 MHz.21, 22, 23, 24 To date, however, limited work has been conducted to verify the Marmottant model at frequencies above 10 MHz. Therefore, one of the goals of this study was to compare experimentally obtained backscatter results near 20 MHz to the scattered pressures due to the radial oscillations predicted by the Marmottant model.
Studies of the experimental backscatter coefficient (BSC) from UCA populations have indicated that attenuation-compensated, backscattered power is linearly proportional to the concentration of UCAs.25, 26, 27, 28 The BSCs in these studies were evaluated for frequencies ranging from 1 to 30 MHz, but the effect of the center frequency of each pulse used to excite the UCAs on the BSC was not discussed extensively. It was found that the linear relationship held for a wide range of concentrations, as low as 1500 UCAs per mL. Only one of these studies26 compared the experimental BSC of Albunex® UCAs in vitro to theoretical calculations rather than the relative change in BSC with respect to increasing concentrations. However, the theoretical BSC was computed using the concentration of UCAs inserted into the system. In fact, none of the previous studies have estimated the number of UCAs per mL based solely upon backscatter measurements. It is the primary goal of this study to estimate UCA concentrations in vitro using a regression technique with the experimentally estimated BSC from UCAs, such that future work can assess the technique in vivo.
The noninvasive method for estimation of UCA concentration was verified in vitro. A flow system, developed to emulate the characteristics of the dynamic environment inside the body, was used for verification of the method. Concentration estimates were also obtained for glass beads inserted into the flow system because the beads had well-established scattering properties and thus were used for validation of the experimental system. Measurements of backscatter from the beads were used to compute effective scatterer diameter (ESD) and effective scatterer concentration (ESC) values, which were compared to the optically estimated size distributions and estimated concentrations of beads. These parameters quantify the characteristic size and concentration of scatterers in a volume and are based upon the impedance difference between the scatterers and the surrounding medium.29, 30 The method was then repeated for the UCA Definity® (Bristol-Myers Squibb, North Billerica, MA). From experimental measurements, BSCs over the 15 to 25 MHz range were used to estimate UCA concentration and compared with hemacytometer based UCA concentration estimates. The frequency range used for analyzing the BSCs in this study was chosen to be slightly above the resonance frequencies for Definity®, estimated31 to be 6 to 15 MHz for UCA diameters of 0.8–2.0 μm.
THEORY
Scattering from glass beads
The scattering behavior of rigid spheres, e.g., glass beads, is well characterized.32 As such, ESD and ESC estimates from the experimentally obtained BSCs of the glass beads used in this study were derived using the assumptions made in the development by Faran.32 These estimates were then compared with the concentration of beads added to the system and the optically derived size distribution estimates.
Scattering from UCAs
Two theoretical approaches were explored for extracting UCA concentration: a linear scattering approach16 and a nonlinear scattering model.20 The first approach considered only linear UCA oscillations while the second included the effects of nonlinear UCA oscillations. Each scattering model was used to derive a theoretical BSC, which describes the frequency characteristics of backscattered ultrasound independent of system characteristics.
The first approach was developed from the scattering cross section of a spherical air bubble in water, which is independent of incident intensity.33 Later, the model was further developed,34 and additional shell terms were introduced.16 Using this model, the scattering cross section for a single bubble is calculated as
| (1) |
where R is the resting bubble radius, is the bubble resonance frequency, f is the frequency of the applied ultrasound, and δ is a damping coefficient that includes effects of re-radiation (), viscosity of the surrounding fluid (), and heat conduction (). The damping coefficient is
| (2) |
where k is the acoustic wavenumber based upon the sound speed of the suspending medium, ω is angular frequency of the applied ultrasound, η is the dynamic viscosity of the surrounding fluid, ρ is the density of the surrounding medium and the ratio d/b is defined in Medwin34 and includes the effects of thermal conductivity. The resonance frequency of the bubble is16
| (3) |
where Sa is the adiabatic stiffness of the gas, β is the surface tension coefficient, and Sp is called the shell parameter.17 The backscatter cross section for a bubble is calculated based upon the fraction of the surface area of the transducer, A, to the total surface area of a sphere with radius equal to the distance, z, of the transducer to the scattering volume, that is,
| (4) |
Assuming minimal effects due to multiple scattering, the BSC for a size distribution of UCAs in a fixed volume is calculated as the sum of the backscatter cross sections of each bubble in the volume divided by the volume itself.
It is important to note that none of these derivations considered the effects of nonlinear radial oscillations, which have been observed at peak incident rarefactional pressures as low as 100 kPa for Definity®.35 These oscillations were the focus of the second theoretical model assessed in this study, which utilized an equation for single bubble dynamics.20 The Marmottant model is based upon a modified Rayleigh-Plesset equation and introduces a variable surface tension coefficient based upon the instantaneous radius of the bubble. The significance of a variable surface tension is that this allows the bubble to behave like a damped oscillator at low incident pressures and a highly nonlinear oscillator at high incident pressures. After calculation of a radius-time curve for each bubble in the simulated field, the bubble was treated as an oscillating spherical source and the scattered pressure in the farfield was derived. In order to obtain the total backscattered power for a collection of UCAs, multiple scattering effects were neglected and so the backscattered power from each UCA was summed individually. The physical properties of Definity UCAs that were used for the Marmottant model in this work were based upon experimental work by Goertz et al.31 The buckling radius, was set to the initial radius of the bubble, and the rupture radius, was set to 50 times the initial radius of the bubble in order to prevent the code from transitioning to the free bubble state (i.e., no bubble breakup) from the elastic shelled bubble state.
Experimental backscatter coefficient estimation
The experimental BSC was estimated based upon a planar reference technique.29, 36 The following expression was developed for weakly focused transducers under the first-order Born approximation:
| (5) |
In this development, z0 is the distance from the transducer to the scattering volume, Γ is the reflection coefficient of the reference, A0 is the area of the transducer surface, Δz is the axial length of the gated signal, Pbsc and Pref are the power spectra of the backscatter and the reference, respectively, and Aα is an attenuation-correction factor37
with , the attenuation coefficients (Np/m) of the intervening medium before the gated region and the scattering medium within the gated region, respectively, and is the distance from the source to the gated region.
MATERIALS AND METHODS
Glass beads
Glass beads (Potters Industries Inc., USA) were first sieved and then mixed with degassed water and run during separate trials. These trials were used to ensure that the setup and calculation of the BSC were robust. Concentrations of 5 g and 10 g of glass beads in 500 mL of degassed water were introduced to the system before backscatter measurements were recorded. The beads were sieved in order to minimize the effects of a variable size on the BSCs.
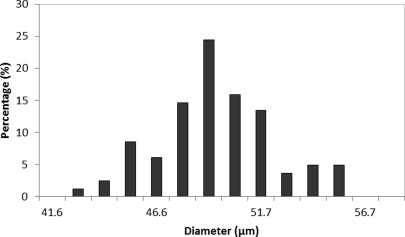
Size distribution estimates were obtained by processing images recorded with a fluorescent microscope (Zeiss Axiovert 200M Microscope, Oberkochen, Germany). Upon capturing an image with a resolution of 0.1 μm/pixel, the image was circle detected using the algorithm developed by King and O’Brien, which is based upon the Hough transform.21 Average estimates are shown in Fig. 1. The average bead diameter was 49.5 μm with a standard deviation of 2.76 μm.
Figure 1.
Size distribution of glass beads used to validate the experiment.
UCAs
Definity® UCAs were used for the acquisition of BSCs for each trial. Trials with the UCAs were run for 1×, 2×, and 5× the dosage recommended by the manufacturer for imaging purposes, which is 8 × 10⁻⁵ mL of Definity® solution per mL. The manufacturer reports that the microspheres have a mean diameter range of 1.1–3.3 μm, with 98% having a diameter smaller than 10 μm. Before activation, the vial contains 6.52 mg/mL of octafluoropropane and 0.75 mg lipid blend in a sodium chloride suspension. After engaging the Vialmix® activation sequence, the suspension is reported to contain at most 1.2 × 10¹⁰ microspheres/mL.
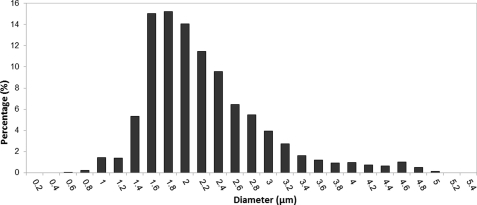
Size distributions for the UCAs were obtained using the fluorescence microscope and the same sizing algorithm as was used for the glass beads. The histogram of UCA diameters was divided into 0.2 μm bins because this was equal to the estimated uncertainty in the measurement. The average size distribution for all trials is shown in Fig. 2. The average UCA diameter was 2.2 μm and the standard deviation was 0.71 μm. A Gaussian distribution was assumed for theoretical calculations. Other more complex distributions and their parameters were also examined that more closely matched the actual estimated size distribution. In the frequency range above 15 MHz, the shape of the distribution did not significantly change the estimated concentration value.
Figure 2.
Average size distribution of Definity® used in the experimental trials.
Hemacytometer based estimates of concentration were used to confirm those values estimated with BSCs. After a sample of the UCA mixture was removed near the ultrasonic measurement site, it was inserted into the 1/25 × 1/25 × 1/10 mm3 hemacytometer (Bright-Line, Hausser Scientific, Buffalo, NY) chamber. Laser etchings on the bottom of the chamber divided it into 25 sections of equal volume. By counting the number of UCAs in each section and multiplying by the appropriate proportionality constant, an estimate of UCA concentration was obtained. This was performed immediately following the acquisition of ultrasonic backscatter data in order to minimize the loss of UCAs due to diffusion.
Setup and methods
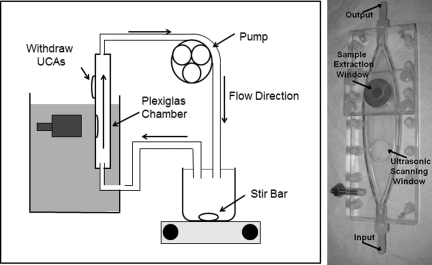
The experimental setup consisted of a flow system pressurized with a peristaltic pump (Masterflex® Variable Speed Economy Console Drive, Vernon Hills, IL) and a Plexiglas® chamber constructed to minimize turbulent flow and sidewall effects near the measurement site. A diagram of the flow system and a picture of the chamber are shown in Fig. 3. The chamber was sealed except for a hole drilled horizontally into its side which was covered with an acoustically transparent well plate seal (Thermo-Scientific ABgene® Adhesive Plate Seals, AB-0580, Hudson, NH). Above the measurement site, a rubber stopper was inserted into another hole to allow for withdrawal of a sample of the mixture. This provided an accurate way to acquire and estimate the actual concentration at the measurement site. The system drew the degassed water and UCA or glass bead mixture from a beaker which contained a large stir bar to assist in mixing. Flow entered the chamber from below through a 3/8 in. opening, diverged vertically to a width of 1.5 in., and converged again to exit through the 3/8 in. tube. After moving through the pump, the mixture was discarded into the same beaker.
Figure 3.
(Color online) Diagram of the flow system indicating location of the flow chamber, transducer, and pump, and corresponding photograph of the chamber.
Care was taken to ensure that the mixture was properly distributed and the scatterers were moving through the system. The main advantage of a vertical chamber was that the flow moved with the natural buoyant force on the UCAs. This prevented the UCAs from clustering inside the chamber, which would make it difficult to obtain accurate hemacytometer based estimates of UCA concentration. On the other hand, the vertical system worked against the natural tendency of the glass beads to settle downward. Therefore, the flow rate was adjusted to approximately 350 mL/min during all UCA experiments and 1320 mL/min during all glass bead experiments.
Ultrasonic measurements were obtained using a pulser-receiver (Panametrics 5900, Waltham, MA) operating in pulse-echo mode with a pulse repetition rate of 1 kHz and 26 dB gain. A 20-MHz, weakly focused transducer (f-number of three) was positioned such that the ultrasonic signal was directed horizontally toward the target site. Using a calibrated membrane hydrophone (National Physics Laboratory, Teddington Middlesex, UK) placed behind the same type of well plate seal described above, the peak rarefactional pressure (PRP) was recorded for multiple input energies from the pulser-receiver. These same settings were then used during all UCA and glass bead trials in order to track the effects of increasing PRP on UCA response.
In order to obtain the normalized backscattered power spectrum, a planar reference technique was utilized. Measurements of the pulse-echo system impulse response at the focus were approximated by obtaining the power spectrum of the back wall of the experimental apparatus. The back wall was designed to be a smooth, planar Plexiglas® reflector. The noise spectrum was approximated by positioning the transducer focus just inside the chamber and recording the signal in the degassed water in the system without any scatterers. After insertion of the UCAs or glass beads, 500 or 1000 snapshots of the backscattered response were recorded. Another reference measurement was acquired after the sample had been inserted in order to determine the attenuation coefficient using a standard insertion loss technique.38 Briefly, using the same weakly focused transducer and settings, the magnitudes of the signals reflected from the planar Plexiglas® reflector with and without the UCAs in the field were compared and the attenuation estimated from the difference in these signal strengths. The distance of the transducer to the planar reflector was fixed. The distance through the UCAs liquid was estimated to be equal to the depth of the chamber, i.e., 3/8 in., because it was assumed that the UCAs were distributed throughout the entire cross section of the chamber. The noise spectrum was subtracted before the backscattered power spectrum was normalized. The normalized power spectrum was then calculated with a time gate corresponding to 15 wavelengths of the 20-MHz pulse.
Some of the UCAs were destroyed at the pump before they returned to the beaker because the system was pressurized with a mechanical pump. In order to estimate the available timeframe for acquiring consistent estimates of BSC and concentration, a trial was performed where 1000 backscatter snapshots were acquired every 5 min over a 15 min period. The resulting BSC curves did not change by more than 5% over 15 min. Because all ultrasonic measurements were recorded within 7 min after the UCAs had been inserted into the beaker, concentration estimates derived from these measurements were considered to be minimally affected by the rate of UCA loss in the system.
Expected glass bead concentration was estimated by comparing the initial number of glass beads in the system to the concentration of glass beads moving through the chamber. After backscatter data were collected for each trial, the glass bead and water mixture that exited the flow chamber was collected. The mixture was then heated to separate the glass beads from the water, and the concentration of glass beads flowing through the system was determined.
Estimation algorithm
In order to predict UCA concentration using the experimental BSC, a Levenberg-Marquardt algorithm was implemented in Matlab (MathWorks, Natick, MA).39, 40 The algorithm was implemented using three variables. Assuming a Gaussian size distribution with mean and standard deviation in UCA diameter as defining characteristics, these two variables and the UCA concentration value were required to calculate the theoretical BSC. As with any algorithm based upon Newton’s method, it was sensitive to the initial guess of concentration, mean diameter, and standard deviation in diameter. However, it was not a goal of this study to rigorously determine the regions of convergence for this algorithm. Rather, the estimate of UCA concentration for each trial was reported as follows: first, a UCA concentration estimate was calculated using an initial guess for concentration of 9.6 × 10⁵ UCAs per mL, which corresponds to the approximate Definity® concentration for a 1x dosage. The initial values for UCA concentration were then varied to find the range of values within which the algorithm converged to an estimate. In this analysis, the initial guesses for the size distribution parameters (mean and standard deviation) were first set to those obtained from the average size distribution estimated optically. It was found that for all trials, the algorithm converged only for initial values of UCA concentration within 100 times the final estimate, and that the final estimate was the same for all initial values of UCA concentration that were used within that range. The resulting UCA concentration estimate was reported in the results as the final estimate. Next, estimates were obtained when the initial mean diameter was varied from 1 to 8 μm and the initial standard deviation in diameter was varied from 0.4 to 3 μm. The ranges in the mean diameter and standard deviation of the diameter were chosen to correspond to the ranges observed from the optically estimated size distributions and the size distribution parameters reported by the UCA manufacturer. Because the maximum difference between these UCA concentration estimates and the UCA concentration estimate that was calculated using the average size distribution parameters as initial guesses was less than 2% for all trials, it was concluded that the initial guess was not a limiting factor for the algorithm within the ranges of parameter values that were examined.
RESULTS
Glass beads
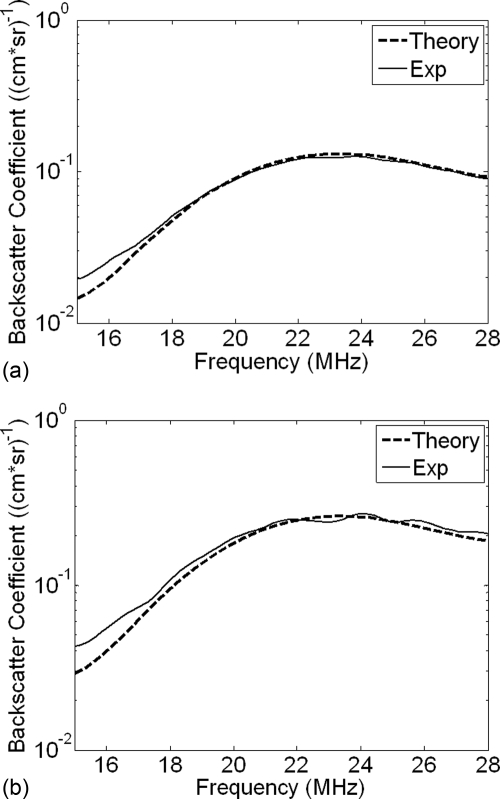
Resulting BSCs from one trial for each of the two concentrations used in this study are given in Fig. 4. The frequencies chosen for analysis were based upon the -10-dB bandwidth of the 20-MHz transducer that was used. For the 5 g concentration, the ESD and ESC estimates were, respectively, 49.5 μm and 4.8 × 10⁴ beads/mL. This ESC was within 3.4% of the concentration, 5.0 × 10⁴ beads/mL, determined by heating the extracted glass bead solution. Similarly, the ESD and ESC estimates for the 10 g concentration were 49.5 μm and 1.0 × 10⁵ beads/mL, and the ESC estimate was within 2.4% of 9.9 × 10⁴ beads/mL, the concentration determined from the water evaporation technique.
Figure 4.
Experimental and theoretical backscatter coefficient for glass beads with a theoretical concentration of (a) 5 g and (b) 10 g of beads in 500 mL of degassed water.
The glass beads were also used to test whether the flow through the channel was uniform. For example, if the flow caused more particulate to travel down the center of the channel and less to travel on the sides of the channel, then the location of the ultrasonic measurements would yield different estimates of concentration. If the flow was not uniform across the channel, then by moving the focus of the transducer laterally across the scanning window, the estimate of the BSC and subsequently the estimate of concentration would be different. BSCs were calculated with the glass bead formulation by moving the transducer laterally across the scan window. Differences between BSC curves were less than 0.5% suggesting the flow was uniform across the channel covered by the scanning window.
UCAs
Theoretical BSCs
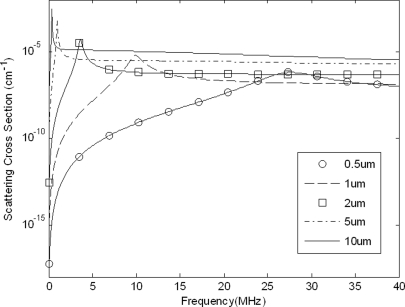
The theoretical BSCs of both individual UCAs and for various size distributions were estimated to determine a frequency range wherein the BSC depended most significantly upon concentration rather than size. Using the linear model for scattering cross section, the cross sections for various diameters of single Definity® UCAs are given as a function of frequency in Fig. 5. Because the larger UCAs dominated contributions to the BSC and the measured size distributions indicated a large presence of UCAs with diameters 0.8–3 μm, it was concluded that the cross section was less heavily influenced by the UCAs’ resonant frequencies above 15 MHz. However, based on this analysis the effects of the size of a UCA on the magnitude of the BSC at frequencies above 15 MHz could not be completely discounted.
Figure 5.
Theoretical scattering cross sections for single UCAs of various diameters.
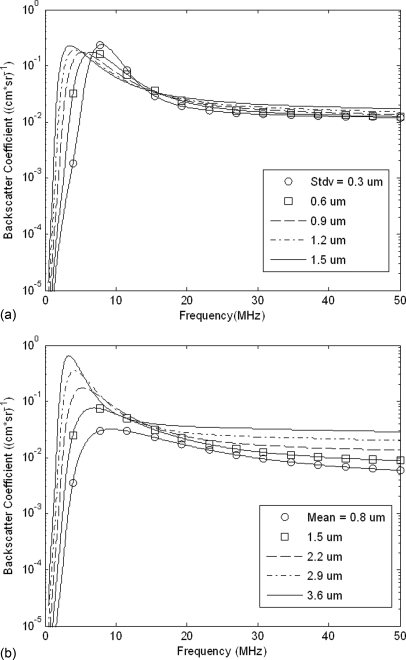
The effects of the size distribution parameters, i.e., mean UCA diameter and standard deviation, on the BSCs for Definity® were estimated. This was accomplished by holding the mean diameter constant while varying the standard deviation of the diameter size and then repeating this technique with a constant standard deviation and varying mean diameter. Figure 6 shows the resulting BSCs after these two techniques were applied for a 1× concentration of UCAs. The mean diameter was fixed at 2.2 μm in Fig. 6a, and the standard deviation in diameter was fixed at 0.71 μm in Fig. 6b because these were the parameters from the average estimated size distribution. Although in Fig. 6a, changes in standard deviation had a visible effect on the BSC from 1 to 50 MHz, they had the least effect on BSC for frequencies above 12 MHz. The curve with the lowest magnitude BSC was subtracted from the one with the largest magnitude to determine the frequencies for which the BSC varied the least due to changes in standard deviation of the size distribution. The minimum difference between BSCs in Fig. 6a occurred at 14 MHz, and remained nearly constant from 14 to 50 MHz. Over this frequency range, changes in the standard deviation of UCA diameter had minimal effects on the magnitude of the theoretical BSC. This method of determining the minimum difference between BSCs was repeated for the curves in Fig. 6b. The greatest difference between BSCs occurred for frequencies below 12 MHz because the mean UCA diameter significantly affected the magnitude of the BSC and the location of the resonant peak within this range. On the other hand, the minimum difference between BSCs occurred at 14 MHz and this difference remained low through 30 MHz. Over the range of 14 to 30 MHz, changes in the mean UCA diameter changed the slope of the BSC but did not affect its magnitude significantly. Above 30 MHz, the difference between BSCs increased.
Figure 6.
Simulated BSC calculated using the linear model and a normal size distribution, where (a) the mean UCA diameter is a constant 2.2 μm and the standard deviation is varied, and (b) the standard deviation in UCA diameter is a constant 0.9 μm and the mean diameter is varied.
Based upon this analysis, a 20-MHz center frequency was chosen for data acquisition, which corresponded to a frequency range of 15–28 MHz based upon the -10-dB bandwidth of the 20 MHz transducer. Choosing this range ensured that the standard deviation of diameters would minimally affect the BSC and that changes in the mean diameter would change the slope of the BSC in a predictable way. This would therefore allow the Levenberg-Marquardt algorithm to converge more quickly to an accurate UCA concentration estimate. It was found during the experimental trials that the BSC consistently deviated from the linear model above 25 MHz. Therefore, the frequency range was modified so that 15–25 MHz was used for concentration estimation with Definity® and the linear model.
Experimental Results
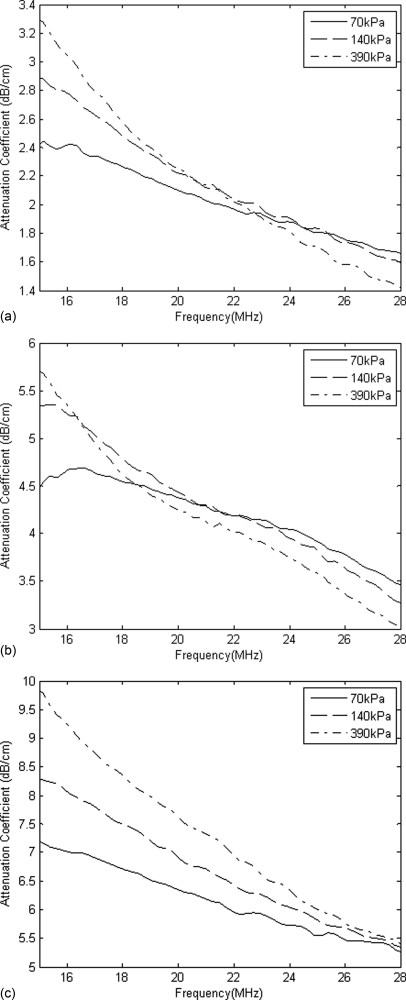
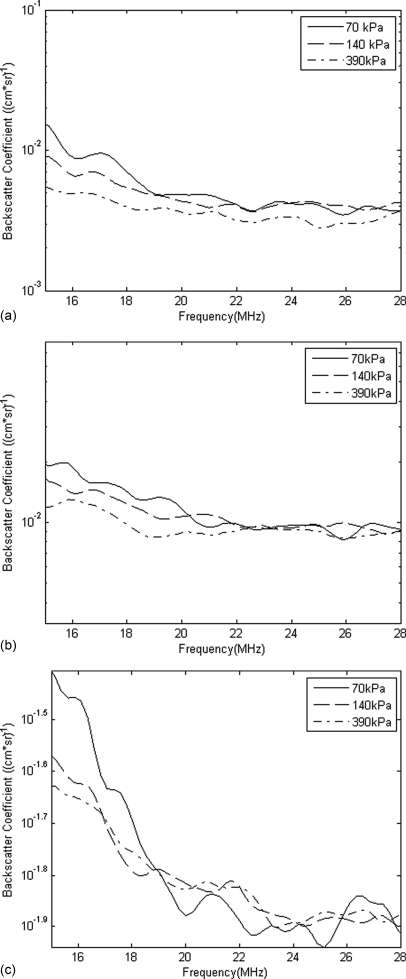
Both attenuation and BSCs were calculated for varying PRPs and concentrations. Figures 78 show results of attenuation and BSC, respectively. For simplicity, only a single trial from each of the 1×, 2×, and 5× concentrations is shown. In all trials, attenuation was observed to decrease with increasing frequency. For increasing PRP, the attenuation between 15 and 18 MHz also increased and the location of the peak moved to a slightly lower frequency. For frequencies above approximately 20 MHz, the curves were closer together and the lowest PRP corresponded to maximum attenuation. Attenuation of ultrasound through a fluid with Definity has been documented to increase with increasing driving pressure41, 45 and this has been attributed to nonlinear damping and harmonic generation associated with the presence of bubbles.34
Figure 7.
UCA attenuation measurements for varying PRP and (a) 1×, (b) 2×, and (c) 5× concentration.
Figure 8.
UCA experimental backscatter coefficient for varying PRP and (a) 1×, (b) 2×, and (c) 5× concentration.
The corresponding estimated UCA concentration from each experimental BSC was determined using the Levenberg-Marquardt algorithm. These UCA concentration values were compiled into Table TABLE I., which also lists the UCA concentrations that were estimated with the hemacytometer. All of the estimates in Table TABLE I. were based upon backscatter data obtained for PRPs equal to 140 kPa. UCA concentration estimates were also obtained for trials performed at PRPs higher than 140 kPa. These estimates, which are listed in Table TABLE II., were used to examine the effect of increasing PRP on the accuracy of the estimation method. From Fig. 8, it can be observed that the BSC curves were not constant for varying incident PRPs as suggested by the linear model. The BSC decreased slightly with increasing PRP and the corresponding predicted concentration therefore also decreased.
TABLE I.
Concentration values estimated optically and with the Levenberg-Marquardt algorithm and the de Jong model from backscatter acquired for a PRP of 140 kPa.
| 1× Concentration | ||||
| Hemacytometer Based Concentration (UCAs/mL) | 2.1 ± 0.7 × 10⁶ | 1.8 ± 0.4 × 10⁶ | 1.7 ± 0.4 × 10⁶ | 1.1 ± 3.4 × 10⁶ |
| Estimated Concentration (UCAs/mL) | 2.5 × 10⁶ | 2.1 × 10⁶ | 2.1 × 10⁶ | 1.1 × 10⁶ |
| 2× Concentration | ||||
| Hemacytometer Based Concentration (UCAs/mL) | 4.6 ± 0.5 × 10⁶ | 4.3 ± 1.3 × 10⁶ | 3.3 ± 0.7 × 10⁶ | 3.3 ± 1.0 × 10⁶ |
| Estimated Concentration (UCAs/mL) | 4.7 × 10⁶ | 3.7 × 10⁶ | 3.6 × 10⁶ | 3.2 × 10⁶ |
| 5× Concentration | ||||
| Hemacytometer Based Concentration (UCAs/mL) | 8.2 ± 1.3 × 10⁶ | 7.1 ± 1.1 × 10⁶ | 6.7 ± 1.6 × 10⁶ | 1.0 ± 0.4 × 10⁷ |
| Estimated Concentration (UCAs/mL) | 8.4 × 10⁶ | 6.1 × 10⁶ | 7.4 × 10⁶ | 1.2 × 10⁷ |
TABLE II.
Estimated Concentration with the Levenberg-Marquardt algorithm and the de Jong model for varying PRP.
| 1× Concentration | |||
| Hemacytometer Based Concentration | 2.1 ± 0.7 × 10⁶ UCAs/mL | ||
| PRP (kPa) | 70 | 140 | 390 |
| Estimated | 2.8 × 10⁶ | 2.5 × 10⁶ | 1.5 × 10⁶ |
| Concentration | |||
| (UCAs/mL) | |||
| 2× Concentration | |||
| Hemacytometer Based Concentration | 4.6 ± 0.5 × 10⁶ UCAs/mL | ||
| PRP (kPa) | 70 | 140 | 390 |
| Estimated | 5.2 × 10⁶ | 4.7 × 10⁶ | 4.3 × 10⁶ |
| Concentration | |||
| (UCAs/mL) | |||
| 5× Concentration | |||
| Hemacytometer Based Concentration | 8.2 ± 1.3 × 10⁶ UCAs/mL | ||
| PRP (kPa) | 70 | 140 | 390 |
| Estimated | 8.1 × 10⁶ | 8.4 × 10⁶ | 7.0 × 10⁶ |
| Concentration | |||
| (UCAs/mL) | |||
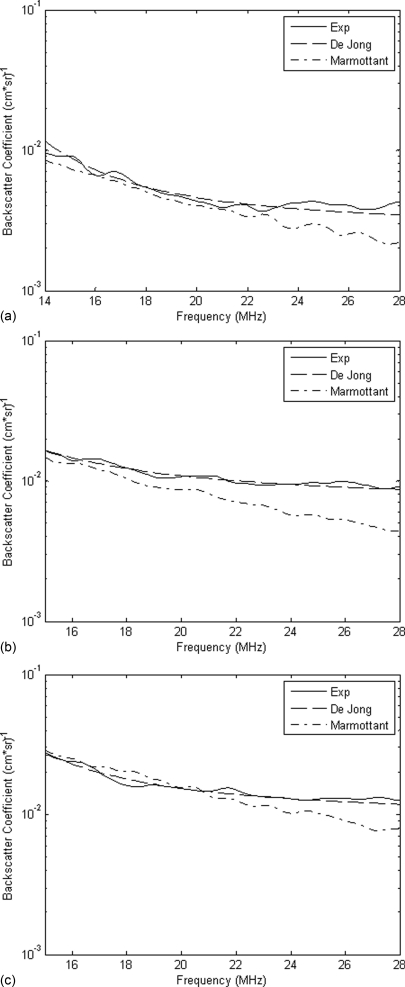
The experimental BSCs were then compared qualitatively to both the linear and Marmottant models. Figure 9 contains three curves corresponding to the experimental, linear, and Marmottant BSCs. A PRP of 140 kPa was chosen for analysis because the backscatter data collected at this PRP most closely corresponded to the hemacytometer based UCA concentration values. A possible explanation for this is that the noise present in the signal from a PRP of 70 kPa added a significant amount of energy to the BSC curve which could not be completely eliminated by simple subtraction of the noise power spectrum. The size distribution used to create the Marmottant BSC was the same as the one used to produce the linear curve, which was estimated using the Levenberg-Marquardt algorithm.
Figure 9.
Comparison of the linear and Marmottant models to the experimental BSC at (a) 1×, (b) 2×, and (c) 5× concentration and a PRP of 140kPa.
DISCUSSION AND CONCLUSION
This study used the experimental BSC and a theoretical scattering model to predict the concentration of UCAs in vitro. The method for predicting UCA concentration was assessed using the flow system and experiment described above. Results of concentration estimates obtained using the experimental BSC, when compared to the estimates obtained by counting the UCAs with a hemacytometer, indicated that the method could successfully predict UCA concentration within the limits of the pressure values used in this study.
Qualitatively, the theoretical BSC curve for the glass beads matched the experimental curve for the frequency range of 18–28 MHz. This indicated that the experimental setup and procedure for estimating BSC could produce experimental BSCs that corroborated with theoretical scattering curves for the beads. The predicted concentration was within 6% of the ESC for all trials with the glass beads. Further, the ESD estimates were less than 1% different from the average glass bead diameter from the estimated size distribution for all trials. The glass bead experiments validated that the experimental setup and the method for computing BSC could be used to estimate multiple glass bead concentrations.
A major advantage of the setup was that UCA concentration could be estimated with a hemacytometer. However, the UCAs were not evenly distributed throughout the hemacytometer chamber, and they were constantly rising in the chamber once a sample was inserted. Therefore, hemacytometer based estimates were repeated 5 times per trial in order to estimate the overall average concentration of the UCA mixture that was extracted during each trial. The standard deviations reported in Table TABLE I. are due to these 5 estimates. In Table TABLE I. the experimentally estimated UCA concentration matched the hemacytometer based UCA concentration estimate within 1 standard deviation for every trial at a PRP of 140 kPa. In Fig. 8 and Table TABLE II., the theoretical scattering model did not predict the change in scattering behavior that was observed experimentally as PRP was increased, but the estimated UCA concentration was still within 1 standard deviation of the optically derived estimate for a PRP of 390 kPa, as reported in Table TABLE II.. This change in behavior was probably due to the scattering effects of nonlinear UCA oscillations that occurred for increased PRPs.
In Fig. 9, the Marmottant model did not predict the shape of the experimental BSC for the low PRPs. The curve had a much larger negative slope than the slope of the experimental BSC. A possible explanation for this is that the Marmottant model was created under the assumption of scattering due purely to UCA oscillation dynamics. At frequencies much greater than resonance, it is hypothesized that the scattering behavior of the UCA is dominated by its size rather than its oscillation. The Marmottant model would therefore be more suitable for predicting behavior closer to resonance. Another possible reason for the lack of agreement between experimental data and the Marmottant model is that the model does not account for the effect of frequency range on shell properties. One recent study31 observed that shell viscosity decreased with UCA size and also depended upon frequency. It was hypothesized that for Definity®, smaller UCAs at high frequencies undergo substantially more nonlinear oscillations compared to other types of small UCAs. Other more recent models might yield improved matching with experimentally derived BSCs. For example, several newer models are less strict in defining buckling and rupture radii.42, 43, 44 Future studies will include examination of additional models for describing bubble oscillations and scattering.
Limitations on the models and methods used to predict UCA concentration in this study include the choice of frequency range and the actual concentration itself. The frequency range was chosen based upon simulations performed for various size distributions of Definity® UCAs. The average diameter of Definity® is lower than the average of other common UCAs with different shell and gas compositions. Larger UCAs tend to have lower resonance frequencies, which would allow for a lower frequency range to be used to estimate UCA concentration than the 15–25 MHz used in this study. Other shell properties also affect the resonance frequency and the shape of the BSC significantly. Before concentration analysis is performed with other types of UCAs, some simulation must be performed to determine an optimal frequency range.
Attenuation through the UCA cloud and its compensation was a dominant factor in the resulting BSCs. At higher concentrations and low PRP, attenuation was especially significant. As a result, the magnitude of the received backscattered signal decreased as the gated window used to determine the BSC was moved farther away from the transducer. In order to minimize the loss of signal, the window was placed close to the scanning window film. However, some of this effect was unavoidable and reduced the signal to noise ratio of the BSCs. Because compensation for attenuation has a large impact on BSCs and therefore UCA concentration estimates, future implementations of this technique will require accurate experimental estimations of attenuation through the cloud of UCAs. Many studies have shown that the attenuation for a variety of UCAs peaks somewhere below 15 MHz and then decreases, which corroborates with the results displayed in Fig. 7.26, 31, 45 One study46 found that for concentrations 200x the recommended dosage of Definity®, the attenuation coefficient was about 31 dB/cm at 30 MHz, which was much higher than previous attenuation estimates.31 This indicates that for high UCA concentrations, which are often necessary for imaging or for therapeutic applications, accurate estimates of attenuation will be necessary for obtaining accurate UCA concentration estimates using the method employed in this study.
In this study, the following contributions were made. First, the concentration was estimated using an inversion technique based upon a linear model for the theoretical BSC. Second, the insonation frequency was determined by calculating the theoretical BSC and choosing a frequency where the effects of UCA size distribution on the theoretical BSC were minimized. Third, the actual UCA concentrations at the measurement site were verified with a hemacytometer rather than assuming that the amounts injected into the flow system were accurate. In fact, the hemacytometer based concentrations were consistently different from the expected amounts introduced to the system through injection. Finally, the importance of pressure dependence on concentration estimates was explicitly shown through the estimation of UCA concentration for varying PRP.
ACKNOWLEDGMENTS
This study was supported by grant NIH R37 EB002641 (National Institutes of Health, Bethesda, MD). The authors would like to thank Daniel King for his helpful discussions with the implementation of the Marmottant model and bubble dynamics.
References
- Averkiou M., Powers J., Skyba D., Bruce M., and Jensen S., “Ultrasound contrast imaging research,” Ultrasound Quart. 19, 27–37 (2003). 10.1097/00013644-200303000-00004 [DOI] [PubMed] [Google Scholar]
- Cosgrove D. and Harvey C., “Clinical uses of microbubbles in diagnosis and treatment,” Med. Biol. Eng. Comput. 47, 813–826 (2009). 10.1007/s11517-009-0434-3 [DOI] [PubMed] [Google Scholar]
- Becker H., and Burns P., Handbook of Contrast Echocardiography (Springer-Verlag, Heidelberg, Germany, 2000), pp. 82–83. [Google Scholar]
- ter Haar G., “Safety and bio-effects of ultrasound contrast agents,” Med. Biol. Eng. Comput. 47, 893–900 (2009). 10.1007/s11517-009-0507-3 [DOI] [PubMed] [Google Scholar]
- Miller D. L. and Dou C., “Membrane damage thresholds for pulsed or continuous ultrasound in phagocytic cells loaded with contrast agent gas bodies,” Ultrasound Med. Biol. 30, 405–411 (2004). 10.1016/j.ultrasmedbio.2003.11.013 [DOI] [PubMed] [Google Scholar]
- Miller D. L., Dou C., and Wiggins R. C., “Frequency dependence of kidney injury induced by contrast-aided diagnostic ultrasound in rats,” Ultrasound Med. Biol. 34, 1678–1687 (2008). 10.1016/j.ultrasmedbio.2008.03.001 [DOI] [PMC free article] [PubMed] [Google Scholar]
- Price D. M. Skyba R. J., Linka A. Z., Skalak T. C., and Kaul S., “Direct in vivo visualization of intravascular destruction of microbubbles by ultrasound and its local effects on tissue,” Circ. 98, 290–293 (1998). [DOI] [PubMed] [Google Scholar]
- Bekeredjian R., Grayburn P. A., and Shohet R. V., “Use of ultrasound contrast agents for gene or drug delivery in cardiovascular medicine,” J. Am. Coll. Cardiol. 45, 329–225 (2005). 10.1016/j.jacc.2004.08.067 [DOI] [PubMed] [Google Scholar]
- Fan Z., Kumon R. E., Park J., and Deng C. X.. “Intracellular delivery and calcium transients generated in sonoporation facilitated by microbubbles,” J. Control. Release 142, 31–39 (2010). 10.1016/j.jconrel.2009.09.031 [DOI] [PMC free article] [PubMed] [Google Scholar]
- Forbes M. M., Steinberg R. L., and O W. D.’Brien, Jr., “Frequency-dependent evaluation of the role of Definity® in producing sonoporatior of Chinese hamster ovary cells,” J. Ultrasound Med. 30, 61–69 (2011). [DOI] [PMC free article] [PubMed] [Google Scholar]
- Kimmel E., “Cavitation bioeffects,” Crit. Rev. Biomed. Eng. 34, 105–161 (2006). [DOI] [PubMed] [Google Scholar]
- Johnson C. A., Sarwate S., Miller R. J., and W. D.O’Brien, Jr., “A temporal study of ultrasound contrast agent-induced changes in capillary density,” J. Ultrasound Med. 29, 1267–1275 (2010). [DOI] [PMC free article] [PubMed] [Google Scholar]
- Bailey M. R., Pishchalnikov Y. A., Sapozhnikov O. A., Cleveland R. O., McAteer J. A., Miller N. A., Pishchalnikov I. V., Connors B. A., Crum L. A., and Evan A. P., “Cavitation detection during shock-wave lithotripsy,” Ultrasound Med. Biol. 31, 1245–1256 (2005). 10.1016/j.ultrasmedbio.2005.02.017 [DOI] [PubMed] [Google Scholar]
- Stride E. P. and Coussios C. C., “Cavitation and contrast: The use of bubbles in ultrasound imaging and therapy,” Proc. Inst. Mech. Eng., Part H: J. Eng. Med. 224, 171–191 (2010). 10.1243/09544119JEIM622 [DOI] [PubMed] [Google Scholar]
- Droste D. W., “Clinical utility of contrast-enhanced ultrasound in neurosonology,” Eur. Neurol. 59, 2–8 (2008). 10.1159/000114454 [DOI] [PubMed] [Google Scholar]
- de Jong N., Hoff L., Skotland T., and Bom N., “Absorption and scatter of encapsulated gas filled microspheres: Theoretical considerations and some measurements,” Ultrasonics 30, 95–103 (1992). 10.1016/0041-624X(92)90041-J [DOI] [PubMed] [Google Scholar]
- de Jong N. and Hoff L., “Ultrasound scattering properties of Albunex microspheres,” Ultrasonics 31, 175–181 (1993). 10.1016/0041-624X(93)90004-J [DOI] [PubMed] [Google Scholar]
- Doinikov A. A., Haac J. F., and Dayton P. A., “Modeling of nonlinear viscous stress in encapsulating shells of lipid-coated contrast agent microbubbles,” Ultrasonics 49, 269–275 (2009). 10.1016/j.ultras.2008.09.007 [DOI] [PMC free article] [PubMed] [Google Scholar]
- Hoff L., Sontum P. C., and Hovem J. M., “Oscillations of polymeric microbubbles: Effect of the encapsulating shell,” J. Acoust. Soc. Am. 107, 2272–2280 (2000). 10.1121/1.428557 [DOI] [PubMed] [Google Scholar]
- Marmottant P., van der Meer S., Emmer M., Versluis M., de Jong N., Hilgenfeldt S., and Lohse D., “A model for large amplitude oscillations of coated bubbles accounting for buckling and rupture,” J. Acoust. Soc. Am. 118, 3499–3505 (2005). 10.1121/1.2109427 [DOI] [Google Scholar]
- King D. A. and O W. D.’Brien, Jr., “Comparison between maximum radial expansion of ultrasound contrast agents and experimental postexcitation signal results,” J. Acoust. Soc. Am. 129, 114–121 (2011). 10.1121/1.3523339 [DOI] [PMC free article] [PubMed] [Google Scholar]
- Overvelde M., Garbin V., Sijl J., Dollet B., de Jong N., Lohse D., and Versluis M., “Nonlinear shell behavior of phospholipid-coated microbubbles,” Ultrasound Med. Biol. 36, 2080–2092 (2010). 10.1016/j.ultrasmedbio.2010.08.015 [DOI] [PubMed] [Google Scholar]
- Sijl J., Gaud E., Frinking P. J. A., Arditi M., de Jong N., Lohse D., and Versluis M., “Acoustic characterization of single ultrasound contrast agent microbubbles,” J. Acoust. Soc. Am. 124, 4091–4097 (2008). 10.1121/1.2997437 [DOI] [PubMed] [Google Scholar]
- Sijl J., Dollet B., Overvelde M., Garbin V., Rozendal T., de Jong N., Lohse D., and Versluis M., “Subharmonic behavior of phospholipid-coated ultrasound contrast agent microbubbles,” J. Acoust. Soc. Am. 128, 3239–3252 (2010). 10.1121/1.3493443 [DOI] [PubMed] [Google Scholar]
- Lampaskis M. and Averkiou M., “Investigation of the relationship of nonlinear backscattered ultrasound intensity with microbubble concentration at low MI,” Ultrasound Med. Biol. 36, 306–312 (2010). 10.1016/j.ultrasmedbio.2009.09.011 [DOI] [PubMed] [Google Scholar]
- Marsh J. N., Hughes M. S., Hall C. S., Lewis S. H., Trousil R. L., Brandenburger G. H., Levene H., and Miller J. G., “Frequency and concentration dependence of the backscatter coefficient of the ultrasound contrast agent Albunex,” J. Acoust. Soc. Am. 104, 1654–1666 (1998). 10.1121/1.424378 [DOI] [Google Scholar]
- Moran C. M., Watson R. J., Fox K. A. A., and McDicken W. N., “In vitro acoustic characterization of four intravenous ultrasound contrast agents at 30 MHz,” Ultrasound Med. Biol. 28, 785–791 (2002). 10.1016/S0301-5629(02)00520-3 [DOI] [PubMed] [Google Scholar]
- Sboros V., Ramnarine K. V., Moran C. M., Pye S. D., and McDicken W. N., “Understanding the limitations of ultrasonic backscatter measurements from microbubble populations,” Phys. Med. Biol. 47, 4287–4299 (2002). 10.1088/0031-9155/47/23/313 [DOI] [PubMed] [Google Scholar]
- Lavarello R. J., Ghoshal G., and Oelze M. L., “On the estimation of backscatter coefficients using single element focused transducers,” J. Acoust. Soc. Am. 129, 2903–2911 (2011). 10.1121/1.3557036 [DOI] [PMC free article] [PubMed] [Google Scholar]
- Oelze M. L., O W. D.’Brien, Jr., J. P. Blue, and J. F. Zachary, “Differentiation and characterization of rat mammary fibroadenomas and 4T1 mouse carcinomas using quantitative ultrasound imaging,” IEEE Trans. Med. Imag. 23, 764–771 (2004). 10.1109/TMI.2004.826953 [DOI] [PubMed] [Google Scholar]
- Goertz D. E., de Jong N., and van der Steen A. F., “Attenuation and size distribution measurements of Definity® and manipulated Definity® populations,” Ultrasound Med. Biol. 33, 1376–1388 (2007). 10.1016/j.ultrasmedbio.2007.03.009 [DOI] [PubMed] [Google Scholar]
- Faran J. J.. “Sound scattering by solid cylinders and spheres,” J. Acoust. Soc. Am. 24, 405–418 (1951). 10.1121/1.1906780 [DOI] [Google Scholar]
- Wildt R., “Acoustic theory of bubbles,” Physics of Sound in the Sea, Division 6 Summary Technical Report (National Defense Research Committed, Washington DC, 1946), Vol. 8.
- Medwin H., “Counting bubbles acoustically: A review,” Ultrasonics 15, 7–13 (1977). 10.1016/0041-624X(77)90005-1 [DOI] [Google Scholar]
- Maresca D., Emmer M., van Neer P. L. M. J., Vos H. J., M Versluis, Muller M., de Jong N., and van der Steen A. F. W., “Acoustic sizing of an ultrasound contrast agent,” Ultrasound Med. Biol. 36, 1713–1721 (2010). 10.1016/j.ultrasmedbio.2010.06.014 [DOI] [PubMed] [Google Scholar]
- Insana M. F. and Hall T. J., “Parametric ultrasound imaging from backscatter coefficient measurements: Image formation and interpretation,” Ultrason. Imaging 12, 245–267 (1990). 10.1016/0161-7346(90)90002-F [DOI] [PubMed] [Google Scholar]
- Oelze M. L. and O W. D.’Brien, Jr., “Frequency dependent attenuation-compensation functions for ultrasonic signals backscattered from random media,” J. Acoust. Soc. Am. 111, 2308–2319 (2002). 10.1121/1.1452743 [DOI] [PubMed] [Google Scholar]
- Parker K. J., “Ultrasonic attenuation and absorption in liver tissue,” Ultrasound Med. Biol. 9, 363–369 (1983). 10.1016/0301-5629(83)90089-3 [DOI] [PubMed] [Google Scholar]
- Levenberg K., “A method for the solution of certain non-linear problems in least squares,” Quart. Appl. Math. 2, 164–168 (1944). [Google Scholar]
- Marquardt D., “An algorithm for least-squares estimation of nonlinear parameters,” SIAM J. Appl. Math. 11, 431–441 (1963). 10.1137/0111030 [DOI] [Google Scholar]
- Chen Q., Zagzebski J., Wilson T., and Stiles T., “Pressure-dependent attenuation in ultrasound contrast agents,” Ultrasound Med. Biol. 28, 1041–1051 (2002). 10.1016/S0301-5629(02)00546-X [DOI] [PubMed] [Google Scholar]
- Chatterjee D. and Sarkar K., “A Newtonian rheological model for the interface of microbubble contrast agents,” Ultrasound Med. Biol. 29, 1749–1757 (2003). 10.1016/S0301-5629(03)01051-2 [DOI] [PubMed] [Google Scholar]
- Sarkar K., Shi W. T., Chatterjee D., and Forsberg F., “Charactereization of ultrasound contrast microbubbles using in vitro experiments and viscous and viscoelastic interface models for encapsulation,” J. Acoust. Soc. Am. 118, 539–550 (2005). 10.1121/1.1923367 [DOI] [PubMed] [Google Scholar]
- Paul S., Katiyar A., Sarkar K., Chatterjee D., Shi W., and Forsberg F., “Material characterization of the encapsulation of an ultrasound contrast microbubble and its subharmonic response: Strain-softening interfacial elasticity model,” J. Acoust. Soc. Am. 127, 3846–3857 (2010). 10.1121/1.3418685 [DOI] [PMC free article] [PubMed] [Google Scholar]
- Chatterjee D., Sarkar K., Jain P., and Schreppler N. E., “On the suitability of broadband attenuation measurement for characterizing contrast agent microbubbles,” Ultrasound Med. Biol. 31, 781–786 (2005). 10.1016/j.ultrasmedbio.2005.02.014 [DOI] [PubMed] [Google Scholar]
- Stapleton S., Goodman H., Zhou Y., Cherin E., Henkelman R. M., Burns P. N., and Foster F. S., “Acoustic and kinetic behavior of Definity® in mice exposed to high frequency ultrasound,” Ultrasound Med. Biol. 35, 296–307 (2009). 10.1016/j.ultrasmedbio.2008.08.010 [DOI] [PubMed] [Google Scholar]


