Abstract
Purpose: Accurate cardiac deformation analysis for cardiac displacement and strain imaging over time requires Lagrangian description of deformation of myocardial tissue structures. Failure to couple the estimated displacement and strain information with the correct myocardial tissue structures will lead to erroneous result in the displacement and strain distribution over time.
Methods: Lagrangian based tracking in this paper divides the tissue structure into a fixed number of pixels whose deformation is tracked over the cardiac cycle. An algorithm that utilizes a polar-grid generated between the estimated endocardial and epicardial contours for cardiac short axis images is proposed to ensure Lagrangian description of the pixels. Displacement estimates from consecutive radiofrequency frames were then mapped onto the polar grid to obtain a distribution of the actual displacement that is mapped to the polar grid over time.
Results: A finite element based canine heart model coupled with an ultrasound simulation program was used to verify this approach. Segmental analysis of the accumulated displacement and strain over a cardiac cycle demonstrate excellent agreement between the ideal result obtained directly from the finite element model and our Lagrangian approach to strain estimation. Traditional Eulerian based estimation results, on the other hand, show significant deviation from the ideal result. An in vivo comparison of the displacement and strain estimated using parasternal short axis views is also presented.
Conclusions: Lagrangian displacement tracking using a polar grid provides accurate tracking of myocardial deformation demonstrated using both finite element and in vivo radiofrequency data acquired on a volunteer. In addition to the cardiac application, this approach can also be utilized for transverse scans of arteries, where a polar grid can be generated between the contours delineating the outer and inner wall of the vessels from the blood flowing though the vessel.
Keywords: ultrasound, elastography, cardiac strain imaging
INTRODUCTION
Echocardiography is used routinely for assessing regional myocardial function. Clinical diagnosis based on visually assessed wall motion scoring and evaluation of wall thickening is semiquantitative, image quality dependent, and heavily weighted by operator experience and expertise.1, 2 Tissue Doppler imaging1, 2 has been developed to provide quantitative indices of myocardial function such as strain and strain rate. However, limitations such as angle dependency and noise susceptibility are inherited problems with tissue Doppler based approaches.3, 4, 5
Cardiac elastography6, 7, 8, 9, 10, 11 is a radiofrequency echo-signal based speckle tracking method used to characterize myocardial function. It utilizes estimates of the local displacement and strain variations, estimated with one-dimensional (1D) (Refs. 12, 13) or two dimensional (2D),14, 15, 16, 17, 18 and even three-dimensional,19 motion tracking. 1D displacement tracking is highly sensitive to axial deformations and computationally fast but does not provide lateral deformation information.12, 13 2D displacement tracking algorithms14, 15, 16, 17, 18 for linear array transducers have been investigated by several research groups and provide relatively coarse lateral deformation estimates.18 Konofagou and Ophir14 used weighted interpolation between neighboring radio frequency (RF) A-lines to acquire high precision lateral displacements. Zhu and Hall15 used a modified block-matching algorithm to reduce the search range and estimation error using 2D block-matching. Shi and Varghese16 successfully estimated discontinuous displacement fields utilizing a 2D multilevel algorithm. Chen et al.17 developed a quality guided algorithm for ultrasound displacement tracking to track through geometrically irregular and disjoint regions.
Accurate estimation of myocardial deformations, however, require a Lagrangian description,11, 20, 21, 22, 23 which means that displacement and strain have to be described around a point/region in myocardial tissue as it moves/traverses through space and time. Eulerian description11, 20, 21, 22, 23 currently utilized in strain imaging, on the other hand, focuses on displacement and strain information at several locations in myocardial tissue, which may change as time elapses. As a result, it is not an optimal way to describe tissue deformation properties with time. The ideal way to achieve Lagrangian description is to utilize displacement estimation to automatically track myocardial deformation at every point over the cardiac cycle. Three-dimensional displacement information is necessary for accurate Lagrangian estimation of cardiac tissue deformation and strain. However, along the short axis views, cardiac deformation is primarily along the axial and lateral or the radial and circumferential directions, respectively. In addition, since the deformation in the elevational direction would lie within the elevational beamwidth of the transducer due to the increased frame-rate of 50 frames/s used for in vivo data acquisitions. As a result, accurate displacement tracking in both the axial and lateral or radial and circumferential directions may be sufficient as illustrated in the comparison with the finite element analysis (FEA) results.
However, for phased array transducers, the de facto standard for echocardiography, accurate 2D displacement tracking has been very challenging. Luo et al.24 used a 1D cross-correlation and 2D search algorithm to obtain displacement information along two orthogonal directions; Lopata et al.25 adapted a multilevel 2D cross-correlation method along with local alignment and stretching to estimate 2D displacement maps. Chen and Varghese26 proposed a multilevel hybrid 2D strain estimation algorithm, where a 1D cross-correlation is used, along with a 2D search and interpolation scheme guided by the normalized cross-correlation coefficient value. This method produces higher SNR axial displacement estimation results compared to both 1D and 2D methods. However, due to high lateral undersampling with depth, lateral estimations using echocardiographic images acquired from phased array transducers are noisy and unstable; therefore, implementation of automatic tracking is often limited for phased array transducers.
In this paper, a novel algorithm that utilizes Lagrangian displacement tracking using a polar grid (LDPG) between the epi- and endocardial contours is investigated. Our approach enables us to study the displacement and strain evolution over the cardiac cycle. We utilize a semiautomated displacement tracking method along with an algorithm that generates a polar grid of the local displacement in myocardial tissue between the endocardial and epicardial contours for parasternal short-axis images. A comparison with the corresponding Eulerian displacement and strain estimation results are also presented.
MATERIALS AND METHODS
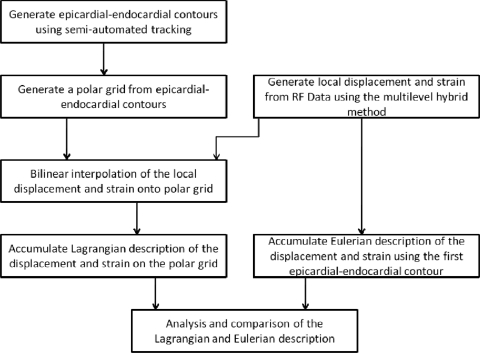
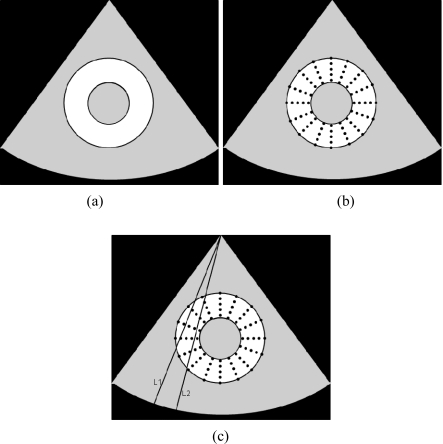
A block diagram that describes the Eulerian and Lagrangian based displacement tracking using a polar grid is shown in Fig. 1. Epicardial–endocardial contours over several cardiac cycles were first generated using semiautomatic contour detection of the cardiac walls.27 This step is also illustrated in the schematic diagram shown in Fig. 2a, showing the steps used in the algorithm.
Figure 1.
Flow chart describing the Lagrangian displacement tracking algorithm using a polar grid (LDPG) method. A comparison of the Lagrangian and Eulerian description of the strain is also provided.
Figure 2.
The three main steps in the LDPG approach for Lagrangian strain estimation. The first step involves segmentation to obtain the endocardial and epicardial contours (a) shown for short axis images. The second step involves the creation of an interpolated polar grid (b). Finally, bilinear interpolation is used to incorporate the local displacements on the grid points, as shown between the beamlines L1 and L2 in the figure.
Our algorithm then utilizes the epicardial–endocardial contour pair obtained for each short-axis image at a specific time instance in the cardiac cycle to generate a polar grid over the cardiac cycle as shown in Fig. 2b. The pixels in the polar grid of the left ventricular wall were then populated using the incremental local displacements estimated using a multilevel hybrid strain imaging algorithm for phased array transducers.26 Bilinear interpolation is used to fill in the pixels that do not intersect directly with the beam-lines of the phased array transducer over which the displacements were estimated as shown in Fig. 2c. In this manner, each of the polar grid points within the left ventricular wall over the entire cardiac cycle was populated.
The 2D deformation of the pixels in the polar grid over time now provides the Lagrangian deformation of the left ventricular wall over the cardiac cycle. The accumulated displacement and strain that follow the Lagrangian description over the cardiac cycle can therefore be obtained. Accumulated displacement and strain utilizing the Eulerian description over the cardiac cycle was also calculated using the polar grid only in the first frame of the cardiac cycle and assuming that the myocardial contour does not significantly change its shape over several cardiac cycles. Sections 2A - 2D present a detailed description of each of the processing steps involved in the algorithm.
Semiautomated contour tracking
A semiautomated contour tracking method was used to obtain endocardial and epicardial contours of the left ventricle in the short-axes view. B-mode images from a cine loop, which contains 2D echocardiographic images over several cardiac cycles, were stacked in a 3D matrix, with the 2D echocardiographic images over time corresponding to the cardiac cycle. Contour tracing is then performed using the MITK 3M3 program (Mint Medical GmbH, Heidelberg, Germany). Endocardial and epicardial wall boundaries were visualized in the 2D echocardiographic planes. For example, along the axial-time plane, wall position variations with time along the axial direction were observed (similar to that seen in M-mode image), and along the lateral (perpendicular to axial direction)-time plane, wall position variations with time along the lateral line were observed. Although cardiac motion and deformation are complex, this motion/deformation can be divided into different time spans. The time-span that corresponds to either the expansion or contraction phase can be considered or assumed to change linearly with time. Three contour lines in each cardiac cycle were drawn at selected time instances (right before systole, midsystole, and end systole) to separate the piece-wise linear motion, which were then interpolated linearly to cover the entire cardiac cycle. This will ensure proper interpolation for diastolic and systolic phases of cardiac cycle and provide a good balance between performance and computational load.
LV wall radial grid interpolation algorithm for segmental analysis
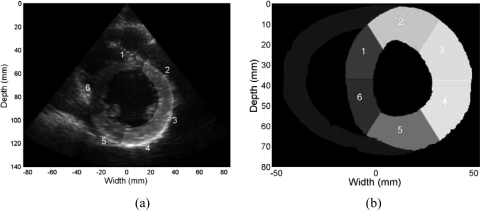
A standardized segmentation system for the left ventricle in the parasternal short-axis view28 is used in this study. This system divides the midcavity part of left ventricular wall into six segments based on their circumferential location as shown in Fig. 3a, based on American Society of Echocardiography (ASE) standards, which were utilized to generate wall motion scores. Segmentations on short-axes views from both clinical and FEA simulations are shown in Fig. 3. The relative location of the right ventricular wall is used to identify the location of the septum and the left ventricular anterior and inferior wall, respectively.
Figure 3.
B-mode image demonstrating the left ventricle segmentation on a clinical short axes image into six segments as scored for wall motion scores (a). Similar segmentation performed on the FEA simulated image of the canine heart (b). The segments based on the ASE criteria are as follows: (1) anteroseptal, (2) anterior, (3) anterolateral, (4) inferolateral, (5) inferior, and (6) inferoseptal.
Displacement and strain segmental analysis requires not only a proper system of segmentation but also a finer grid of data points estimated in the myocardium to ensure accurate subsegmental tracking over the cardiac cycle and for error analysis. Because the segments were divided circumferentially, a grid interpolation algorithm based on polar coordinates was developed to ensure equal number of subsegments in every segment using MATLAB (The MathWorks, Inc., Natick, MA).
A centroid was also calculated for each 2D frame obtained at a specific time instant. The location of the centroid was determined by the donut-shaped left ventricular myocardial wall within the endocardial and epicardial contours. The variation of the centroid location over a cardiac cycle was approximately −1.42 ± 0.72 mm in the axial and 1.09 ± 0.55 mm in the lateral direction. The contour was then divided into a larger number of points circumferentially, with the separations between points covering the same angular span. The angles were calculated using their relative location with respect to the centroid estimated. Both endocardial and epicardial contour lines were processed in this manner. In this study, contour lines were divided into 600 sections, to ensure that it was a multiple of 6 and to obtain a sufficient density for the sampled points. A one-to-one correspondence of the sections was thus built between two contours. A point on the endocardial wall and one on the epicardial wall that have the same angular locations were then connected along the radial direction. In this manner, 40 new data points between each corresponding endocardial–epicardial pairs were obtained using linear interpolation. With the procedure above, a polar grid with a total of 24 000 points was generated for each frame, and each point on the grid could therefore be tracked between frames. Typical processing time for a single frame was approximately 20 s, using MATLAB on an Intel i7 2.93GHz computer. A cardiac sequence with 2 cardiac cycles, containing 80 frames, will take approximately 30 min to process using the Eulerian method for estimation of the accumulated displacement and strain. Polar interpolation for displacement and strain estimation for the Lagrangian method requires an additional 20 s/frame for a total of 60 min for 2 cardiac cycles.
Note this grid can be directly overlaid on the estimated displacement and strain field acquired from each frame to obtain incremental and subsequent accumulated displacements and strain at each grid point. Segmental displacement and strain curves were calculated by averaging the accumulated displacement and strain of the grid points within each segment.
FEA cardiac simulations
A 3D canine heart model29, 30 for cardiac elastography8 that was previously adapted in our laboratory was used to simulate cardiac deformation and subsequent tracking of the displacement field. This FEA based canine heart model provides two cardiac cycles of tissue deformation information. The temporal sampling rate is 250 frames/s, which corresponds to 125 frames/cycle. Over 1 × 10⁶ scatterers were randomly distributed in the canine heart model to ensure Raleigh statistics for the ultrasound simulation.31 A 2D midcavity slice of the left ventricle in short-axis view is selected for our analysis. The resulting RF data generated from ultrasound simulation was then processed using the multilevel speckle tracking method26 to generate the local displacement field. A least squares method32 is then used to generate the strain field.
The epicardial and endocardial contours were also extracted from the canine heart model. These contours can be directly utilized in the LDPG algorithm. Lagrangian description of segmental displacement/strain curves over time was generated using accumulated displacement and strain along the grid points. Eulerian description of segmental displacement/strain curves were also generated assuming that the contour positions were unchanged with time.
Strain estimated from the combined FEA cardiac model and ultrasound simulations are compared to ideal displacement and strains obtained using information obtained directly from the FEA canine cardiac model itself. The FEA based digital model contains movement of points on the myocardium over two cardiac cycles. This information can be used to obtain ideal displacement/strain curves.
Ultrasound in vivo data acquisition and displacement estimation
In vivo data on a volunteer was acquired at University of Wisconsin-Madison Adult Cardiology Clinics, under a protocol approved by the UW-Madison Health Sciences Institutional review board. Informed consent was obtained prior to ultrasound scanning. Volunteers were scanned using a GE Vivid 7 system (GE Ultrasound, Waukesha, WI). A 2.5 MHz phased array transducer was used to acquire RF data along a parasternal short-axis view at midcavity at a frame rate of 50 fps. A multilevel hybrid 2D strain imaging algorithm for phased arrays previously developed in our laboratory26 was then used to generate displacement and strain images. This method provides improved strain estimation performance when compared to currently utilized 1D and 2D cross-correlation methods.12, 14, 33, 34
RESULTS
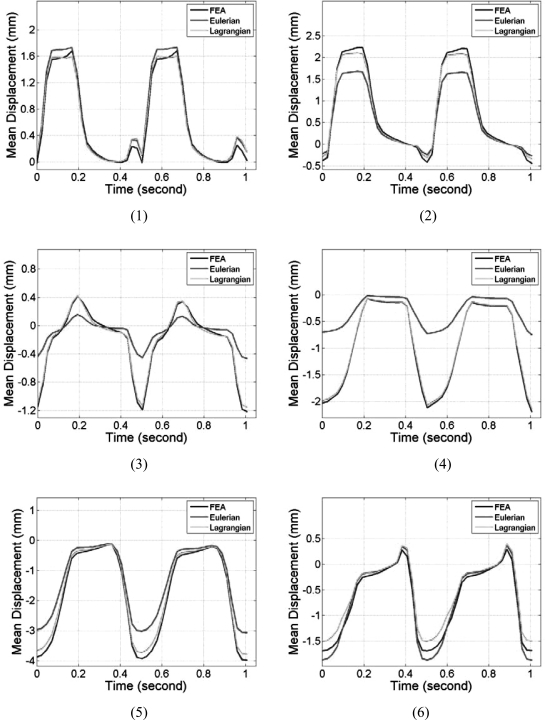
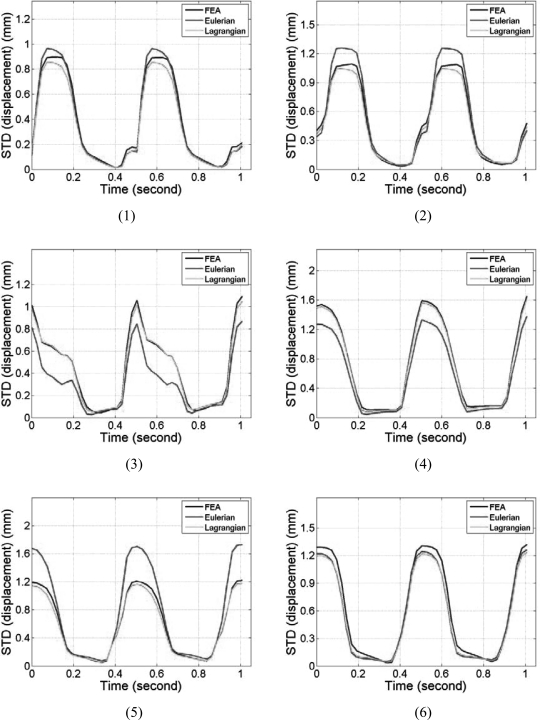
Segmental mean accumulated displacement variations over time estimated from the cardiac FEA model and ultrasound simulations are shown in Fig. 4 over the 6 segments. Comparisons were made for all six segments and over two cardiac cycles. Comparison of the mean accumulated displacement results demonstrate excellent agreement as illustrated in Fig. 4 for all the 6 segments between the FEA and Lagrangian estimates of the accumulated displacement. Figure 4, also shows that the Eulerian estimates of the mean accumulated displacement do not follow the ideal FEA cardiac model in all of the segments. Although significant deviations were observed in all the segments, the results from segments 3 and 4 indicate the largest variations. The standard deviations of the accumulated displacement estimates over time within each segment were plotted separately in Fig. 5. Note that although the standard deviations of the estimated Lagrangian displacements in the 6 segments were quite large, they closely follow the standard deviation of the 3D canine FEA model. The Eulerian estimation on the other hand deviates from the ideal FEA curve in segments 2–5.
Figure 4.
Comparison of the mean segmental accumulated displacement variation with time for Lagrangian, Eulerian, and FEA results. The segments are numbered from 1 to 6 as depicted in Fig. 3.
Figure 5.
Comparison of the standard deviation of the segmental accumulated displacement variation with time for Lagrangian, Eulerian, and FEA results. The segments are numbered from 1 to 6 as depicted in Fig. 3.
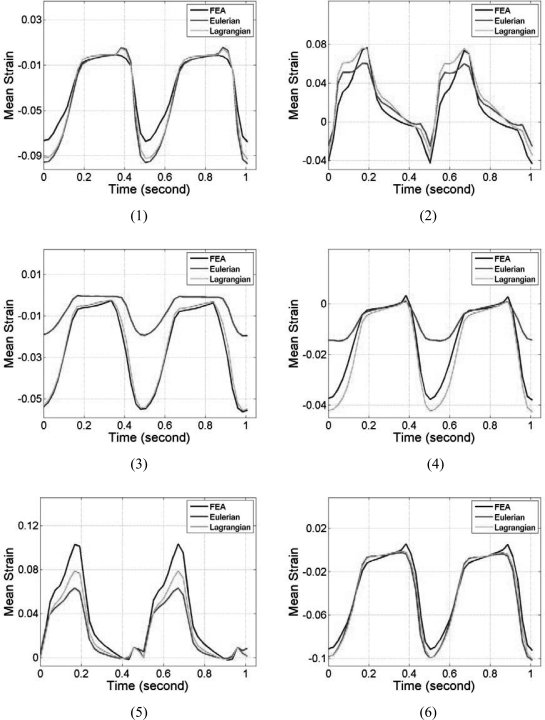
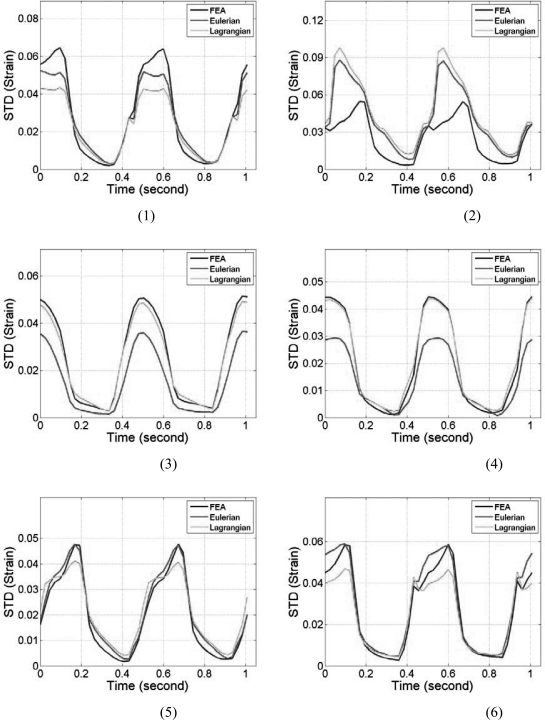
Note that the myocardial deformations along the axial direction in segments 2 and 5 are the largest among all six segments, mainly because, in these two segments, deformation is mostly in the axial direction. Observe the close correspondence between the Lagrangian and the ideal FEA results for the mean accumulated strain plots in Fig. 6, for all the segments. In a similar manner to the accumulated displacement results, the mean trend in segments 3 and 4 for the Eulerian strain estimates vary significantly from the ideal FEA results as observed from Fig. 6. The standard deviation of the accumulated strain distribution shown in Fig. 7, for the 6 segments, incurs relatively higher standard deviation values as expected when compared to the standard deviation of the accumulated displacements shown in Fig. 5. The standard deviation curves for the Lagrangian estimation closely follows the ideal FEA standard deviation except in segments 1 and 2, while the Eulerian estimation deviates from the ideal FEA curves for segments 1, 3, and 4 respectively.
Figure 6.
Comparison of the mean segmental accumulated strain variation with time for Lagrangian, Eulerian, and ideal FEA results. The segments are numbered from 1 to 6 as depicted in Fig. 3.
Figure 7.
Comparison of the standard deviation of the segmental accumulated stain variation with time for Lagrangian, Eulerian, and FEA results. The segments are numbered from 1 to 6 as depicted in Fig. 3.
Based on the accuracy and precision of the accumulated displacement and strain results shown with the simulated 3D canine model, we utilized the LDPG method and the traditional Eulerian based strain estimation to obtain segmental variations for radiofrequency data acquired on a volunteer. Note the difference in the identification of the segments as illustrated in Fig. 3 between the 3D FEA model and the data acquired for the parasternal short-axes views.
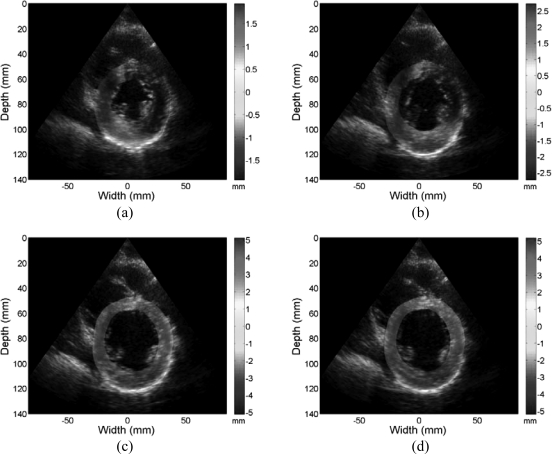
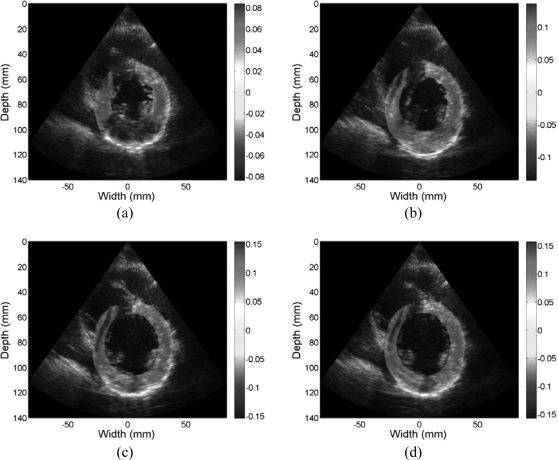
Figures 89 provide a representative example of the accumulated displacement and strain maps obtained at different time instants during cardiac cycle. Only the regions within the left ventricular wall contours are shown overlaid on their corresponding B-mode images. Note that due to the noisy nature of lateral displacement and strain with a phased array geometry, directional displacement and strain fields shown are along each A-line rather than along a Cartesian coordinate system. However, with the mapping of the displacement to a polar grid, we can easily obtain radial and circumferential strain distributions.
Figure 8.
Accumulated displacement images obtained from radiofrequency data acquired in vivo for a volunteer at different phases of cardiac cycle superimposed on the B-mode image. Displacement in the insonification direction toward the transducer is negative while displacement away from the transducer is positive. Images are presented at (a) 0%, (b) 25%, (c) 50%, and (d) 75% of the cardiac cycle.
Figure 9.
Accumulated strain images obtained from radiofrequency data acquired in vivo for a volunteer at different phases of cardiac cycle superimposed on the B-mode image. Both positive (red) and negative (blue) strain information (with respect to the ultrasound beam) is shown indicating both contractile, where tissue sections move closer together depicted as red regions and stretching of the cardiac muscle (blue) regions. Images are presented at (a) 0%, (b) 25%, (c) 50%, and (d) 75% of the cardiac cycle.
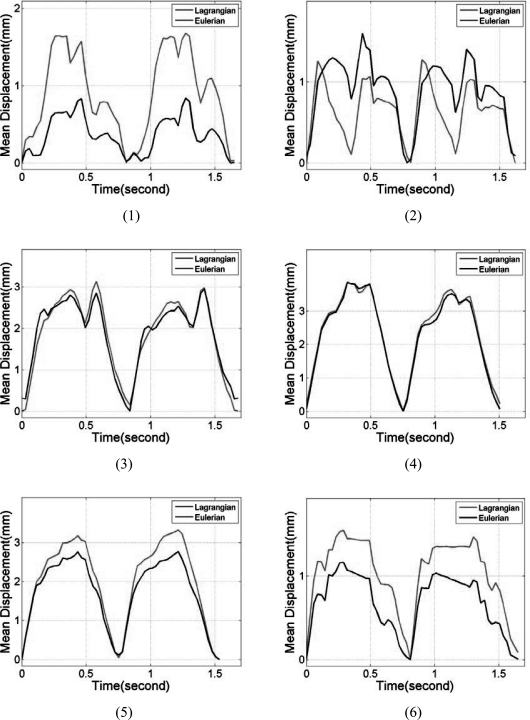
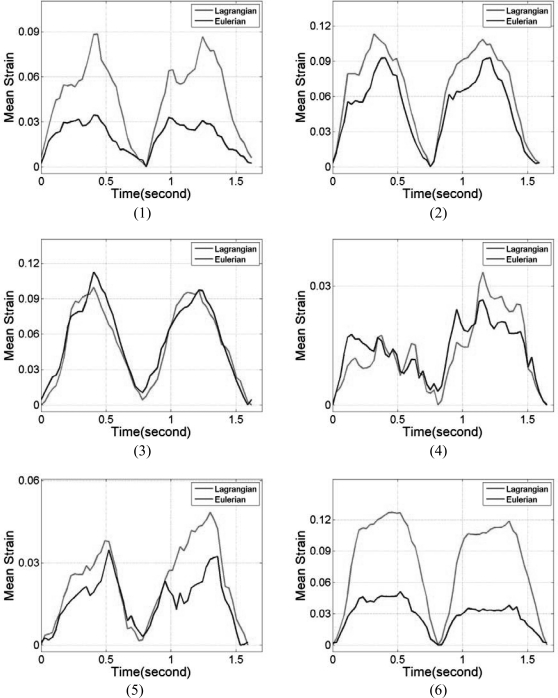
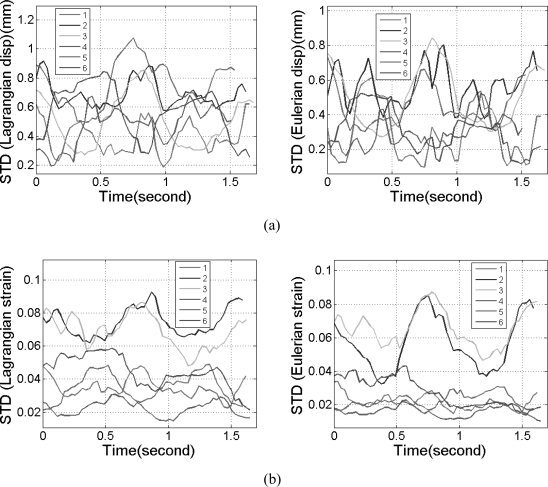
In vivo comparisons of the mean segmental accumulated displacement and strain variation over time between Lagrangian and Eulerian estimation for a volunteer are shown in Figs. 1011, respectively. Using the fact that, in a healthy heart, myocardial walls will return to its original status after each cardiac cycle, the lowest values in the curves were set to 0 to ensure better visual comparison. The standard deviations of the segmental accumulated displacement are presented in Figs. 12a, 12b for the strain distribution. The standard deviations in all the segments are presented for both the Lagrangian (LDPG) and the Eulerian approach presented in the paper.
Figure 10.
Comparison of the mean segmental accumulated displacement with time for the six segments for the volunteer using Lagrangian and Eulerian based estimation. Segments from 1 to 6 are delineated as depicted in Fig. 3.
Figure 11.
Comparison of the mean segmental accumulated strain with time for the six segments for the volunteer using Lagrangian and Eulerian based estimation. Segments from 1 to 6 are delineated as depicted in Fig. 3.
Figure 12.
The standard deviation of the (a) accumulated displacement and (b) strain field within each segment for the mean values shown in Figs. 1011, respectively.
DISCUSSION
The focus of this paper was on evaluating and quantifying the accuracy and precision of our Lagrangian displacement tracking algorithm using a polar grid. A semiautomated contour tracking method was used in this study to obtain the epi- and endocardial boundaries. Many automated contour tracking methods27, 35, 36, 37, 38, 39 have been described and extensively studied for echocardiographic images. However, these methods only concentrate on the tracking of epicardial and endocardial boundaries.
Precise tracking of myocardium locations within the boundaries over several cardiac cycles is challenging, using 2D speckle tracking based approaches. During the accumulation of the displacement estimates, a small displacement estimation error could accumulate rapidly, with the myocardial location in the next frame being estimated using the erroneous displacement obtained from previous frame. Thus, the displacement estimate extracted from the second frame would no longer represent the original section of the myocardium. The result will be that over several cardiac cycles, the accumulated deformation information intended for one section of the myocardium could end up with random contributions from different sections of myocardial tissue. Strain estimation using Eulerian approaches can be considered as an extreme case of accumulating errors in local displacement tracking into the accumulated displacement. For example, in Figs. 46, for the FEA based ultrasound simulation, the accumulated displacement and strain using the LDPG method agrees very well with the ideal displacement and strain from FEA model, while there were large differences between Eulerian estimation and ideal FEA results. A reason for the larger discrepancy is due to the FEA simulations modeling only the deformation of the ventricular walls with no data available within the ventricular cavities. Segments 3 and 4 incur larger deviations during a cardiac cycle since the myocardial deformation of the posterior wall is larger in these segments when compared to the other segments. As a result, the stationary contours utilized for the Eulerian description may include some of the ventricular cavity regions, causing the larger deviations.
In addition, when contour tracking fails for certain frames, the results obtained using the LDPG algorithm can localize these errors, since the polar grid from each frame uses contour information only from that frame, tracking errors do not propagate. The close agreement between the ideal FEA canine model results and the estimated displacement and strain estimated using our approach demonstrate the accuracy and precision of the LDPG algorithm for cardiac strain estimation proposed in this paper.
In this paper, the location of the centroid only determines the point over which the polar grid is generated between the epi- and endocardial contours for the 2D echocardiographic imaging plane. Local displacements estimated from frame to frame are not dependent on the location of the centroid. However, the displacement accumulation performed over the cardiac cycle depends on the location of the centroid since it forms the center of each polar grid for the Lagrangian displacement and strain. For the simulation data, since the deformation of each point within the myocardial wall is provided by the FEA model itself, the location of the centroid was not needed. The location of the centroid, however, may have an impact in determining the fidelity of the Lagrangian displacement and strain in the in vivo data, where we observe a small variation in the location of the centroid over a cardiac cycle.
Relatively large deviations can be observed between Eulerian and the ideal FEA based canine model results, showing that Eulerian description of displacement/strain is not an accurate index as far as cardiac deformation is concerned. This new approach is also corroborated in Figs. 1011, which plot the accumulated displacement and strain over invivo data acquired over a volunteer. In addition, note that the results for the Lagrangian and Eulerian methods provide slightly different results in some segments but agree with each other in other segments. Since the Eulerian description uses a stationary contour (i.e., the one obtained on the first B-mode image of the sequence), this may allow introduction of tissue regions surrounding the ventricle or ventricular cavity (blood) to move into the segments. Unlike the FEA simulation, these regions may introduce nonzero displacements and strain values. This could account for the discrepancy between the Eulerian and Lagrangian estimates of the accumulated displacement and strain under in vivo conditions.
CONCLUSION
The failure to track accumulated deformation of the myocardial tissue over cardiac cycles can lead to incorrect accumulated displacement and strain estimation results, even when the incremental displacement and strain estimations were relatively accurate. Since the location of each grid point is calculated based only the endo- and epicardial contours, and not based on the accumulated displacement at each grid point, tracking errors do not propagate to the next time frame, and thus displacement tracking errors are not accumulated with our approach. The performance of the LDPG method under in vivo imaging conditions was also shown in this paper, utilizing endocardial and epicardial contours generated on echocardiographic short-axis views. Simulation and in vivo clinical results demonstrate the accuracy of the LDPG algorithm. Although a semiautomated contour tracking method is used to provide epi- and endocardial contour information, the LDPG method can be readily coupled with any contour tracking method to ensure accurate myocardial deformation analysis.
ACKNOWLEDGMENTS
This work is supported in part by NIH Grant No. 5R21EB010098-03. The authors gratefully acknowledge the use of the cardiac mechanics model from the Cardiac Mechanics Research Group at UCSD.
References
- Azevedo J., “Diastolic heart failure: Identification and characterization. Doppler tissue imaging: a “new” approach,” Rev. Port. Cardiol. 18(Suppl 5), V25–V33 (1999). [PubMed] [Google Scholar]
- Price D. J., Wallbridge D. R., and Stewart M. J., “Tissue Doppler imaging: Current and potential clinical applications,” Heart 84(Suppl 2), II11–II18 (2000). 10.1136/heart.84.suppl_2.ii11 [DOI] [PMC free article] [PubMed] [Google Scholar]
- Ng A. C., Tran da T., Newman M., Allman C., Vidaic J., Kadappu K. K., Boyd A., Thomas L., and Leung D. Y., “Comparison of myocardial tissue velocities measured by two-dimensional speckle tracking and tissue Doppler imaging,” Am. J. Cardiol. 102, 784–789 (2008). 10.1016/j.amjcard.2008.05.027 [DOI] [PubMed] [Google Scholar]
- Becker M., Hoffmann R., Kuhl H. P., Grawe H., Katoh M., Kramann R., Bucker A., Hanrath P., and Heussen N., “Analysis of myocardial deformation based on ultrasonic pixel tracking to determine transmurality in chronic myocardial infarction,” Eur. Heart J. 27, 2560–2566 (2006). 10.1093/eurheartj/ehl288 [DOI] [PubMed] [Google Scholar]
- Jia C., Olafsson R., Huang S. W., Kolias T. J., Kim K., Rubin J. M., Xie H., and O’Donnell M., “Comparison of 2-D speckle tracking and tissue Doppler imaging in an isolated rabbit heart model,” IEEE Trans. Ultrason. Ferroelectr. Freq. Control 57, 2491–2502 (2010). 10.1109/TUFFC.2010.1715 [DOI] [PubMed] [Google Scholar]
- Varghese T., Zagzebski J. A., Rahko P., and Breburda C. S., “Ultrasonic imaging of myocardial strain using cardiac elastography,” Ultrason. Imaging 25, 1–16 (2003). [DOI] [PubMed] [Google Scholar]
- Chen H., Varghese T., Rahko P. S., and Zagzebski J. A., “Ultrasound frame rate requirements for cardiac elastography: Experimental and in vivo results,” Ultrasonics 49, 98–111 (2009). 10.1016/j.ultras.2008.05.007 [DOI] [PubMed] [Google Scholar]
- Chen H. and Varghese T., “Three-dimensional canine heart model for cardiac elastography,” Med. Phys. 37, 5876–5886 (2010). 10.1118/1.3496326 [DOI] [PMC free article] [PubMed] [Google Scholar]
- Konofagou E. E., D’Hooge J., and Ophir J., “Myocardial elastography—A feasibility study in vivo,” Ultrasound Med. Biol. 28, 475–482 (2002). 10.1016/S0301-5629(02)00488-X [DOI] [PubMed] [Google Scholar]
- Konofagou E., Lee W., and Ingrassia C., “A theoretical performance assessment tool for myocardial elastography,” Conf. Proc. IEEE Eng. Med. Biol. Soc. 1, 985–988 (2005). 10.1109/IEMBS.2005.1616582 [DOI] [PubMed] [Google Scholar]
- D’Hooge J., Heimdal A., Jamal F., Kukulski T., Bijnens B., Rademakers F., Hatle L., Suetens P., and Sutherland G. R., “Regional strain and strain rate measurements by cardiac ultrasound: Principles, implementation and limitations,” Eur. J. Echocardiogr. 1, 154–170 (2000). 10.1053/euje.2000.0031 [DOI] [PubMed] [Google Scholar]
- Ophir J., Cespedes I., Ponnekanti H., Yazdi Y., and Li X., “Elastography: A quantitative method for imaging the elasticity of biological tissues,” Ultrason. Imaging 13, 111–134 (1991). 10.1016/0161-7346(91)90079-W [DOI] [PubMed] [Google Scholar]
- Cespedes I., Ophir J., Ponnekanti H., and Maklad N., “Elastography: elasticity imaging using ultrasound with application to muscle and breast in vivo,” Ultrason. Imaging 15, 73–88 (1993). 10.1006/uimg.1993.1007 [DOI] [PubMed] [Google Scholar]
- Konofagou E. and Ophir J., “A new elastographic method for estimation and imaging of lateral displacements, lateral strains, corrected axial strains and Poisson’s ratios in tissues,” Ultrasound Med. Biol. 24, 1183–1199 (1998). 10.1016/S0301-5629(98)00109-4 [DOI] [PubMed] [Google Scholar]
- Zhu Y. and Hall T. J., “A modified block matching method for real-time freehand strain imaging,” Ultrason. Imaging 24, 161–176 (2002). [DOI] [PubMed] [Google Scholar]
- Shi H. R. and Varghese T., “Two-dimensional multi-level strain estimation for discontinuous tissue,” Phys. Med. Biol. 52, 389–401 (2007). 10.1088/0031-9155/52/2/006 [DOI] [PubMed] [Google Scholar]
- Chen L., Treece G. M., Lindop J. E., Gee A. H., and Prager R. W., “A quality-guided displacement tracking algorithm for ultrasonic elasticity imaging,” Med. Image Anal. 13, 286–296 (2009). 10.1016/j.media.2008.10.007 [DOI] [PMC free article] [PubMed] [Google Scholar]
- Jia C., Olafsson R., Kim K., Kolias T. J., Rubin J. M., Weitzel W. F., Witte R. S., Huang S. W., Richards M. S., Deng C. X., and O’Donnell M., “Two-dimensional strain imaging of controlled rabbit hearts,” Ultrasound Med. Biol. 35, 1488–1501 (2009). 10.1016/j.ultrasmedbio.2009.04.007 [DOI] [PMC free article] [PubMed] [Google Scholar]
- Chen X., Xie H., Erkamp R., Kim K., Jia C., Rubin J. M., and O’Donnell M., “3-D correlation-based speckle tracking,” Ultrason. Imaging 27, 21–36 (2005). [DOI] [PubMed] [Google Scholar]
- D’hooge J., Jamal F., Kukulski T., Kowalski M., Heimdal A., Thoen J., Suetens P., Rademakers F., Bijnens B., and Sutherland G. R., “Calculation of strain values from strain rate curves: How should this be done?,” Eur. Heart J. 21, 335–335 (2000). 10.1053/euhj.1999.1915 [DOI] [PubMed] [Google Scholar]
- Saber N. R. and Wen H., “Construction of the global lagrangian strain field in the myocardium using DENSE MRI data,” Conf. Proc. IEEE Eng. Med. Biol. Soc. 5, 3670–3673 (2004). 10.1109/IEMBS.2004.1404031 [DOI] [PubMed] [Google Scholar]
- Geyer , “Assessment of myocardial mechanics using speckle tracking echocardiography: Fundamentals and clinical applications (vol 23, pg 351, 2010),” J. Am. Soc. Echocardiogr. 23, 734–734 (2010). 10.1016/j.echo.2010.05.008 [DOI] [PubMed] [Google Scholar]
- Maurice R. L. and Bertrand M., “Lagrangian speckle model and tissue-motion estimation—theory,” IEEE Trans. Med. Imaging 18, 593–603 (1999). 10.1109/42.790459 [DOI] [PubMed] [Google Scholar]
- Luo J., Lee W. N., and Konofagou E. E., “Fundamental performance assessment of 2-D myocardial elastography in a phased-array configuration,” IEEE Trans. Ultrason. Ferroelectr. Freq. Control 56, 2320–2327 (2009). 10.1109/TUFFC.2009.1313 [DOI] [PubMed] [Google Scholar]
- Lopata R. G. P., Nillesen M. M., Hansen H. H. G., Gerrits I. H., Thijssen J. M., and de Korte C. L., “Performance of two dimensional displacement and strain estimation techniques using a phased array transducer,” Ultrasound Med. Biol. 35, 2031–2041 (2009). 10.1016/j.ultrasmedbio.2009.06.1101 [DOI] [PubMed] [Google Scholar]
- Chen H. and Varghese T., “Multilevel hybrid 2D strain imaging algorithm for ultrasound sector/phased arrays,” Med. Phys. 36, 2098–2106 (2009). 10.1118/1.3121426 [DOI] [PMC free article] [PubMed] [Google Scholar]
- Geiser E. A., Wilson D. C., Wang D. X., Conetta D. A., Murphy J. D., and Hutson A. D., “Autonomous epicardial and endocardial boundary detection in echocardiographic short-axis images,” J. Am. Soc. Echocardiogr. 11, 338–348 (1998). 10.1016/S0894-7317(98)70101-4 [DOI] [PubMed] [Google Scholar]
- Cerqueira M. D., Weissman N. J., Dilsizian V., Jacobs A. K., Kaul S., Laskey W. K., Pennell D. J., Rumberger J. A., Ryan T., and Verani M. S., “Standardized myocardial segmentation and nomenclature for tomographic imaging of the heart. A statement for healthcare professionals from the Cardiac Imaging Committee of the Council on Clinical Cardiology of the American Heart Association,” Circulation 105(4), 539–542 (2002). 10.1161/000402.102975 [DOI] [PubMed] [Google Scholar]
- Mazhari R., Omens J. H., Waldman L. K., and McCulloch A. D., “Regional myocardial perfusion and mechanics: A model-based method of analysis,” Ann. Biomed. Eng. 26, 743–755 (1998). 10.1114/1.74 [DOI] [PubMed] [Google Scholar]
- McCulloch A. D. and Mazhari R., “Regional myocardial mechanics: integrative computational models of flow-function relations,” J. Nucl. Cardiol. 8, 506–519 (2001). 10.1067/mnc.2001.117113 [DOI] [PubMed] [Google Scholar]
- Li Y. and Zagzebski J. A., “A frequency domain model for generating B-mode images with array transducers,” IEEE Trans. Ultrason. Ferroelectr. Freq. Control 46, 690–699 (1999). 10.1109/58.764855 [DOI] [PubMed] [Google Scholar]
- Kallel F. and Ophir J., “A least-squares strain estimator for elastography,” Ultrason. Imaging 19, 195–208 (1997). [DOI] [PubMed] [Google Scholar]
- Jiang J. and Hall T. J., “A parallelizable real-time motion tracking algorithm with applications to ultrasonic strain imaging,” Phys. Med. Biol. 52, 3773–3790 (2007). 10.1088/0031-9155/52/13/008 [DOI] [PubMed] [Google Scholar]
- Varghese T., Bilgen M., and Ophir J., “Multiresolution imaging in elastography,” IEEE Trans. Ultrason. Ferroelectr. Freq. Control 45, 65–75 (1998). 10.1109/58.646912 [DOI] [PubMed] [Google Scholar]
- Hozumi T., Yoshida K., Yoshioka H., Yagi T., Akasaka T., Takagi T., Nishiura M., Watanabe M., and Yoshikawa J., “Echocardiographic estimation of left ventricular cavity area with a newly developed automated contour tracking method,” J. Am. Soc. Echocardiogr. 10, 822–829 (1997). 10.1016/S0894-7317(97)70042-7 [DOI] [PubMed] [Google Scholar]
- Geiser E. A., Conetta D. A., Limacher M. C., Stockton V. O., Oliver L. H., and Jones B., “A second-generation computer-based edge detection algorithm for short-axis, two-dimensional echocardiographic images: Accuracy and improvement in interobserver variability,” J. Am. Soc. Echocardiogr. 3, 79–90 (1990). [DOI] [PubMed] [Google Scholar]
- Bosch J. G., Savalle L. H., van Burken G., and Reiber J. H., “Evaluation of a semiautomatic contour detection approach in sequences of short-axis two-dimensional echocardiographic images,” J. Am. Soc. Echocardiogr. 8, 810–821 (1995). 10.1016/S0894-7317(05)80005-7 [DOI] [PubMed] [Google Scholar]
- Yu E. H. C., Skyba D. M., Sloggett C. E., Jamorski M., Iwanochko R. M., Dias B. F., Rakovski H., and Siu S. C., “Determination of left ventricular ejection fraction using intravenous contrast and a semiautomated border detection algorithm,” J. Am. Soc. Echocardiogr. 16, 22–28 (2003). 10.1067/mje.2003.39 [DOI] [PubMed] [Google Scholar]
- Luo J. and Konofagou E. E., “High-frame rate, full-view myocardial elastography with automated contour tracking in murine left ventricles in vivo,” IEEE Trans. Ultrason. Ferroelectr. Freq. Control 55, 240–248 (2008). 10.1109/TUFFC.2008.633 [DOI] [PubMed] [Google Scholar]


