Abstract
Purpose: To investigate the feasibility of using an image-based method to correct for distortions induced by various artifacts in the x-ray spectrum recorded with photon-counting detectors for their application in breast computed tomography (CT).
Methods: The polyenergetic incident spectrum was simulated with the tungsten anode spectral model using the interpolating polynomials (TASMIP) code and carefully calibrated to match the x-ray tube in this study. Experiments were performed on a Cadmium-Zinc-Telluride (CZT) photon-counting detector with five energy thresholds. Energy bins were adjusted to evenly distribute the recorded counts above the noise floor. BR12 phantoms of various thicknesses were used for calibration. A nonlinear function was selected to fit the count correlation between the simulated and the measured spectra in the calibration process. To evaluate the proposed spectral distortion correction method, an empirical fitting derived from the calibration process was applied on the raw images recorded for polymethyl methacrylate (PMMA) phantoms of 8.7, 48.8, and 100.0 mm. Both the corrected counts and the effective attenuation coefficient were compared to the simulated values for each of the five energy bins. The feasibility of applying the proposed method to quantitative material decomposition was tested using a dual-energy imaging technique with a three-material phantom that consisted of water, lipid, and protein. The performance of the spectral distortion correction method was quantified using the relative root-mean-square (RMS) error with respect to the expected values from simulations or areal analysis of the decomposition phantom.
Results: The implementation of the proposed method reduced the relative RMS error of the output counts in the five energy bins with respect to the simulated incident counts from 23.0%, 33.0%, and 54.0% to 1.2%, 1.8%, and 7.7% for 8.7, 48.8, and 100.0 mm PMMA phantoms, respectively. The accuracy of the effective attenuation coefficient of PMMA estimate was also improved with the proposed spectral distortion correction. Finally, the relative RMS error of water, lipid, and protein decompositions in dual-energy imaging was significantly reduced from 53.4% to 6.8% after correction was applied.
Conclusions: The study demonstrated that dramatic distortions in the recorded raw image yielded from a photon-counting detector could be expected, which presents great challenges for applying the quantitative material decomposition method in spectral CT. The proposed semi-empirical correction method can effectively reduce these errors caused by various artifacts, including pulse pileup and charge sharing effects. Furthermore, rather than detector-specific simulation packages, the method requires a relatively simple calibration process and knowledge about the incident spectrum. Therefore, it may be used as a generalized procedure for the spectral distortion correction of different photon-counting detectors in clinical breast CT systems.
Keywords: photon-counting detector, pulse pileup, spectral CT, material decomposition.
INTRODUCTION
There has been extensive interest in the applications of energy discriminating photon-counting detectors in spectral computed tomography (CT).1, 2, 3, 4, 5, 6, 7, 8, 9, 10, 11, 12, 13, 14 Photon-counting detectors count individual photons based on pulse height analysis. Since the amount of charge generated by a single x-ray photon is proportional to the energy of the photon, energy-resolved information can be obtained through multiple energy thresholdings. Photon-counting detectors with an energy-resolving ability have three main advantages: (a) electronic noise can be effectively eliminated; (b) optimal energy weighting functions can be applied to improve the signal-to-noise ratio (SNR);15, 16 and (c) images in multiple energy windows can be generated with a single data acquisition without overlap in the x-ray spectrum, resulting in more efficient quantitative material identification. It has been reported that an ideal photon-counting detector with perfect energy resolution outperforms the conventional charge-integrating detector in image quality and detection tasks.17 It also suggests that photon-counting detectors may reduce the radiation dose to the patient while maintaining image quality comparable to the conventional charge-integrating detectors for various imaging tasks.13
In general, photon-counting detectors offer promising potentials for energy discrimination and improved SNR for spectral CT imaging.13 However, challenges still remain for its application in a clinical environment. State of the art photon-counting detectors based on semiconductors such as Sillicon,2, 3, 4, 5, 18 Cadmium Telluride (CdTe) (Refs. 10, 19, 20, 21, 22) and Cadmium-Zinc-Telluride (CZT) (Refs. 11, 23, 24, 25) offer a maximum count rate over 107 counts per second per square millimeter (cps/mm2).26, 27, 28 However, to avoid severe spectral distortion, the operational count rate is usually less than 1 × 10⁶ cps/mm2, which is a few orders of magnitude lower than the required operational count rate for clinical x-ray CT detectors.8 Even at such a low count rate, discernable distortions in the recorded spectrum may still exist, due to reasons other than count rate limitations, such as characteristic x-ray emission, especially for CdTe and CZT detectors.29, 30, 31, 32 At the same time, the detector’s count rate also depends on the pixel size required for specific imaging tasks. In clinical CT applications, a pixel pitch of less than 0.5 mm is usually desired. This leads to further challenges for the design of fast photon-counting detectors with linear energy response. Spectral CT imaging depends on a reliable measurement of the energy-dependent attenuation coefficient for different materials. Due to current challenges for the photon-counting detectors, substantial distortions in the incident spectrum can be expected at a high flux rate, which will severely limit the detector’s energy discriminating capability. A recent report has suggested that, due to spectral distortion, the benefits of photon-counting detectors in material identification disappeared when the count rate increased.17 Thus, it is critical to develop a technique that will account for the distortions in the output spectrum so reliable measurements can be made at the desired flux rate.
Spectral distortion in photon-counting detectors can be attributed to several artifacts, which are associated with both charge generation and transport in semiconductor crystals and pulse height analysis in readout electronics. One of the most intensively investigated artifacts is pulse pileup, which occurs when pulses arrive closer in time than the dead time of the readout electronics. All pulses arriving within the dead time will be recorded as a single count at a higher or lower energy depending on the probability distribution of time intervals between pulses. Therefore, pulse pileup induced dead time loss and spectral distortions depend strongly on the photon flux. At a high flux rate, pulse pileup induced artifacts can significantly reduce the accuracy of material decomposition in spectral CT imaging. While detectors with fast readout speeds are being actively investigated, it is also necessary to develop techniques to correct for such artifacts. An ideal hardware based pulse pileup rejecter removes the pileup induced distortion by detecting all pileup events through pulse width analysis and removing them from the spectrum, but it cannot restore the lost counts as a result of discarding the pileup events.33 A real pileup rejecter, however, cannot reject all pileup events and is quite challenging to implement it for clinical CT imaging, due to the high operational count rate.34, 35 Another approach, which has been widely used in studies on photon-counting detectors, sets the highest energy thresholds at the maximum tube voltage; thus, any pulse exceeding the threshold will be counted in the last energy bin (pileup bin) and excluded from data acquisition.6, 20 However, pulse pileup cannot be effectively eliminated in this approach because it can also occur below the maximum tube voltage. Furthermore, the dose efficiency will be reduced since photons registered in the pileup bin will not contribute to the imaging task. The percentage of the loss depends on the count rate and the shape of the spectrum. Alternative algorithmic methods have been investigated to model the spectral distortions induced by pulse pileup to estimate the pileup free spectrum from the measured spectrum.17, 34, 35, 36, 37, 38, 39, 40, 41, 42, 43 The pioneering works can be dated back to the 70s when Wielopolski and Gardner modeled pulse shape with a parabola and predicted the effect of first order pileup.35 Later, Barradas and Reis have extended the parabola model for higher order pileup events.39 Another approach, proposed by Johns and Yaffe in the late 1980s, used a pulse generator to iteratively estimate the incident spectrum.38 Most recently, Taguchi et al. modeled the bipolar pulse shape generated by a photon-counting detector with two triangles, and estimated the probability density function of the recorded energy based on the time interval of the pulses within the dead time.34, 40
In most cases, pulse pileup pushes the output spectrum toward the high energy side; while another artifact, charge sharing, often increases the number of counts in the low energy region. Since charge sharing effect does not depend on photon flux, spectral distortions induced by such effect can exist even at low count rate. A previous study showed that spectral distortion caused by charge sharing brought in cupping artifacts and inaccuracies of CT numbers when applying optimal energy weighting schemes, which substantially limits the photon-counting detector’s application in material segmentation.44 The major mechanisms of charge sharing artifact include characteristic x-ray emission, photoelectron range and charge carrier diffusion. For photon-counting detectors with large atomic numbers (CdTe/CZT), the characteristic x-ray emission, which consists of high energy photons, may escape from the primary pixel, resulting in energy loss and double counting if these escaped fluorescence photons are absorbed by neighboring pixels. Several studies have suggested that the spectral distortion due to the escape of cadmium- and tellurium-K fluorescent x-rays was severe in measured x-ray spectra.30, 31 Photoelectron range refers to the spatial distribution of the initial charge cloud generated by the incident x-ray photons. It increases as the photon energy becomes higher, and may lead to charge splitting among the adjacent pixels. Finally, the diffusion of charge carriers during charge collection increases the size of the charge cloud, thus may also lead to charge sharing. It is obvious that the effect of charge sharing has a strong dependence on the size of the pixel. Detectors with large pixel pitch may suffer less from charge sharing effects and more by pulse pileup than those with smaller pixel pitch. A recent study has suggested that the charge sharing effects should be taken into account when the pixel is smaller than 1 mm2.45 It is thus a major challenge that limits the spatial resolution of a photon-counting detector. Unlike the pulse pileup effect, charge sharing tends to remove counts from the high energy region. The distortion of the output spectrum is most readily observed in the low energy region. An analytical model has also been proposed to simulate the abnormally high counts in the low energy region for CdTe detectors by taking the effects of the photoelectron range, characteristic x-ray emission, and carrier diffusion into consideration.20 Therefore, charge sharing artifacts can be eliminated by increasing the electronic threshold. However, such an approach comes at the cost of losing low energy photons, which may be undesirable in many applications.
The ability to reproduce the input spectrum in photon-counting detectors can also be affected by other issues related to the inherent properties of the semiconductor, the contact properties of the electrode, and the design of the application-specific integrated circuit (ASIC). These include the polarizing effect due to space charge layer, static charge steering caused by defects in the crystal, charge trapping in compound semiconductors, limited charge collection time, nonlinear energy response, and many other issues. The complex nature of these physical limitations make it challenging to propose a comprehensive model to simulate all possible effects that lead to spectral distortion in photon-counting detectors. Furthermore, as an emerging technique in CT imaging, a wide variation of detector limitations can be expected. It is practically difficult to develop a generalized simulation package that can correct for spectral distortions for all detectors.
In this paper, we have presented an image-based spectral distortion correction with a CZT-based photon-counting detector for its application in clinical breast CT imaging. The correction method requires a simple calibration process and knowledge about the incident x-ray spectrum. It can be easily adapted for different detectors at any energy range.
METHODS
CZT Photon-counting detector
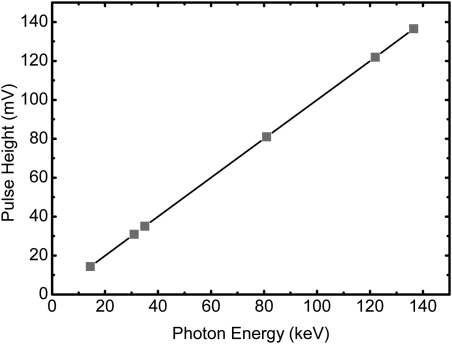
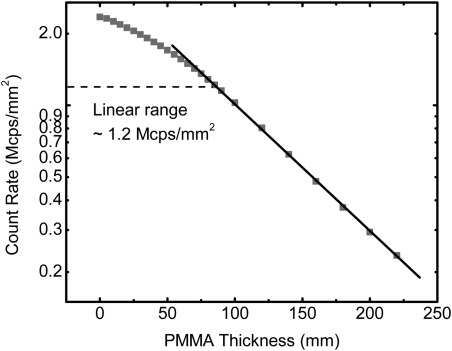
The photon-counting detector (eV2500, eV Microelectronics, Inc., Saxonburg, PA) studied in this paper consisted of a linear row of four CZT crystals 12.8 mm in length, 3 mm in width, and 3 mm in thickness. Each crystal was divided into 16 pixels, yielding a total of 64 pixels with each pixel having an effective pitch of 0.8 mm. A brass collimator shaped the entrance beam to the detector, collimating the height of each pixel to 0.8 mm. The peaking time of the detector was set at 160 ns. The trigger pulses generated by five comparators from each pixel are counted by a field programmable gate array chip (FPGA) over a user defined collection period (frame, selectable from 1 to 50 ms). Then, the FPGA sends each frame to the workstation over a USB interface for data processing, storage, and visualization.26, 46 The energy-resolving capability of the detector sorted the photons into five user-definable energy bins. The energy resolution was calibrated up to 140 keV by the detector’s manufacturer (Endicott Interconnect Detection & Imaging Systems). The pulse height linearity curve measured with 57Co and 133Ba is shown in Fig. 1. The maximum count rate of the detector is calibrated to be approximately 2.3 × 10⁶ cps/mm2. However, the linear count rate range derived from a thickness dependent study is less than 1.2 × 10⁶ cps/mm2, as shown in Fig. 2. The detector itself does not have any pulse pileup and charge sharing correction mechanisms.
Figure 1.
Pulse height linearity curve measured with 57Co and 133Ba.
Figure 2.
Count rate linearity curve for the CZT detector used in this study. The linear behavior is expected for count rate less than 1.2 × 10⁶ cps/mm2.
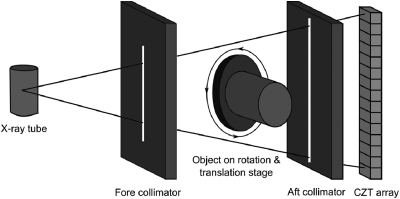
The detector was placed 1.35 m from a tungsten target x-ray tube (Dynamax 78E) coupled to a constant potential x-ray generator (Phillips Optimus M200). 2 mm of Al and 0.15 mm Cu were used as prefiltration. To minimize x-ray scatter, fore and aft collimators were constructed out of lead sheets that were 3 mm thick. The slit widths of the fore and aft collimators were 0.3 and 0.8 mm, respectively. A high precision Direct Drive Rotary (DDR) motor (Kollmorgen Goldline DDR D062M, Danaher Motion, Wood Dale, IL) provided the rotational mechanism for the CT scans and also served as the platform upon which the object was placed. The source to isocenter distance is approximately 0.93 m. A sketch of the detector setup is shown in Fig. 3.
Figure 3.
Schematic drawing of the spectral CT system based on CZT photon-counting detector.
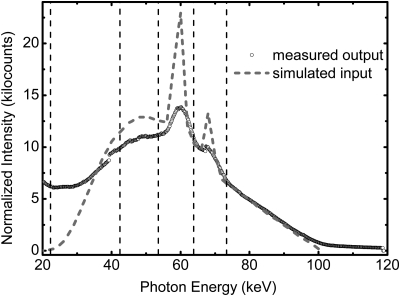
As a photon interacts in the CZT crystal, an electron hole pair is created for each 4.64 eV of the energy deposited in the crystal. The detector is operated in Ohmic mode with a bias voltage of 1000 V placed across the CZT crystal. Electrons generated after interaction of x-ray photons within the crystal are collected at the back electrode. A pulse whose height is proportional to the energy of the incoming photon is processed by the ASIC. A count will be registered if the pulse height was higher than the given threshold value. Therefore, the five user-definable thresholds serve as the lower boundaries of the corresponding energy bins. The count within an energy bin can be easily obtained by subtracting the count from its two adjacent thresholds. The detector can also be used in the spectrum collection mode where two thresholds can be simultaneously scanned over the whole energy range. The count difference between the two thresholds provides the number of recorded counts as a function of energy (i.e., the output spectrum of the detector [Fig. (4)].
Figure 4.
The recorded spectrum of the CZT detector and the simulated incident spectrum at tube voltage of 100 kVp and tube current of 1.0 mA. The spectra were normalized with respect to the integrated energy. Significant distortions can be observed in the measured spectrum due to multiple artifacts. The energy thresholds are noted by dashed lines for five energy bins.
Spectral distortion calibration process
The image-based calibration method discussed in this paper is somewhat similar to the signal-to-equivalent thickness calibration (STC) method proposed by Jakubek et al., which is proposed to correct beam hardening in the presence of a nonconstant energy response of the detector.47, 48, 49 Since the spectral distortion of a photon-counting detector is flux dependent, a multipoint calibration is required, using a set of uniform thickness phantoms that have equivalent attenuation properties as the sample. In the proposed method, the dependence of the detected counts on the calibration thickness is measured for each energy bin. At the same time, the expected counts at the corresponding calibration thickness can be simulated for an ideal detector without any image and spectral artifacts. Thus, for ith energy bin, the calibration function hi can be obtained, which translate the measured counts into simulated ones. The image of an unknown sample can then be corrected by applying the calibration function hi to each pixel, forming a new image that is free of spectral distortion.
Flat field measurement at multiple thicknesses
In order to simulate the tissue composition in breast imaging, BR12 phantoms consisting of 50% glandular and 50% adipose tissues were employed in the calibration process. A six-point flat field calibration at thicknesses of 0, 5, 10, 20, 40, and 90 mm was carried out. To avoid temporal nonuniformity, 500 frames were acquired at each calibration thickness. All measurements were acquired at a tube voltage of 100 kVp and a continuous tube current of 1.0 mA. The recorded count rate at this photon fluence was approximately 0.5 × 10⁶ cps/mm2, which is high enough to introduce distortions into the incident spectrum. Preliminary tests showed that the optimal, lowest energy threshold to eliminate electronic noise was 22 keV, which is used in the study as the lowest threshold. The second threshold was set at 42 keV, which was determined to give the highest SNR with respect to the absorbed dose in the breast for dual-energy decomposition of water, lipid and protein contents.50 The rest of the thresholds were selected at 53.5, 62.8, and 74 keV, so that the counts in the open field measurements can be evenly distributed among the energy bins. Note that the last energy bin did not have an upper boundary. Thus, all photons with energies above 22 keV have been used in the imaging process, which improved the dose efficiency. The mean counts over 500 frames were calculated for individual energy bins at each calibration thickness, which provided the thickness dependent curves for the measured counts with spectral distortion.
Spectral simulation
Since spectral distortion can be induced by several causes even at a low count rate, it is very difficult to obtain an ideal spectrum with photon-counting detectors that are designed for medical imaging applications. For this reason, we use simulated spectra to calculate the expected counts in each energy bin assuming there is no spectral distortion. The simulation follows the photon starting with its emission from the x-ray source, continuing on to its attenuation through the BR12 phantom of different thicknesses and finally ending with its subsequent absorption in the CZT detector. The x-ray spectrum generated from our tube was simulated with a tungsten anode spectral model using interpolating polynomials (TASMIP) developed by Boone’s group at UC Davis.51 In order to calibrate the original code to our x-ray tube, we measured the half value layer (HVL) with an ion chamber (20X6-0.6, Radcal Corporation, Monrovia, CA) in pencil beam geometry. The HVL was measured to be approximately 6.7 mm Al at tube voltage of 100 kVp. Then, proper prefiltration was selected in the simulation code to match the measured HVL, so that the simulated x-ray spectrum closely matched with the expected output from our tube. The simulated spectrum generated from the x-ray tube was then attenuated by BR12 phantoms and recorded with an ideal CZT detector. The thicknesses of the inserted BR12 phantoms used in the simulation were chosen to be the same as the values used in the flat field measurement discussed in the previous section.
To compare the simulated counts with the measured ones, we assume, in the first order approximation, that the energy was conserved during signal processing. The percentage of the energy loss induced by backscattering was assumed to be a constant in this model. Thus, the simulated spectra were normalized with respect to the total energy of the measured spectra for all six calibration thicknesses. After normalization, the simulated spectrum at each calibration thickness were divided into five energy bins, using the same thresholds as those in flat field measurement, and the integrated counts in each energy bin were recorded. In this way, we obtained the thickness dependent curve of the simulated counts in each energy bin, which represented the signal without any spectral distortion.
Empirical fitting function
The predominant artifacts in recorded spectra from photon-counting detectors are the dead time loss and pulse pileup induced spectral distortion. The probability density function of dead time loss [Pr(rec|aτ)] can be analytically simulated for both paralyzable and nonparalyzable models as follows:33
| (1) |
| (2) |
where τ is the dead time of the detector and a is the incident count rate. The two detection mechanisms behave similarly at low count rate and diverge at high count rate. In a recent study, the recorded count rate (NPPE(E)) with the presence of pulse pileup is expressed analytically as34
| (3) |
where Pr(E|rec) is the probability density function of the recorded energy E given the event-of-interest being recorded. However, the second probability in Eq. 3 depends on the pulse shape generated by the ASIC and can be very detector-specific. Moreover, real detectors usually work somewhere in-between the paralyzable and nonparalyzable models, introducing further difficulties for analytical simulations. Finally, other artifacts also play important roles in spectral distortions. For these reasons, we proposed an empirical fitting function, which has certain mathematical similarities with Eq. 1 and is expressed as
| (4) |
where Is and Im are the simulated and measured counts, respectively. Three fitting parameters (a0, a1, and b1) were introduced to accommodate for the nonlinear relations between the simulated and the measured counts.
The measured spectrum suffers from distortions induced by pulse pileup, charge sharing and other artifacts. The fitting suggested empirical relations of the measured spectrum and the ideal simulated spectrum. Eq. 4 was used to fit the calibration results in each energy bin. Five sets of fitting parameters (a0, a1, and b1) were obtained separately, which will be applied to the raw images in the corresponding energy bin for the spectral distortion correction. This will produce corrected images that matched to the simulated incident spectrum.
Performance evaluation
Correction for output spectrum
To evaluate the performance of the proposed spectral distortion correction method, three imaging tasks were investigated. First, we studied the spectral distortion correction on polymethyl methacrylate (PMMA) phantoms for different thicknesses. Images were acquired for 8.7, 48.8, and 100.0 mm PMMA phantoms. Spectral distortion corrections, derived from the six-point calibration, were applied individually to each of the five energy bins using an open source image processing software package.52 Temporal averaged counts for each energy bin in the raw and corrected images were obtained using over 500 frames. The incident spectra were simulated for PMMA phantoms of the same thicknesses, and were normalized using the same method as the calibration process. The simulated incident count for each energy bin was calculated by summing together the given energy ranges, and was used as the reference value for estimating the relative RMS error which is defined as
| (5) |
where Ic is the counts in a given energy bin after spectral distortion correction is applied, and n is the number of data points used in the measurement. The relative RMS error was used throughout the study as an evaluation matrix for the proposed spectral distortion correction method.
Linear attenuation coefficient correction
The capability of quantitative material decomposition with spectral CT measurements depends critically on a reliable measurement of the energy-dependent attenuation coefficient. Thus, it is necessary to evaluate the proposed spectral distortion correction for the estimation of the effective attenuation coefficient in ith energy bin (μi), which is defined as
| (6) |
where x represents the thickness of the PMMA phantom and I0i and Ixi are the measured counts in ith energy bin for open field and PMMA phantoms, respectively. In this context, the effective attenuation coefficients were estimated from the simulated, raw and corrected counts, respectively. The simulated values were used as the references for the comparison between the raw and the corrected data.
Quantitative material decomposition
Finally, image-based dual-energy subtraction was performed with a three-material phantom to evaluate the effect of the proposed correction method on quantitative material decomposition. A cylindrical phantom with a 3.18 cm diameter was constructed from a polyoxymethylene plastic (Delrin, Mac Master Carr, Inc., Elmhurst, IL), which has been suggested to offer similar x-ray attenuation properties as protein.53 Two holes, each 0.83 cm in diameter, were bored into the plastic cylinder and filled with water and vegetable oil, respectively. Thus, the phantom can be used for the three-material decomposition of water, lipid and protein contents.
A CT scan of the three-material phantom was acquired with a frame rate of 20 fps. The phantom was rotated at approximately 1.0 rpm. A full scan that covered 360° of rotation yielded a total of 1229 frames. CT scans were acquired at beam energy of 100 kVp with tube current of 1.0 mA with the same prefiltration discussed in Sec. 2A. The total entrance skin air kerma (ESAK) without backscattering was estimated to be 2.4 mGy. Dual-energy images were obtained within a single data acquisition using multiple thresholds. The low energy image was acquired using the first energy bin with the energy ranging between 22 and 42 keV; while the high energy image included all photons above 42 keV. All data acquired with the CZT detector were corrected for nonuniformity across pixels, using a flat field correction technique previously reported.13 The raw data and the spectrum distortion corrected images were both reconstructed using a filtered back-projection algorithm.
The CT images were reconstructed with a voxel size of 0.53 × 0.53 × 0.53 mm. The mean values and variations of the reconstructed attenuation coefficients for each material in the calibration phantom were measured within careful hand-delineated circular regions of interest (ROI) with identical diameters. The mean values of the reconstructed attenuation coefficients for water, lipid, and protein were further averaged over all slices and were used as calibration values for individual materials in the dual-energy subtraction. Subsequently, a large ROI, which included all three materials, were used to test the material decomposition performance. The expected volumetric fraction was estimated by areal analysis of pixel numbers for the contents (i.e., water, lipid, and protein). The detail about the three-material dual-energy decomposition has been discussed elsewhere.53
RESULTS
Shown in Fig. 4 is the comparison between the simulated and measured x-ray spectra at 100 kVp with tube current of 1.0 mA. The prefiltration in the simulated spectrum has been calibrated to match the quality and quantity characteristics of our x-ray tube, as discussed in Sec. 2B2. The measured spectrum was obtained using our CZT detector in its spectrum collection mode, where two thresholds separated by a small energy window were used to scan over the full energy range. Both the simulated and the measured spectra were normalized with respect to the integrated energy above 22 keV. The tungsten characteristic x-ray emission lines can be clearly observed in the measured raw spectrum. The energy response of the detector had a good calibration. This is indicated by the fact that the characteristic emissions’ energies agreed with the simulated spectrum with an error of ±1 keV. In the averaged spectrum recorded with the CZT detector, the full width at half maximum (FWHM) of tungsten kα peak at around 59.3 keV was estimated to be approximately 5.5 keV. Although the overall shape of the measured spectrum agreed relatively well with the simulated spectrum, distortions in the incident spectrum can be easily seen. For energies below 30 keV, the measured counts were significantly higher than the simulated spectrum, most likely due to charge sharing effect.20 However, in the intermediate energy range, the measured counts were comparably smaller. Finally, the measured counts in higher energy region exceeded that of the simulated spectrum and extended over the maximum tube voltage of 100 kVp.
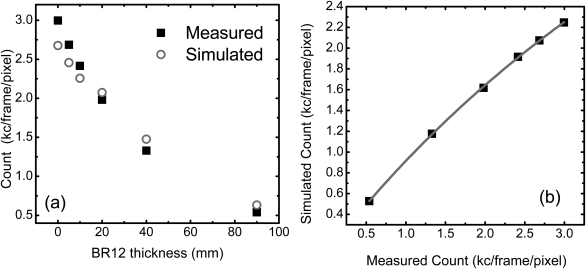
The thickness dependent curves of the counts in bin 5 obtained from both the flat field measurement and the simulation are presented in Fig. 5a. The measured counts were estimated from the temporal and the pixel average in bin 5. The simulated counts were obtained through integration of the simulated spectrum over the corresponding energy range in bin 5. Both values were estimated in unit of kilo-count/frame/pixel. The measured counts are higher than the simulated one for small calibration thicknesses, where the photon fluence is high. However, relative difference reduced as the phantom thickness increased. For large calibration thicknesses, the measured counts are slightly smaller than the simulated one, most likely due to the charge sharing effect, which splits a high energy photon into multiple low energy counts in the detector. The measured thickness dependent curves in the other energy bins also suggested a discernable deviation from the simulated ones, although the correlations between the two were distinct for each energy bin. As an example, the correlation between the measured and the simulated counts in energy bin 5 is shown in Fig. 5b, along with the semi-empirical fitting using Eq. 4. The fitting generated three calibration parameters for each energy bin, which will be used for the spectral distortion correction. For all energy bins, the fitting led to a R2 values over 0.999, suggesting a good correlation between the chosen empirical function and the experimental data.
Figure 5.
(a) Simulated and measured counts as a function of the BR12 phantom thickness in energy bin 5. (b) Empirical fitting using Eq. 4 for the correlation between the simulated and the measured counts in bin 5. The counts are presented in unit of kilo-count per frame per pixel (kc/frame/pixel).
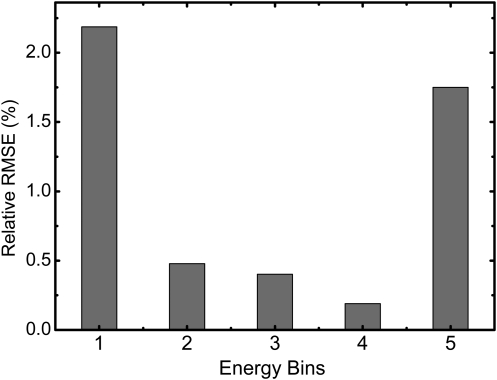
Shown in Fig. 6 is the relative RMS error of the measurements for the BR12 phantoms after the spectral distortion corrections were applied. The spectral distortion corrections, derived from the calibration process with the same set of phantoms, were first applied on each pixel in the measured image of 500 frames. The temporal and pixel average were then performed to get the mean values used for error analysis. The results were presented for each of the five energy bins. The relative RMS errors of bins 1 and 5 were estimated to be approximately 2%, while that of the other bins were less than 0.5%.
Figure 6.
The relative RMS error at different energy bins for BR12 phantoms after the spectral distortion correction, which is derived from the same set of measurements. The results predict the uncertainties of the proposed correction method.
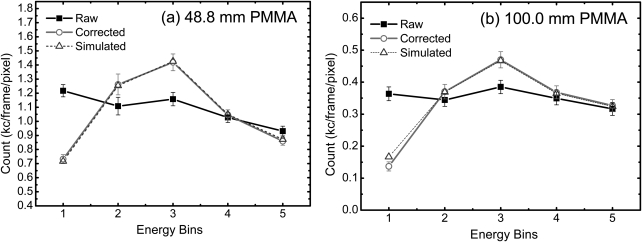
The capability of spectral distortion correction was tested with PMMA phantoms. The results are shown in Figs. 7a, 7b for 48.8 and 100.0 mm PMMA phantoms, respectively. The mean counts of the raw data from the direct measurements, the corrected data after we applied spectral distortion corrections, and the simulated data were plotted for each of the five energy bins. The error bars were derived from the standard deviation of the counts in the corresponding image after flat field correction. The result from the 8.7 mm PMMA phantom suggested a similar trend but is not presented here. For all three PMMA thicknesses, significant discrepancies in the counts can be observed in most energy bins when the raw data and the simulated incident counts were compared. The large discrepancy in energy bin 1 was most likely due to the charge sharing effect, which splits high energy photons into multiple counts in the detector. While the higher counts measured in bin 5 can be attributed to pulse pileup effect. This agreed well with the behaviors observed in Fig. 4. The relative RMS errors for the raw data were estimated to be 23.0%, 33.0%, and 54.0% for 8.7, 48.8, and 100 mm PMMA phantoms, respectively. For the thick phantom [Fig. 7b], pulse pileup was effectively limited at the given count rate, as suggested by the good match of the counts in bin 5. However, since charge sharing effect does not depend on the flux, substantial discrepancy of the counts can still be observed in bin 1, which has a relative error of 120%. The implementation of the spectral distortion correction dramatically improved the quality of the experimental data. There is a good agreement between the corrected and the simulated counts for all the energy bins. The relative RMS errors reduced to 1.2%, 1.8%, and 7.7% for 8.7, 48.8, and 100 mm PMMA phantoms, respectively.
Figure 7.
Comparison of the raw and the spectral distortion corrected counts for five energy bins with respect to the simulated values for (a) 48.8 mm and (b) 100.0 mm PMMA phantoms. The error bars were derived from the standard deviation of the images after flat field correction.
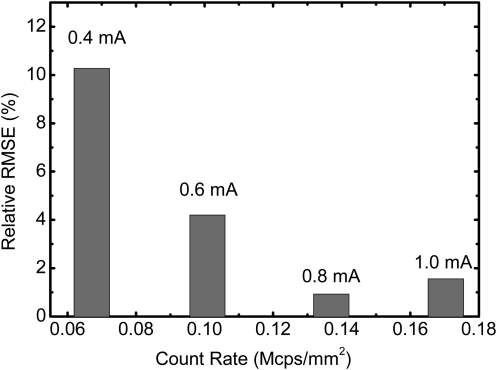
In Fig. 8, the relative RMS error of the spectral distortion corrected image for 48.8 mm PMMA phantom was presented as a function of the total count rate in the full energy range. The count rate variation was achieved by reducing the tube current from 1.0 mA down to 0.4 mA while the beam voltage and the prefiltrations were kept the same. The relative RMS error goes up as the count rate reduces, reaching about 10% at a count rate of ∼6.0 × 10⁴ cps/mm2, which is about ten times less than that of the open field. The relative RMS error is determined by a propagation of errors caused by both spectral distortion and quantum statistics. Therefore, the increase of error at low count rates can be attributed to the increase of the statistical error as the photon fluence decreases.
Figure 8.
Relative RMS error of the spectral distortion corrected counts with respect to the simulated values for 48.8 mm PMMA phantom at 100 kVp with different incident photon fluence. The variation of the incident count rate hitting the detector was achieved by tuning the tube current, which is noted in the figure on top of the corresponding data points.
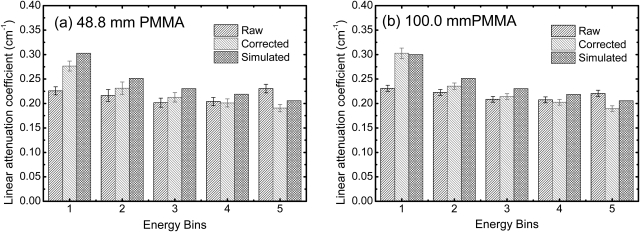
The capability of the proposed spectral distortion correction was also evaluated by estimating the effective x-ray attenuation coefficient. A comparison between the raw and corrected data with respect to the simulated attenuation coefficient is presented in Fig. 9. The estimated attenuation coefficients were individually calculated for each energy bin. The errors were estimated from the open field and the attenuated images using standard error propagation theory. It can be seen that utilizing raw data without any corrections resulted in underestimating the attenuation coefficients in the first four energy bins and overestimating in the last energy bin. For both PMMA thicknesses, the estimated effective attenuation coefficients have been improved after the spectral distortion correction was applied. The relative RMS errors were reduced from 19.0%, 15.5%, and 12.9% to 1.4%, 7.9%, and 6.7% for 8.7, 48.8, and 100.0 mm PMMA phantoms, respectively.
Figure 9.
The effective linear attenuation coefficients in five energy bins derived from both the raw images and the spectral distortion corrected images for (a) 48.8 mm and (b) 100.0 mm PMMA phantoms. The simulated values are also presented here for reference. The error bars were derived from the open field and attenuated images using error propagation theory.
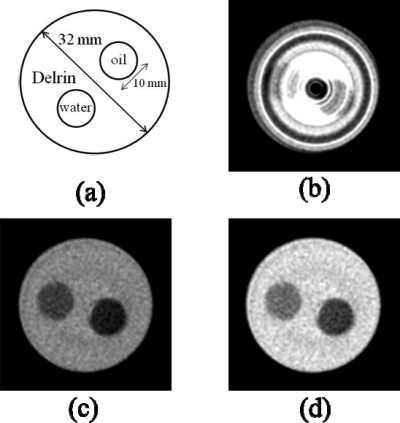
Finally, improvement in the proposed spectral distortion correction in material decomposition is studied with a three-material phantom. Figure 10 shows a sketch of the composition and the size of the decomposition phantom (a), and the reconstructed CT slices in the first energy bin (22∼42 keV) (b)–(d). Note that all CT images were displayed using the same window and level settings. In Fig. 10b, image was reconstructed directly from the raw data, where significant nonuniformity of the pixel response results in severe ring artifacts. Such artifact was greatly reduced when the flat field correction was applied, as shown in Fig. 10c. The relative fluctuation (i.e., standard deviation over mean value) in the flat field image was reduced from 20.8% to 0.9%. In Fig. 10d, the spectral distortion correction was applied on flat field-corrected data. It can be seen that the reconstructed attenuation coefficients of all three materials increase after the spectral distortion correction is applied. However, the proposed method basically redistributes the counts among all energy bins according to the simulated values, while keeping the total counts about the same as the raw image. Thus, the improvement of the contrast-to-noise ratio (CNR) is not substantial. After spectral distortion correction, the relative increase of the dual-energy CNR for water, lipid and protein is approximately 4%, 6%, and 10%, respectively.
Figure 10.
A sketch of the three-material decomposition phantom (a), Reconstructed CT slice from raw data (b), flat field corrected data (c), and flat field in addition to spectral distortion corrected data (d). All CT images were displayed using the same window and level.
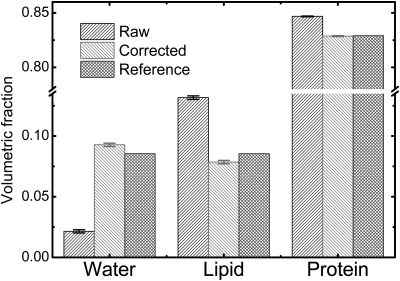
The volumetric fractions of the water, lipid and protein contents in the decomposition phantom were calculated with and without the spectral distortion correction, respectively, and presented in Fig. 11 along with the reference values. Note that the y-axis in the figure is represented by a broken line to emphasize the small values in water and lipid fractions. The error bars were obtained from the standard deviation of the volumetric fractions calculated from multiple slices. For areal analysis using reconstruction CT images, the volumetric fractions for water, lipid and protein contents were expected to be 8.5%, 8.5%, and 83.0%, respectively. Dual-energy subtraction based on uncorrected raw image predicted a relatively good volumetric fraction for protein, the major content in our phantom. However, no reliable estimation can be made for water and lipid contents. The relative RMS error for the three components in Fig. 11 was estimated to be 53.3%. The implementation of the spectral distortion correction on the raw image reduced the relative RMS error to 6.8%. A summary of the RMS errors for the above studies were presented in Table Table I. for a better visualization of the improvement induced by the proposed correction method.
Figure 11.
Volumetric fractions of the water, lipid, and protein contents derived from dual-energy imaging of the three-material decomposition phantom. The results based on the raw images and the corrected images are compared to the reference values which were obtained by areal analysis of the reconstruction CT image. Note that the y-axis in the figure is represented by a broken line to emphasize the small values in water and lipid fractions. The material decomposition using the proposed correction method provided accurate quantitative information with a relative RMS error of approximately 6.8%.
Table I.
The relative RMS errors in the evaluation studies with (W/) and without (W/O) spectral distortion corrections.
| Count rate | Effective μ | Volumetric fraction | |||||||||||
|---|---|---|---|---|---|---|---|---|---|---|---|---|---|
| Studies | W/O (%) | W/(%) | W/O (%) | W/ (%) | W/O (%) | W/ (%) | |||||||
| 8.7 mm PMMA | 23.0 | 1.2 | 19.0 | 1.4 | — | — | |||||||
| 48.8 mm PMMA | 33.0 | 1.8 | 15.5 | 7.9 | — | — | |||||||
| 100.0 mm PMMA | 54.0 | 7.7 | 12.9 | 6.7 | — | — | |||||||
| Decomposition phantom | — | — | — | — | 53.3% | 6.8% | |||||||
Table I Ding et al.
DISCUSSIONS
The proposed spectral distortion correction algorithm for photon-counting x-ray detectors requires a relatively simple calibration process and knowledge about the incident x-ray spectrum. A three-parameter empirical function was employed to fit the simulated incident counts with the measured ones in a given energy bin. The empirical function can then be applied on a raw image to correct for spectral distortions induced by various artifacts in the photon-counting detectors. Spectral distortion correction’s effectiveness for breast imaging was validated with measurements from PMMA phantoms, as shown in Fig. 7 where the relative RMS error was reduced from 33.0% to 1.8%. Furthermore, the proposed correction algorithm improved the accuracy in estimation of the energy-dependent attenuation coefficient. The spectral distortion presented in the raw image obtained from the photon-counting detectors led to unreliable measurements of the attenuation coefficients, which is the fundamental basis for material decomposition in dual-energy imaging. The results in Figs. 911 suggested that there is an error of approximately 15% in the attenuation coefficient estimate when using raw images without any spectral distortion correction. Furthermore, the errors will be further magnified in dual-energy decomposition. It can be seen from Fig. 11 that it is challenging to quantify the water and lipid contents with the raw images in dual-energy imaging because even small uncertainties can introduce significant quantification errors. This is due to the fact that the difference in attenuation properties for water and lipid is very small. However, the results from the corrected images suggested that an accurate quantitative material decomposition can be achieved when the proposed spectral distortion correction algorithm was implemented.
Previous studies based on analytical models or Monte Carlo method usually targeted only one artifact that led to spectral distortions.17, 34, 41, 45 Therefore, their ability to predict and correct the measured images is limited when the input count rate for a detector is very high. Theoretically, the counting mode of a photon-counting detector can be simulated with either a paralyzable or a nonparalyzable model. However, the real detector usually works somewhere in-between.40 The semi-empirical method we proposed in this study does not require knowledge of the detection mechanism; rather, it is based on a relatively simple calibration process. Therefore, it can be implemented on any photon-counting detectors. In addition, the method is not limited by the count rate. We have also tested the method at 0.75 × 10⁶ cps/mm2 with similar results. Moreover, the correction method worked well when the percentage of distortion increases in a given energy bin. Since the amount of spectral distortion depends greatly on the selection of the energy window, one can vary the ratio between the simulated and the measured counts by shifting the energy threshold. For example, setting the last threshold at 90 keV for images obtained at beam energy of 100 kVp results in a huge deviation of the measured counts with respect to the simulated count rate. Our recent study has suggested that the percentage of the falsely registered counts in this bin, induced mostly by pulse pile up, can be as high as 70%. Even in this case, Eq. 4 worked effectively in fitting of the correlation between measured and simulated counts, and led to good correction results.
In the calibration process, an empirical fitting function [Eq. 4] was employed to represent the nonlinearity between the measured and incident counts for the photon-counting detectors. The equation was derived as a simplified version of a function used in dual-energy material decomposition.54 We chose the current function for three reasons. First, there is a mathematical similarity between Eq. 4 and the probability of dead time loss for a nonparalyzable detector.34 The latter is one of the major contributing factors to estimate spectral distortion induced by pulse pileup.40 Moreover, the function can handle nonlinearity between the recorded and simulated counts. Finally, there is a finite limit for when the count rate becomes infinitely small or large. The high correlation coefficients shown in Fig. 5 and the successful implementation in spectral distortion corrections argued in favor of Eq. 4 in spite of its simple format. Other empirical functions may also be used for calibration. However, a linear fitting won’t be good enough to correct the errors induced by the distortion, due to the nonlinear nature of some of the artifacts, such as pulse pileup effect. One should also be cautious in the selection of the fitting function, if the measured counts fall outside the calibration range.
In the proposed method, the calibration process utilized the averaged counts for a given energy bin while the correction process was applied directly on the measured raw images for each pixel. The averaged counts after correction were used to evaluate the method’s performance. The temporal fluctuation of the tube output was removed by averaging over 500 frames. Since Eq. 4 is a nonlinear function, the corrected counts may deviate from the original fitting depending on the nonlinearity of the fitting curve, which is mainly determined by the absolute value of b1, and the pixel counts in the raw image. This is why when we tested the correction power on BR12 phantom with the calibrations obtained from the same set of data, the relative RMS errors for bins 1 and 5 were higher than the other three bins, as shown in Fig. 6. Another point to note in Fig. 6 is that the inherent uncertainty induced by the proposed algorithm is less than 2%, as indicated by the error levels presented in this study.
In order to scale the simulated incident spectrum to the measured one in the proposed spectral distortion correction method, we assumed that the total energy was conserved. While the assumption could be correct in the first order approximation, the report also suggested that there might be an overestimation in the recorded energy.41 However, in spectral CT imaging, the attenuation coefficients reconstructed from different energy bins were used for material differentiation. Thus, it is the relative count change in adjacent energy bins that determined the characteristics of the energy-dependent attenuation coefficient, as opposed to the absolute counts in each energy bin. The integrated energy above the noise floor was used as the scaling factor to preserve information about the relative magnitude of the counts in different energy bins. Therefore, this was a reasonable assumption in this study. It should also be noted that backscattered photons remove energy from the direct beam. Energy loss induced by backscattering was not included in the current simulation. The approach to use the integrated energy as the scaling factor basically assumes a unique backscattering probability for photons with different energies. The accuracy of the method may be further improved if the energy-dependent backscattering probability can be included in the model.
To evaluate the performance of the proposed algorithm, the relative RMS error was intensively used throughout the study to compare the raw and the corrected results with respect to the simulated results. However, it is also important to note that other sources of error may, at the same time, contribute to the estimated relative RMS error. For example, the effect of the statistical error was investigated (Fig. 8). An increase in relative RMS error as count rate decreased can be explained by the increase in quantum error that occurs at low photon fluence. For this reason, the relatively larger RMS error of 7.7% for a 100 mm PMMA phantom can be attributed, at least partially, to the contribution of the quantum error (Fig. 7), as the count rate here was similar to that measured at 0.4 mA for 48.8 mm PMMA phantom (the first data point in Fig. 8).
The proposed spectral distortion correction algorithm depended on accurate fitting of the calibration data. Error levels can be further reduced if the calibration uses more data points with smaller steps and an extended count rate range. The size and the attenuating properties of the sample will affect the measured count rate. An ideal calibration should cover all possible count rates that may occur in the sample measurement, so that the size induced variation is not a concern. The proposed correction may also face challenges when the quality of the incident beam has been dramatically modified, such as a significant change in the prefiltration. A new calibration should be carried out to ensure effective corrections of the distorted spectrum. In addition, the selection of the calibration material also plays a role in the effectiveness of the proposed correction method. Ideally, the material used for calibration should resemble the tissues in the imaging task in terms of the x-ray attenuation properties, since the method depends on the incident spectrum at the surface of the detector. The purpose of this study is to evaluate the proposed method for the photon-counting detectors in breast imaging. For this reason, BR12 phantoms were used in the calibration process, since they have similar attenuation properties as the breast tissue. In the evaluation studies, we have shown that the proposed method worked well for PMMA phantoms up to 10 cm and polyoxymethylene plastic. Evaluations based on postmortem breast tissues are currently under investigation in our group. The proposed method is expected to generate correct images in most cases, due to the relatively homogenous composition of the breast tissue. However, increased errors may be presented when high attenuation materials, such as bone, dominate the field of view in other imaging tasks. In that case, new calibration materials should be properly selected to match the investigated sample. Finally, the calibration used averaged counts for the individual energy bins. Thus, the correction depends on the selection of the energy thresholds. The proposed algorithm was shown to successfully correct for nonlinearity with increasing count rate. However, the error from the correction may still increase if the distortion fraction is too high in a given energy bin. It would also be more favorable to distribute the counts evenly among all energy bins so that the nonlinearity induced by high pixel count will not introduce deviations from the fitting curve, as discussed in the previous paragraph.
CONCLUSIONS
In conclusion, we have developed a method to correct for distortions in the recorded spectrum of a photon-counting detector for its application in breast CT. The image-based semi-empirical algorithm requires only a simple calibration and knowledge about the incident x-ray spectrum. It can be potentially implemented with any photon-counting detector to correct for spectral distortions induced by various artifacts. We have shown that the raw images from a photon-counting detector may contain significant spectral distortions, which hampers a reliable estimation of the energy-dependent attenuation coefficient that is essential for quantitative material decomposition in spectral CT application for breast imaging. The proposed spectral distortion correction algorithm can effectively reduce the relative error in a three-material decomposition task from 53.3% to 6.8%. Thus, it is critical to implement spectral distortion correction for photon-counting detectors for their application in spectral breast CT.
ACKNOWLEDGMENTS
This work is supported in part by NIH/NCI Grant No. R01CA13687. The authors would like to thank David Rundle from Endicott Interconnect Detection & Imaging Systems for his technical support and fruitful discussions.
References
- Shikhaliev P. M., “Computed tomography with energy-resolved detection: A feasibility study,” Phys. Med. Biol. 53, 1475–1495 (2008). 10.1088/0031-9155/53/5/020 [DOI] [PubMed] [Google Scholar]
- Bert C., Niederlohner D., Giersch J., Pfeiffer K. F., and Anton G., “Computed tomography using the Medipix1 chip,” Nucl. Instrum Methods Phys. Res. A 509, 240–250 (2003). 10.1016/S0168-9002(03)01633-4 [DOI] [Google Scholar]
- Chmeissani M., Frojdh C., Gal O., Llopart X., Ludwig J., Maiorino M., Manach E., Mettivier G., Montesi M. C., Ponchut C., Russo P., Tlustos L., and Zwerger A., “First experimental tests with a CdTe photon counting pixel detector hybridized with a Medipix2 readout chip,” IEEE Trans. Nucl. Sci. 51, 2379–2385 (2004). 10.1109/TNS.2004.832324 [DOI] [Google Scholar]
- Niederlohner D., Nachtrab F., Michel T., and Anton G., “Using the Medipix2 detector for photon counting computed tomography,” Nuclear Science Symposium Conference Record, 2005 IEEE 4, 2327–2331 (2005). [Google Scholar]
- Bisogni M. G., Del Guerra A., Lanconelli N., Lauria A., Mettivier G., Montesi M. C., Panetta D., Pani R., Quattrocchi M. G., Randaccio P., Rosso V., and Russo P., “Experimental study of beam hardening artifacts in photon counting breast computed tomography,” Nucl. Instrum. Methods Phys. Res. A 581, 94–98 (2007). 10.1016/j.nima.2007.07.036 [DOI] [Google Scholar]
- Wang X. L., Meier D., Taguchi K., Wagenaar D. J., Patt B. E., and Frey E. C., “Material separation in x-ray CT with energy resolved photon-counting detectors,” Med. Phys. 38, 1534–1546 (2011). 10.1118/1.3553401 [DOI] [PMC free article] [PubMed] [Google Scholar]
- Wang X., Meier D., Oya P., Maehlum G. E., Wagenaar D. J., Tsui B. M. W., Patt B. E., and Frey E. C., “Microcomputed tomography with a second generation photon-counting x-ray detector—Contrast analysis and material separation,” Proc. SPIE 76221B, 76228 (2010). 10.1117/12.844301 [DOI] [Google Scholar]
- Taguchi K., Srivastava S., Kudo H., and Barber W. C., “Enabling photon counting clinical x-ray CT,” 2009 IEEE Nuclear Science Symposium and Medical Imaging Conference (2009).
- Barber W. C., Nygard E., Wessel J. C., Malakhov N., Wawrzyniak G., Hartsough N. E., Gandhi T., Beck T. J., Taguchi K., and Iwanczyk J. S., “Large area photon counting x-ray imaging arrays for clinical dual-energy applications,” 2009 IEEE Nuclear Science Symposium and Medical Imaging Conference (2009).
- Pan D., Roessl E., Schlomka J. P., Caruthers S. D., Senpan A., Scott M. J., Allen J. S., Zhang H. Y., Hu G., Gaffney P. J., Choi E. T., Rasche V., Wickline S. A., Proksa R., and Lanza G. M., “Computed tomography in color: NanoK-enhanced spectral CT molecular imaging,” Angew. Chem. Int. Edit. 49, 9635–9639 (2010). 10.1002/anie.201005657 [DOI] [PMC free article] [PubMed] [Google Scholar]
- Shikhaliev P. M. and Fritz S. G., “Photon counting spectral CT versus conventional CT: Comparative evaluation for breast imaging application,” Phys. Med. Biol. 56, 1905–1930 (2011). 10.1088/0031-9155/56/7/001 [DOI] [PubMed] [Google Scholar]
- Herrmann C., Engel K. J., and Wiegert J., “Performance simulation of an x-ray detector for spectral CT with combined Si and Cd[Zn]Te detection layers,” Phys. Med. Biol. 55, 7697–7713 (2010). 10.1088/0031-9155/55/24/020 [DOI] [PubMed] [Google Scholar]
- Le H. Q., Ducote J. L., and Molloi S., “Radiation dose reduction using a CdZnTe-based computed tomography system: Comparison to flat-panel detectors,” Med. Phys. 37, 1225–1236 (2010). 10.1118/1.3312435 [DOI] [PMC free article] [PubMed] [Google Scholar]
- Le H. Q. and Molloi S., “Least squares parameter estimation methods for material decomposition with energy discriminating detectors,” Med. Phys. 38, 245–255 (2011). 10.1118/1.3525840 [DOI] [PMC free article] [PubMed] [Google Scholar]
- Schmidt T. G., “Optimal “image-based,” weighting for energy-resolved CT,” Med. Phys. 36, 3018–3027 (2009). 10.1118/1.3148535 [DOI] [PubMed] [Google Scholar]
- Giersch J., Niederlohner D., and Anton G., “The influence of energy weighting on x-ray imaging quality,” Nucl. Instrum. Methods Phys. Res. A 531, 68–74 (2004). 10.1016/j.nima.2004.05.076 [DOI] [Google Scholar]
- Wang A. S., Harrison D., Lobastov V., and Tkaczyk J. E., “Pulse pileup statistics for energy discriminating photon counting x-ray detectors,” Med. Phys. 38, 4265–4275 (2011). 10.1118/1.3592932 [DOI] [PubMed] [Google Scholar]
- Frallicciardi P. M., Jakubek J., Vavrik D., and Dammer J., “Comparison of single-photon counting and charge-integrating detectors for x-ray high-resolution imaging of small biological objects,” Nucl. Instrum. Methods Phys. Res. A 607, 221–222 (2009). 10.1016/j.nima.2009.03.158 [DOI] [Google Scholar]
- Wagenaar D. J., Chowdhury S., Engdahl J. C., and Burckhardt D. D., “Planar image quality comparison between a CdZnTe prototype and a standard NaI(T1) gamma camera,” Nucl. Instrum. Methods Phys. Res. A 505, 586–589 (2003). 10.1016/S0168-9002(03)01153-7 [DOI] [Google Scholar]
- Wang X., Meier D., Mikkelsen S., Maehlum G. E., Wagenaar D. J., Tsui B. M. W., Patt B. E., and Frey E. C., “MicroCT with energy-resolved photon-counting detectors,” Phys. Med. Biol. 56, 2791–2816 (2011). 10.1088/0031-9155/56/9/011 [DOI] [PMC free article] [PubMed] [Google Scholar]
- Barber W. C., Nygard E., Iwanczyk J. S., Zhang M., Frey E. C., Tsui B., Wessel J. C., Malakhov N., Wawrzyniak G., Hartsough N. E., Gandhi T., and Taguchi K., “Characterization of a novel photon counting detector for clinical CT: Count rate, energy resolution, and noise performance,” Proc. SPIE 725824, 725829 (2009). 10.1117/12.813915 [DOI] [Google Scholar]
- Roessl E. and Proksa R., “K-edge imaging in x-ray computed tomography using multi-bin photon counting detectors,” Phys. Med. Biol. 52, 4679–4696 (2007). 10.1088/0031-9155/52/15/020 [DOI] [PubMed] [Google Scholar]
- Toyokawa H., Furukawa Y., Hirono T., Ikeda H., Kajiwara K., Kawase M., Ohata T., Sato G., Sato M., Takahashi T., Tanida H., Uruga T., and Watanabe S., “Si and CdTe pixel detector developments at SPring-8,” Nucl. Instrum. Methods Phys. Res. A 636, S218–S221 (2011). 10.1016/j.nima.2010.04.113 [DOI] [Google Scholar]
- Takahashi T. and Watanabe S., “Recent progress in CdTe and CdZnTe detectors,” IEEE Trans. Nucl. Sci. 48, 950–959 (2001). 10.1109/23.958705 [DOI] [Google Scholar]
- Le H. Q. and Molloi S., “Segmentation and quantification of materials with energy discriminating computed tomography: A phantom study,” Med. Phys. 38, 228–237 (2011). 10.1118/1.3525835 [DOI] [PMC free article] [PubMed] [Google Scholar]
- Prokesch M., Bale D. S., and Szeles C., “Fast high-flux response of CdZnTe x-ray detectors by optical manipulation of deep level defect occupations,” IEEE Trans. Nucl. Sci. 57, 2397–2399 (2010). 10.1109/TNS.2010.2049120 [DOI] [Google Scholar]
- Barber W. C., Nygard E., Wessel J. C., Malakhov N., Wawrzyniak G., Hartsough N. E., Gandhi T., and Iwanczyk J. S., “Fast photon counting CdTe detectors for diagnostic clinical CT: dynamic range, stability, and temporal response,” Proc. SPIE 76221E, 76228 (2010). [Google Scholar]
- Greiffenberg D., Cecilia A., Zwerger A., Fauler A., Vagovic P., Butzer J., Hamann E., dos Santos Rolo T., Baumbach T., and Fiederle M., “Investigations of the high flux behavior of CdTe-Medipix2 assemblies at the synchrotron ANKA,” presented at the Nuclear Science Symposium Conference Record (NSS/MIC), IEEE, 2010.
- Miyajima S., “Thin CdTe detector in diagnostic x-ray spectroscopy,” Med. Phys. 30, 771–777 (2003). 10.1118/1.1566388 [DOI] [PubMed] [Google Scholar]
- Miyajima S., Imagawa K., and Matsumoto M., “CdZnTe detector in diagnostic x-ray spectroscopy,” Med. Phys. 29, 1421–1429 (2002). 10.1118/1.1485975 [DOI] [PubMed] [Google Scholar]
- Fritz S. G., Shikhaliev P. M., and Matthews K. L., “Improved x-ray spectroscopy with room temperature CZT detectors,” Phys. Med. Biol. 56, 5735–5751 (2011). 10.1088/0031-9155/56/17/017 [DOI] [PubMed] [Google Scholar]
- Bottigli U., Golosio B., Masala G. L., Oliva P., Stumbo S., Delogu P., Fantacci M. E., Abbene L., Fauci F., and Raso G., “Comparison of two portable solid state detectors with an improved collimation and alignment device for mammographic x-ray spectroscopy,” Med. Phys. 33, 3469–3477 (2006). 10.1118/1.2229431 [DOI] [PubMed] [Google Scholar]
- Knoll G. F., Radiation Detection and Measurement, 3rd ed. (Wiley, New York, 2000). [Google Scholar]
- Taguchi K., Frey E. C., Wang X. L., Iwanczyk J. S., and Barber W. C., “An analytical model of the effects of pulse pileup on the energy spectrum recorded by energy resolved photon counting x-ray detectors,” Med. Phys. 37, 3957–3969 (2010). 10.1118/1.3429056 [DOI] [PMC free article] [PubMed] [Google Scholar]
- Wielopolski L. and Gardner R. P., “Prediction of pulse-height spectral distortion caused by peak pile-up effect,” Nucl. Instrum. Methods 133, 303–309 (1976). 10.1016/0029-554X(76)90623-6 [DOI] [Google Scholar]
- Gardner R. P. and Wielopolski L., “Generalized method for correcting pulse-height spectra for peak pile-up effect due to double sum pulses: Part I. Predicting spectral distortion for arbitrary pulse shapes,” Nucl. Instrum. Methods 140, 289–296 (1977). 10.1016/0029-554X(77)90297-X [DOI] [Google Scholar]
- Wielopolski L. and Gardner R. P., “Generalized method for correcting pulse-height spectra for peak pile-up effect due to double sum pulses: Part II. The inverse calculation for obtaining true from observed spectra,” Nucl. Instrum. Methods 140, 297–303 (1977). 10.1016/0029-554X(77)90298-1 [DOI] [Google Scholar]
- Johns P. C. and Yaffe M. J., “Correction of pulse-height spectra for peak pileup effects using periodic and random pulse generators,” Nucl. Instrum. Methods Phys. Res. A 255, 559–581 (1987). 10.1016/0168-9002(87)91227-7 [DOI] [Google Scholar]
- Barradas N. P. and Reis M. A., “Accurate calculation of pileup effects in PIXE spectra from first principles,” X-Ray Spectrom. 35, 232–237 (2006). 10.1002/(ISSN)1097-4539 [DOI] [Google Scholar]
- Taguchi K., Zhang M., Frey E. C., Wang X., Iwanczyk J. S., Nygard E., Hartsough N. E., Tsui B. M. W., and Barber W. C., “Modeling the performance of a photon counting x-ray detector for CT: Energy response and pulse pileup effects,” Med. Phys. 38, 1089–1102 (2011). 10.1118/1.3539602 [DOI] [PMC free article] [PubMed] [Google Scholar]
- Tenney F. H., “Idealized pulse pileup effects on energy-spectra,” Nucl. Instrum. Methods Phys. Res. A 219, 165–172 (1984). 10.1016/0167-5087(84)90150-9 [DOI] [Google Scholar]
- Muller J. W., “Some formulas for a dead-time-distorted poisson process,” Nucl. Instrum. Methods 117, 401–404 (1974). 10.1016/0029-554X(74)90283-3 [DOI] [Google Scholar]
- Muller J. W., “Dead-time problems,” Nucl. Instrum. Methods 112, 47–57 (1973). 10.1016/0029-554X(73)90773-8 [DOI] [Google Scholar]
- Schmidt T. G., “CT energy weighting in the presence of scatter and limited energy resolution,” Med. Phys. 37, 1056–1067 (2010). 10.1118/1.3301615 [DOI] [PubMed] [Google Scholar]
- Xu C., Danielsson M., and Bornefalk H., “Evaluation of energy loss and charge sharing in cadmium telluride detectors for photon-counting computed tomography,” IEEE Trans. on Nucl. Sci. 58, 614–625 (2011). 10.1109/TNS.2011.2122267 [DOI] [Google Scholar]
- Szeles C., Soldner S. A., Vydrin S., Graves J., and Bale D. S., “CdZnTe semiconductor detectors for spectroscopic x-ray imaging,” IEEE Trans. Nucl. Sci. 55, 572–582 (2008). 10.1109/TNS.2007.914034 [DOI] [Google Scholar]
- Vavrik D. and Jakubek J., “Material analysis using characteristic transmission spectra,” presented at the Nuclear Science Symposium Conference Record, NSS ‘08, IEEE, 2008.
- Vavrik D. and Jakubek J., “Radiogram enhancement and linearization using the beam hardening correction method,” Nucl. Instrum. Methods Phys. Res. A 607, 212–214 (2009). 10.1016/j.nima.2009.03.156 [DOI] [Google Scholar]
- Jakubek J., “Data processing and image reconstruction methods for pixel detectors,” Nucl. Instrum. Methods Phys. Res. A 576, 223–234 (2007). 10.1016/j.nima.2007.01.157 [DOI] [Google Scholar]
- Ding H., Ducote J., and Molloi S., “Breast composition measurement with a Cadmium-Zinc-Telluride (CZT) based spectral computed tomography system,” Med. Phys. 39, 1289–1297 (2012). [DOI] [PMC free article] [PubMed] [Google Scholar]
- Boone J. M. and Seibert J. A., “Accurate method for computer-generating tungsten anode x-ray spectra from 30 to 140 kV,” Med. Phys. 24, 1661–1670 (1997). 10.1118/1.597953 [DOI] [PubMed] [Google Scholar]
- Sheffield J. B., “ImageJ, a useful tool for biological image processing and analysis,” Microsc. Microanaly. 13, 200–201 (2007). 10.1017/s1431927607076611 [DOI] [Google Scholar]
- Laidevant A. D., Malkov S., Flowers C. I., Kerlikowske K., and Shepherd J. A., “Compositional breast imaging using a dual-energy mammography protocol,” Med. Phys. 37, 164–174 (2010). 10.1118/1.3259715 [DOI] [PMC free article] [PubMed] [Google Scholar]
- Cardinal H. N. and Fenster A., “An accurate method for direct dual-energy calibration and decomposition,” Med. Phys. 17, 327–341 (1990). 10.1118/1.596512 [DOI] [PubMed] [Google Scholar]


