

Abstract
For many research questions in modern molecular and systems biology, information about absolute protein quantities is imperative. This information includes, for example, kinetic modeling of processes, protein turnover determinations, stoichiometric investigations of protein complexes, or quantitative comparisons of different proteins within one sample or across samples. To date, the vast majority of proteomic studies are limited to providing relative quantitative comparisons of protein levels between limited numbers of samples. Here we describe and demonstrate the utility of a targeting MS technique for the estimation of absolute protein abundance in unlabeled and nonfractionated cell lysates. The method is based on selected reaction monitoring (SRM) mass spectrometry and the “best flyer” hypothesis, which assumes that the specific MS signal intensity of the most intense tryptic peptides per protein is approximately constant throughout a whole proteome. SRM-targeted best flyer peptides were selected for each protein from the peptide precursor ion signal intensities from directed MS data. The most intense transitions per peptide were selected from full MS/MS scans of crude synthetic analogs. We used Monte Carlo cross-validation to systematically investigate the accuracy of the technique as a function of the number of measured best flyer peptides and the number of SRM transitions per peptide. We found that a linear model based on the two most intense transitions of the three best flying peptides per proteins (TopPep3/TopTra2) generated optimal results with a cross-correlated mean fold error of 1.8 and a squared Pearson coefficient R2 of 0.88. Applying the optimized model to lysates of the microbe Leptospira interrogans, we detected significant protein abundance changes of 39 target proteins upon antibiotic treatment, which correlate well with literature values. The described method is generally applicable and exploits the inherent performance advantages of SRM, such as high sensitivity, selectivity, reproducibility, and dynamic range, and estimates absolute protein concentrations of selected proteins at minimized costs.
MS-based proteomics has evolved from a qualitative method focused on identifying proteins in a sample toward a robust technology for assessing quantitative protein abundance changes. To date, the vast majority of quantitative proteomic data constitute relative comparisons of protein abundances between a limited number of samples. Such relative measurements of protein abundance changes are very informative and can be used to investigate a wide range of biological questions that benefit from extensive comparisons of protein profiles between, for example, cellular states (1), multicellular organisms (2), disease states (3), or phosphorylation dynamics (4). However, many fields of research in modern molecular and systems biology also require the determination of absolute protein concentrations within biological samples. For example, absolute measurements of protein levels are important for kinetic modeling of biological processes (5, 6), for the calculation of protein half-lives (7), for the determination of stoichiometries in protein complexes (8–10), or for the comparison of concentrations of different proteins within or across samples or species. Furthermore, absolute quantification of specific sets of common benchmark proteins help researchers with data standardization and validation across different proteomic platforms and laboratories, an important issue that remains a major challenge for current proteomic studies (11, 12). Especially in the fields of systems biology and biomarker validation, where large sets of proteins have to be quantified precisely and reproducibly over many different samples, the need for absolute measurement of protein quantities is apparent (13).
However, the absolute quantification of significant segments of a proteome remains technically challenging. It has been addressed by a range of experimental strategies, each one exhibiting specific advantages and limitations. Broadly, these experimental strategies can be divided into methods based on affinity reagents (14) and methods based on quantitative MS (15–17). Generally, the field of MS can be further categorized into two major groups: those based on stable isotope labeling and those that operate without isotope labels. Absolute quantification based on stable isotope labeling can be achieved by adding known amounts of stable isotope-labeled standard (SIS)1 peptides (18, 19), concatenated peptides (20), or complete proteins (21) to the sample of interest. Commonly, stable isotope dilution techniques feature good accuracy and reproducibility (11), but they also suffer from limitations, like incomplete proteolysis during sample preparation, occurrence of peptide modifications, possible signal interferences caused by co-eluting components of similar masses, as well as high labor and reagent costs. Especially the last limitation presents a real barrier for absolute quantification of larger sets of proteins, and hence label-free quantification methods are becoming increasingly popular.
To date, absolute label-free quantification has been performed mainly from data generated using data-dependent acquisition, whereby either the identification frequency of peptides (spectral counting) (22, 23) or the integrated peak intensities of peptide precursor ions (7, 24) are used to estimate protein abundance. To convert the arbitrary unit of spectral counts or peak intensities into a measure of concentration, like copies/cell or mol/liter, typically either the total number of protein molecules per cell is estimated and split among all proteins identified in the shotgun MS experiment (23) or proteome-wide absolute abundances are estimated based on linear regression (7, 24, 25). For the latter case, accurate absolute protein abundances need to be determined for a small number of calibration point proteins, ideally spanning the whole protein abundance range. Typically, this is conducted by spike-in experiments using either purified proteins (7) or SIS peptide mixtures (24).
Absolute, label-free strategies based on spectral counting are easy to implement, are usable at high throughput, and can be applied to virtually any data set generated by data-dependent acquisition LC-MS, even retrospectively. However, spectral counting exhibits intrinsic limitations in accuracy, particularly for lower abundant proteins with low ion counts, and its application remains controversially discussed, because no direct physical property of the quantified peptides is measured (15). Absolute, label-free quantification using extracted precursor ion intensities has been performed by summing the signal intensities of all peptides per protein divided by the number of theoretically observable peptides (7) or by considering the “best” peptides, i.e. the peptides with the highest signal intensities for each protein (“best flyer” methodology) (24, 26–28). The latter approach intends to reduce ion intensity variations among different peptides of a protein by focusing exclusively on the most intense (best flyer) peptides per protein. Hence, this approach implicitly uses the assumption that for each protein of a proteome, the proteotypic (tryptic and unique) peptides with the highest ion currents have approximately equal specific signal intensities. In comparison with spectral counting, the use of precursor ion intensities is more robust and less limited by undersampling and saturation effects (26). It is, however, preconditioned on the a priori identification and subsequent detection of three best flyer peptides per protein (26) and prone to interfering precursor ion signals.
Selected reaction monitoring (SRM, also known as multiple reaction monitoring) is a targeted mass spectrometric technique that has favorable performance characteristics compared with other MS techniques (16, 29). To date, SRM has not been explored in the context of absolute label-free quantification. Specifically, SRM achieves a dynamic range of ∼5 orders of magnitude (30), is capable of detecting low amol amounts of analytes on column, even in complex backgrounds, and achieves a high selectivity, because the signals of multiple, concurrently measured transitions/peptide can be integrated in statistical models (31).
In this study, we describe a new absolute label-free quantification method. It is based on SRM and the best flyer methodology, i.e. it estimates absolute protein abundances in unlabeled and nonfractionated protein samples by integrating the signals of selected most intense transitions of best flyer peptides for each target protein. As a model system, we choose the human pathogen Leptospira interrogans, an organism of medium complexity (3658 predicted open reading frames (32)), which has already extensively been investigated by absolute label-free measurements based on precursor ion intensities and spectral counting (24, 27). Specifically, our technique comprises a two-step procedure. The first step includes calibration and accuracy estimation, based on a small number of anchor point proteins (in this study n = 16) using Monte Carlo cross-validation and results in the generation of a linear calibration curve. Subsequently, this curve can be applied in the second step to estimate absolute abundances of a user-definable number target proteins (10–100s of proteins, in this study n = 23), for which no cost-intensive standard peptides need to be available. The method described is generally applicable, exploits the inherent performance advantages of SRM, and minimizes the costs of generating isotopically labeled standard peptides.
EXPERIMENTAL PROCEDURES
Synthetic Peptide Standards
Two different types of synthetic peptides were used in this study. The first type are purified [13C,15N]lysine-labeled or [13C,15N]arginine-labeled standard peptides (SIS peptides) for absolute quantification of proteins. The second type are crude, unlabeled synthetic peptides for SRM assay generation and optimization.
SIS peptides were synthesized, quality-controlled, quantified by amino acid analysis, and obtained either from Sigma-Aldrich or from Thermo Fischer Scientific. Crude synthetic peptides were purchased from JPT Peptide Technologies in a multi-well format. These peptides represent unpurified products of high throughput Spot-synthesis and lack a precise peptide concentration determination (33). All of the peptides were resolubilized in 20% acetonitrile with 1% formic acid and pooled with equal volumes into four peptide mixes (∼45 peptides each). Subsequently these mixes were analyzed by shotgun and targeted mass spectrometry to generate full fragment ion spectra, specific retention time coordinates, and relative transition intensity information.
Cell Culture and Sample Preparation
The conditions for culturing cells of L. interrogans serovar Copenhageni strain Fiocruz L1-130 and methods for protein extraction and digestion were described previously (24). In the present study, three different biological conditions were investigated: 1) a control sample grown at 30 °C in exponential growth phase; 2) a sample treated in exponential growth phase for 12 h with the antibiotic ciprofloxacin (5 μg/ml); and 3) a sample treated in exponential growth phase for 24 h with ciprofloxacin (5 μg/ml). To assure comparability of protein abundances across the three conditions, the total protein content of each sample was determined by a bicinchoninic acid protein assay (34), and an additional normalization step was performed based on the determined absolute concentrations of the anchor point proteins after data acquisition (see “Absolute Quantification Using Stable Isotope Dilution”).
Targeted Mass Spectrometry Setup
All of the SRM measurements were performed on a TSQ Vantage QQQ mass spectrometer (Thermo Fischer Scientific) equipped with a nanoelectrospray ion source. Chromatographic separation of peptides was carried out on a nano-LC system (Eksigent). In each injection, 1 μg of total cell extract, including 10–50 fmol of spiked in SIS peptides, was loaded onto a 75-μm × 10.5-cm fused silica microcapillary reverse phase column, in-house packed with Magic C18 AQ material (200 Å pore, 5-μm diameter; Michrom BioResources). For peptide separation, a linear 30-min gradient from 2 to 35% solvent B (solvent A: 98% water, 2% acetonitrile, 0.1% formic acid; solvent B: 98% acetonitrile, 2% water, 0.1% formic acid) at a 300 nl/min flow rate was applied. The mass spectrometer was operated in the positive ion mode using ESI with a capillary temperature of 280 °C, a spray voltage of +1200 V, and a collision gas pressure of 1.5 mTorr. SRM transitions were monitored with a mass window of 0.7 half-maximum peak width (unit resolution) in Q1 and Q3. All of the measurements were performed in scheduled mode, applying a retention time window of 3 min, a cycle time of 1.5 s, and a dwell time of ∼25 ms (depending on the number of transitions measured per run, which was in the range of 400–600). Collision energies (CE) were calculated using the formula CE = 0.03 · m/z + 2.905 for doubly charged precursor ions and CE = 0.038 · m/z + 2.281 for triply charged precursor ions (m/z = mass-to-charge ratio of the precursor ion) (35). A blank injection was made between each biological sample to check for sample carry over. All of the samples were assayed in technical triplicates.
SRM assays were developed by selecting for each crude synthetic peptide three transitions for the doubly and triply charged precursor ion, corresponding to the first three fragment ions of the y-ion series with m/z greater than the precursor m/z value. Upon detection of an SRM trace exceeding a threshold of 1000 ion counts, acquisition of full MS/MS scans was triggered. MS/MS spectra were acquired in dependent scan type, scan time of 1 s, Q1 peak width (full width at half-maximum) of 0.7 Da, Q3 peak width (full width at half-maximum) of 0.7 Da, m/z range of 300–1500 Da, and a collision gas pressure 1.5 mTorr. The dynamic exclusion function was not in use.
Shotgun Mass Spectrometry Setup
The LC-MS/MS analysis of the crude synthetic peptide mixes was carried out on a hybrid LTQ-FT-ICR mass spectrometer interfaced with a nanoelectrospay ion source (both from Thermo Electron) and coupled online to a Tempo one-dimensional plus nano-LC system (Applied Biosystems/MDS Sciex). The peptides were separated by reverse phase HPLC using an in-house packed column (75 μm × 11 cm, Magic C18 AQ, 3-μm diameter, 200 Å pore; Michrom BioResources). The applied linear gradient started at 98% solvent A (98% water, 2% acetonitrile, 0.15% formic acid) and reached 30% solvent B (98% acetonitrile, 2% water, 0.15% formic acid) after 60 min at a flow rate of 300 nl/min. The LTQ-FT-ICR instrument was operated in the data-dependent acquisition mode using a full scan in the ICR cell (m/z range of 400–1600, 100,000 full-width at half-maximum nominal resolution; ICR target value of 1,000,000) followed by MS/MS scans of the five most intense ions in the linear ion trap with an overall cycle time of ∼1 s. MS/MS spectra were acquired applying a normalized collision energy of 35%, an activation value Q of 0.25, an activation time of 30 ms, and one microscan for each spectrum. Only precursor ions matching to a charge state of 2 or higher were selected for fragmentation and excluded from reanalysis for 0.5 min using the dynamic exclusion option. Monoisotopic precursor selection was enabled.
Data Analysis of Full MS/MS Scan Experiments
Xcalibur raw files were converted into mzXML files using the ReAdW tool (version 4.3.1) (36). These files were searched against a L. interrogans database, predicted from the complete genome NCBI genome number NC_005823 and NC_005824, using the software SEQUEST (SorcererTM-SEQUEST®, version 4.0.4). In total, the applied database consisted of 7480 protein entries, comprising 3658 L. interrogans proteins, correspondingly reversed sequences for a decoy strategy, as well as known contaminants such as porcine trypsin, human keratins, and high abundant bovine serum proteins. Search parameters were set as follows: enzyme name, Trypsin[KR/−] (cleavage after lysine and arginine, no proline blocking); maximum missed cleavage sites, 2; peptide mass tolerance, 15 ppm (precursor); static modification, carbamidomethyl-Cys; dynamic modifications, oxidation on methionine. Subsequently the Trans-Proteomic Pipeline (version 4.0.2) was applied onto the data set (37). The search results were filtered according to a false discovery rate (FDR) of 2% for the LTQ-FT-ICR data set and 1% for the TSQ Vantage data. The FDR values were determined by the decoy strategy and equated to a PeptideProphet probability value of >0.9 in both data sets. Subsequently, a consensus spectrum for each identified peptide was generated running the software SpectraST (version 3.1) (38). The generated MS/MS scan libraries were uploaded into the SRM software Skyline (39), and all of the assigned fragment ions were extracted.
Absolute Quantification Using Stable Isotope Dilution
A calibration data set was generated using 21 SIS peptides representing 16 anchor point proteins (see Table I), spanning the whole protein abundance range of L. interrogans (70–25,000 copies/cell). SRM assay parameters (most intense precursor charge, five most intense transitions, and retention time) were obtained by SRM-triggered MS/MS experiments on the TSQ Vantage. Collision energies were calculated using the equation shown under “Targeted Mass Spectrometry Setup.” To ensure linearity of the measurement, for each SIS peptide the linear signal-to-abundance range was determined from dilution series experiments spanning concentrations of 100–0.1 fmol/μl, spiked into a constant L. interrogans background (supplemental Fig. S1). For absolute quantification, a reference peptide master mix was prepared, wherein peptide concentrations were roughly adjusted to the endogenous protein abundance level (either 200 or 40 fmol/μl). To avoid quantitative distortions caused by reference peptide adsorption, the master mix was prepared in glass vials and handled exclusively with low binding pipette tips (Maxymum recovery series; Axygen). The master mix was spiked into the trypsinized and purified samples of interest (1 μg/μl cell extract) with final peptide concentrations of 50 or 10 fmol/μl, respectively. Notably, spiking was performed after protein digestion and peptide purification. Hence, the obtained absolute quantitative results can neither account for incomplete or varying protein digestion efficiencies (40) nor for possible peptide losses from upstream steps of the sample preparation workflow. Data analysis was carried out using the software Skyline (39). Herein, integrated peak areas for transitions associated to the reference (heavy) and endogenous (light) peptide were summed, respectively. From the obtained light-to-heavy peptide ratios, the absolute endogenous peptide concentration was determined in fmol/μl. The conversion of these results into the unit “copies/cell” was performed by taking into account the total number of cells used for sample preparation, assuming a complete protein extraction efficiency during cell lysis.
Table I. Absolute protein abundance levels of 16 anchor point proteins using stable-isotope dilution LC-MS.
| Gene namea | Protein identificationa | Peptide sequence | Control copies/cell |
Ciprofloxacin copies/cell |
||||
|---|---|---|---|---|---|---|---|---|
| 12 h |
24 h |
|||||||
| Peptidesb | Proteinsc | Peptidesb | Proteinsc | Peptidesb | Proteinsc | |||
| clpB | YP_001955.1 | AVDLIDEASSK | 615 ± 2 | 615 ± 2 | 376 ± 6 | 376 ± 6 | 595 ± 2 | 595 ± 2 |
| clpP2 | YP_001896.1 | IAEVFEELTGSK | 2061 ± 24 | 2857 ± 1126 | 1637 ± 15 | 2299 ± 937 | 1802 ± 22 | 2508 ± 999 |
| clpP2 | YP_001896.1 | IFLWGPVTDESSK | 3653 ± 29 | 2962 ± 20 | 3214 ± 65 | |||
| fas1 | YP_003223.1 | AIAEEVPK | 1107 ± 6 | 1431 ± 458 | 1099 ± 40 | 1409 ± 441 | 1112 ± 14 | 1436 ± 459 |
| fas1 | YP_003223.1 | EFFDTSFK | 1755 ± 14 | 1719 ± 7 | 1761 ± 2 | |||
| flgE | YP_001158.1 | VATAVFNNPAGLDK | 87 ± 3 | 87 ± 3 | 113 ± 5 | 113 ± 5 | 73 ± 2 | 73 ± 2 |
| fliF | YP_001355.1 | IISDFEEDLEK | 80 ± 4 | 103 ± 33 | 80 ± 0 | 85 ± 6 | 92 ± 6 | 99 ± 12 |
| fliF | YP_001355.1 | GFTPDGPAGTEPNIAPGYK | 127 ± 0.8 | 89 ± 1 | 106 ± 2 | |||
| groL | YP_001299.1 | VEDALSATR | 10265 ± 15 | 11364 ± 1555 | 10985 ± 299 | 12302 ± 1886 | 12621 ± 202 | 14179 ± 2213 |
| groL | YP_001299.1 | AVTAAVESIQK | 12463 ± 42 | 13619 ± 187 | 15737 ± 34 | |||
| groS | YP_001300.1 | VGDTVLYGK | 8707 ± 16 | 16451 ± 10951 | 6640 ± 100 | 12583 ± 8406 | 6581 ± 28 | 12179 ± 7916 |
| groS | YP_001300.1 | ESDILAVVK | 24195 ± 120 | 18526 ± 390 | 17776 ± 214 | |||
| hslU | YP_001559.1 | LLEEVSFEGPDLPESQR | 395 ± 8 | 395 ± 8 | 434 ± 4 | 434 ± 4 | 437 ± 6 | 437 ± 6 |
| hsp15 | YP_002146.1 | DVQVQLEK | 807 ± 19 | 807 ± 19 | 3085 ± 76 | 3085 ± 76 | 2432 ± 59 | 2432 ± 59 |
| LIC_10600 | YP_000584.1 | TEVITHANLVR | 2151 ± 9 | 2151 ± 9 | 1665 ± 77 | 1665 ± 77 | 1614 ± 7 | 1614 ± 7 |
| LIC_11890 | YP_001839.1 | ANLGAYFNR | 21995 ± 119 | 21995 ± 119 | 17607 ± 76 | 17607 ± 76 | 20233 ± 148 | 20233 ± 148 |
| LIC_12210 | YP_002145.1 | ILELPTEVDSEK | 723 ± 3 | 723 ± 3 | 2086 ± 21 | 2086 ± 21 | 1889 ± 6 | 1889 ± 6 |
| mreB | YP_001227.1 | TGGDEFDEAIIK | 1989 ± 22 | 1989 ± 22 | 2164 ± 20 | 2164 ± 20 | 2520 ± 10 | 2520 ± 10 |
| recA | YP_001697.1 | IVEIYGPESSGK | 697 ± 5 | 697 ± 5 | 3810 ± 45 | 3810 ± 45 | 4154 ± 11 | 4154 ± 11 |
| rpoB | YP_000733.1 | TFDLGEVGR | 2378 ± 16 | 2378 ± 16 | 2376 ± 34 | 2376 ± 34 | 2594 ± 43 | 2594 ± 43 |
| rpoC | YP_000734.1 | FATSDLNDLYR | 5027 ± 4 | 5027 ± 4 | 5355 ± 232 | 5355 ± 232 | 6010 ± 50 | 6010 ± 50 |
a Gene names and protein identifiers were extracted from NCBI genome database numbers NC_005823 and NC_005824.
b Endogenous peptide concentrations were determined by spiking of SIS peptides; the given standard deviations were calculated based on technical triplicates.
c For proteins quantified with two peptides, the abundance level and standard deviation were calculated from the average of both peptide values.
For the accurate comparison of protein changes across samples, we performed a normalization step after data acquisition in addition to normalization based on protein concentrations determined by the bicinchoninic acid protein assay. Assuming that the majority of anchor point proteins did not change upon antibiotic treatment, we calculated the outlier-insensitive median of peptide ratio changes relative to the control. The determined correction factors equaled 1.2 for the 12-h ciprofloxacin-treated sample and 0.97 for the 24-h treated sample. However, the rather small deviations of the correction factors from the ideal value 1 demonstrate the validity of the initial normalization step based on the bicinchoninic acid assay.
Label-free SRM Measurement
For label-free SRM measurements, the five best flying proteotypic peptides per protein (unique, tryptic, no missed cleavage sites) were selected according to precursor ion signal intensities determined by directed mass spectrometry (27). For these peptides, SRM assays were established by means of crude synthetic peptide analogs. Detectable transitions were selected from SRM measurements of the complete theoretical y-ion series (singly charged and in the range of 300–1500 Da), as well as from generated full MS/MS spectral libraries (see “Data Analysis of Full MS/MS Scan Experiments”). Next, the endogenous detectability of transitions and peptides was tested in tryptically digested cell lysates and a comprehensive transitions list comprising 39 proteins, 151 peptides, and 1166 transitions was compiled (supplemental Table S2). Based on this list, 293 decoy transitions (not shown) were automatically generated for a subset of 45 peptides, randomly chosen of the 151 targets. Decoy transitions were calculated by subtracting a random integer between 3 and 10 from the targeted Q1 value, whereas for Q3 values a random integer between −5 and 5 was added (31). Subsequently, a total list with 1459 transitions was compiled and measured in three different biological samples of L. interrogans. To maximize measurement sensitivity, scheduled methods were created (3-min retention time window), and transitions were split over three sample injections, each comprising ∼500 transitions. Every run was performed in technical triplicates; hence for the label-free data set generation, 27 injections were undertaken in total. SRM data sets associated with this manuscript have been deposited to the PeptidesAtlas SRM Experiment Library (PASSEL) and are accessible via the website http://www.peptideatlas.org/passel/ (51).
Data Analysis Using mProphet
The software tool mProphet integrates multiple types of information from SRM data in a probabilistic model for automated scoring of truly detected peptides (31). For a specific monitored peptide, represented by several transitions, this information includes peak intensity, peak shape, transition concurrence, correlation of the measured transition intensities to those derived from full MS/MS scan experiments, and peptide retention time. Each of these parameters results in a specific subscore (total intensity score, shape score, concurrence score, intensity correlation with assay score, and retention time deviation score), which mProphet integrates to an overall discriminant score, such that the separation between true peptide targets and false decoys gets maximized. Decoy transitions were generated and measured as described in the section “Label-free SRM Measurement.” For the intensity correlation with assay score and the retention time deviation score, the relative transition intensities and retention times were applied as obtained during the SRM assay generation and validation process, preferentially by SRM-triggered MS/MS experiments on the TSQ Vantage or by shotgun experiments on the LTQ-FT-ICR (see “Data Analysis of Full MS/MS Scan Experiments”). To estimate the FDR, a null distribution based on the decoy transition data was parameterized (for more detailed information see Ref. 31).
Model Selection and Accuracy Estimation Using Monte Carlo Cross-validation
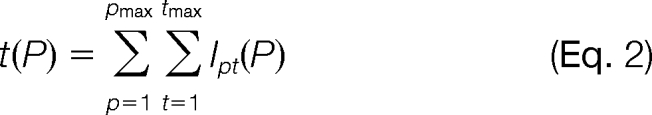
The quantification method described in this study estimates absolute protein abundances by relating SRM intensities of best flying peptides and most intense transitions to absolute protein concentrations using a linear model. Herein, for a protein P, the linear model takes an intensity sum t(P) of a specified set of peptides and transitions as predictors for the protein concentration c(P),
wherein r represents the response factor, and s is the offset parameter. The intensity sum t(P) accounts for the intensities Ipt(P) of the tmax transitions of the pmax peptides of protein P.
 |
To fully characterize the model, two tasks have to be performed. The first is the specification of a set of considered most intense transitions and peptides (model selection). The second is the estimation of the response factor r and the offset s (parameter estimation). These tasks were accomplished on the basis of a data set of 16 anchor point proteins, for which absolute quantities (target values) had been determined using SIS peptides and for which transition intensities had been monitored by label-free measurements (predictor values). Peptide intensities were defined as the sum of considered transition intensities and for each setting of tmax peptide signals were ranked accordingly. Parameter estimation for a given assignment to pmax and tmax was performed by least square regression. Model selection was performed by Monte Carlo cross-validation (41). In this analysis, a random subset (one-third) of the available data points was held out for use as a validation set. Linear regression was performed with the remaining data points (training set) and used to predict results for the validation set. The random reassembly of validation and training data sets was done iteratively (n = 1000). Finally, the averaged determined difference between predicted and measured protein abundances (mean fold error) was used as an overall measure for the prediction accuracy of our model. A R-script for model selection with Monte Carlo cross-validation is available at http://ai.stanford.edu/∼manfredc/lfqsrm.html.
RESULTS
We describe and demonstrate a new method to estimate absolute protein quantities in unlabeled total cell lysates on the basis of SRM data. It comprises the two-step procedure illustrated in Fig. 1. In the first step, we generate a calibration curve and assess the accuracy of the technique using a small number of anchor point proteins, which are accurately quantified via stable isotope dilution mass spectrometry. In the second step, these results are used to estimate absolute protein concentrations for target proteins of interest. In the following paragraphs, we describe the procedures and results of each step in detail.
Fig. 1.

Schematic workflow of absolute label-free protein abundance estimation using SRM. The method comprises a two-step procedure. A, in the first step, a calibration curve is generated based on a defined number of anchor point proteins. For this, protein intensity values derived from label-free SRM measurements of best flyer peptides are correlated to independently determined absolute protein concentrations using the SID methodology. In this step, the accuracy of the method can be estimated, and the best model of peptide and transition combinations can be identified. B, in the second step, absolute protein abundances of a user-defined number of target proteins can be estimated by monitoring also for those proteins best flyer peptides and by applying the model and calibration curve derived from step 1. To ensure optimal comparability in MS signal responses between anchor point and target proteins, ideally both data sets should be measured simultaneously.
Step 1: Calibration and Accuracy Estimation
The first step is based on a small set of anchor point proteins (in this study 16 proteins, see supplemental Table S1 for detailed protein information). Anchor point proteins serve as calibration points to generate a linear regression model that can be used to convert label-free SRM signal intensities into absolute protein concentrations. Hence, anchor point proteins need to fulfill two important criteria. First, their abundance must be distributed over the whole cellular abundance range of interest, and second, their absolute protein concentration must be known. In this study, concentration-wise evenly distributed anchor point proteins were selected based on a published quantitative shotgun data set (24), and their accurate absolute concentrations were determined using the stable isotope dilution technology (SID).
I) Accurate Absolute Quantification of Anchor Point Proteins
We first determined the absolute concentration of 16 anchor point proteins by comparing the SRM transition signal intensities of selected signature peptides with the corresponding signals of synthetic SIS peptides. In total, 21 SIS peptides were spiked into the sample of interest in precisely known amounts that were roughly adjusted to the endogenous protein level. Because this quantification is based on a single concentration calibration point and to avoid artifacts caused by detector saturation, we determined for each reference peptide the linear signal-to-abundance range by performing dilution series experiments within the L. interrogans sample matrix (supplemental Fig. S1). We determined that the 16 anchor point proteins spanned a concentration range from 70 to 25000 copies/cell (Table I). The technical replicate measurements were highly reproducible, showing on average a technical coefficient of variation (CV) of 1% and a squared Pearson coefficient (R2) of 0.999 (supplemental Fig. S2A). For the five proteins represented by two reference peptides (ClpP2, Fas1, FliF, GroL, and GroS), individual peptide concentrations were averaged to obtain the final protein concentration, and these results showed an average concentration variability of 30%. These significant concentration differences between peptides representing the same protein can have several causes. For example, incomplete and varying protein digestion efficiencies can lead to different concentrations of peptides originated from the same protein (40). Further, occurrence of modifications, because of either biology or sample preparation, as well as inaccuracies introduced by the quantification of the SIS peptides caused by adsorption, degradation, or other artifacts can also distort absolute quantitative results. Consequently, inaccurately determined absolute quantities of anchor point proteins might negatively affect the calibration curve fit. However, the effect of unusually behaving peptides is expected to average out and thereby decrease with selecting a sufficiently high number of anchor point proteins and by using several peptide data points per protein.
II) Best Flyer Peptide Selection
The label-free approach for protein abundance estimation described in this study is based on the best flyer hypothesis. It assumes that the specific precursor ion signal intensity of the best flying tryptic peptides per protein is approximately constant throughout a whole proteome. We selected best flyer peptides from a comprehensive data set acquired on a high performance hybrid LTQ-FT-ICR instrument by directed MS (27). From this data set, the proteotypic peptides detected per protein (unique, two tryptic ends, and no missed cleavage sites) were ranked according to their precursor ion intensities. The five most intense peptides per protein were selected as best flyer peptides for further analysis. For proteins with fewer MS-detectable peptides, the available smaller number was considered. For the 16 anchor point proteins, in total 77 best flyer peptides were selected.
III) Most Intense Transition Selection
In contrast to discovery-driven or directed MS experiments, where for each peptide a single precursor intensity value is obtained, in SRM the total fragment ion intensity of a peptide is distributed over a varying number of transitions. We therefore systematically investigated the dependence of quantitative accuracy on the number of measured transition signals per best flyer peptide formed during collision-induced dissociation (CID).
To unambiguously identify these transitions, we generated crude synthetic peptide analogs of the 77 selected best flyer peptides. We extensively analyzed these synthetic peptides by shotgun MS on an LTQ-FT-ICR instrument, by SRM-triggered MS/MS on a QQQ instrument, as well as by SRM measurements of the complete theoretical y-ion series of all doubly and triply charged precursor ions. Subsequently, we used the identified transitions for the detection of the corresponding endogenous peptides. Transitions that proved detectable and quantifiable from endogenous proteins were kept, whereas undetectable transitions and peptides were excluded from further analysis. Finally, a comprehensive optimized transition list comprising 500 transitions corresponding to 66 peptides and 16 proteins was obtained (supplemental Table S2). Proteins were represented with two to five best flyer peptides (Fig. 2A) and with 4 to 14 transitions per peptide (Fig. 2B). Notably, from the initial 77 best flyer peptides selected based on directed MS data, 85% (66 peptides) were finally detectable by SRM. The majority of detectable transitions on the QQQ instrument (TSQ Vantage) were singly charged y-ions (414 transitions, 83%). Fifty-nine b-ions (12%) and 27 multiply charged y-ions (5%) constituted the remaining signals (supplemental Table S2). From the data, we also extracted additional SRM assay parameters, such as relative transition intensities and retention time.
Fig. 2.

Best flyer peptide selection, transition selection, and FDR estimation. A, distribution of endogenously detectable best flyer peptides for the 16 proteins used as anchor points. B, 66 selected best flyer peptides were endogenously detectable by SRM with 4–14 transitions. C, the complete label-free SRM data set was scored using the algorithm mProphet, which takes into account information from measured target (gray) and decoy (black) peptide peak groups (31). Discrimination between target and decoy peptides led to an estimated FDR of ∼1%.
IV) Label-free SRM Measurements
To quantify the 16 anchor point proteins in a label-free manner, we used the SRM-assays developed above and performed technical triplicate measurements on a total cell lysate from the microbe L. interrogans (control sample). Peptide identification and calculation of FDR were performed applying the scoring algorithm mProphet (31) (see “Experimental Procedures”). In Fig. 2C, the distribution of scored target (gray) and decoy (black) peptide peak groups is illustrated, indicating a good discrimination between true and false positive identifications. The estimated FDR of the complete data set (also including additional target proteins and samples; see later sections) was ∼1%. Subsequently, for each measured transition, the SRM signal intensity (peak area) was extracted from the mProphet output file. The label-free technical triplicate measurements were highly reproducible, showing on transition level an average CV of 6% and a squared Pearson coefficient R2 of 0.99 (supplemental Fig. S2B). A comparison of the technical reproducibility between label-free and SID measurements showed an even higher degree of reproducibility for the SID measurements (average CV of heavy/light peptide ratio = 1%), mainly because the availability of heavy and light transition signals in the same peak group can be used to account for system and experimental variability, such as injection variability, ion suppression effects, or varying chromatographic performance. However, our data show that also the label-free workflow achieves excellent technical reproducibility. Notably, we also tested the use of peak height instead of peak area as the unit for label-free quantification but observed a slightly decreased technical reproducibility performance (data not shown). Hence, in this study we solely focused on the peak area values.
V) Model Selection and Accuracy Estimation
Next, to estimate the accuracy of the label-free quantification method, we investigated the correlation between the quantities determined from the label-free SRM data set and the measured absolute protein concentrations. As in the label-free data set, each anchor point protein is represented by a varying number of best flyer peptide and transition intensities. First these values were assembled to a single intensity value per protein. To find the most accurate model for this assembly, we systematically tested the effect of varying transition and peptide counts on the protein quantification accuracy. Specifically, we ranked all of the measured transitions per peptide by decreasing signal intensity and increased the number of summed transitions from one to six in subsequent analyses. In cases where doubly and triply charged precursor ions were detected, they were defined as one transition group/peptide. Additionally, we also varied the number of summed peptides per protein from one to four, again ranked by decreasing peptide intensity. Herein, the peptide intensity was defined as the sum of all considered transition intensities. In cases where fewer than four peptides per protein and fewer than six transitions per peptide were detected, the lower number of available data points were considered. As shown in Fig. 2 (A and B), for more than three-quarters of the data set, the full peptide and transition count was available.
The thus determined protein intensities were log-transformed, and each was plotted against the determined log-transformed absolute protein quantities. Subsequently linear regression was performed. To assess the ability of each linear fit to estimate absolute protein abundances on new data, we determined the expected fold errors by Monte Carlo cross-validation (see “Experimental Procedures”). This analysis revealed that the best prediction accuracy could be obtained by considering only the best flying peptide per protein, i.e. mean fold errors increased with the number of summed peptides per protein (Fig. 3A). Furthermore, summing of the two most intense transitions per peptide led to improved abundance predictions, regardless of the number of considered peptides (Fig. 3A). The statistically most accurate model considered the summed signal intensities of the six most intense transitions of the best flying peptide per protein (TopPep1/TopTra6; Fig. 3B), showing an estimated mean fold error of 1.76. However, performance differences across all peptide and transition combinations tested were small (mean fold error ranging from 1.76 to 2.03). Specifically, the model TopPep3/TopTra2 predicted absolute protein abundances with a mean fold error of 1.83 and a maximal detected error of 4.5-fold (Fig. 3C). The linear calibration curves from TopPep1/TopTra6 and TopPep3/TopTra2 were highly similar (squared Pearson coefficient R2 = 0.90 and 0.88, respectively; compare Fig. 3 (D and E)), and estimated absolute protein abundances differed in average by only 4%. This indicates that several combinations of best flyer peptides per protein and transition signals per peptide showed a reasonable and robust ability to predict absolute protein quantities from SRM data sets. Finally, we selected TopPep3/TopTra2 as the model of choice for further analysis, because the estimation of protein abundance based on three independent peptide measures per protein is beneficial, because this represents a less sensitive model toward peptide outlier values, which is an especially important issue when working within complex biological samples.
Fig. 3.

Model selection and accuracy estimation using Monte Carlo cross-validation. A, heat map visualization of the predictive measurement accuracy, represented by the cross-validated mean fold error, applying different models based on varying peptide and transition counts. Each square represents one particular linear model, which considers a specific number of summed best flyer peptides and most intense transitions, as annotated by the axes. Ranking of peptides and transitions was performed based on decreasing signal intensity. B and C, prediction error histograms for the linear models considering either the single best flying peptide per protein (TopPep1/TopTra6) or the summed intensity of the three best flying peptides (TopPep3/TopTra2). D and E, linear regression curves for the two models TopPep1/TopTra6 and TopPep3/TopTra2, respectively.
Reproducibility of Model Selection
To test the biological reproducibility of the obtained mean fold error distribution based on peptide/transition combinations, we performed a Monte Carlo cross-validation analysis on two additional L. interrogans samples. The samples were total cell lysates from cells treated for 12 or 24 h with the antibiotic ciprofloxacin. For each sample, we determined absolute protein abundances (Table I) and generated a label-free best flyer peptide data set using SRM (supplemental Table S2). The above described mean fold error trends were highly similar over all three samples (compare Fig. 3A with Fig. 4, A and B), supporting the universality of the results for the given sample type.
Fig. 4.

Biological reproducibility of model selection and calibration curve generation. A and B, to test the reproducibility of the determined mean fold error distributions based on varying peptide and transition combinations, we performed the Monte Carlo cross-validation analysis on three biological L. interrogans samples: a control sample (Fig. 3A), 12 h of treatment with ciprofloxacin (A) and 24 h of treatment with ciprofloxacin (B). C, overlay of linear calibration curves generated for the three different biological samples over a measurement period of 70 h. Each data point represents an averaged value of three technical replicates.
Reproducibility of Calibration Curve Generation
Further, we investigated the reproducibility of the linear calibration curve for multiple measurements of a complex study. Specifically, the sample set consisted of 36 sample injections, which were measured over ∼70 h (including blank runs between samples). These 36 injections included three different biological samples (control, 12 h of ciprofloxacin, and 24 h of ciprofloxacin), each measured with four injections/sample in technical triplicates. For each biological sample, we generated the corresponding calibration curve individually, by applying the TopPep3/TopTra2 model onto each data set (technical replicates were averaged). Subsequently, we correlated for each sample the obtained label-free protein intensities to the determined absolute anchor point protein concentrations, respectively. The overlay of those three linear calibration curves as shown in Fig. 4C indicates that measured mass spectrometric responses were reproducible over the whole measurement period of 3 days and for all tested biological conditions, even though isolated protein abundances did change significantly between samples. This result suggests that in the present study, the unique generation of the calibration curve based on one sample would have been sufficient for the estimation of protein abundances also on all subsequent samples. However, a repetitive calibration curve generation is recommendable, especially over long measurement periods, because it will help to account for matrix effects and instrument sensitivity drifts and generally allow an optimal monitoring of the instrument performance.
Step 2: Absolute Label-free Quantification of Target Proteins
The most important motivation for the approach described here is the ability to estimate the absolute quantity of a predetermined set of proteins by SRM without the need for cost-intensive SIS peptides for each protein of interest. To demonstrate this capability, we chose 23 target proteins from L. interrogans (for detailed protein information see supplemental Table S1). These target proteins, like the anchor point proteins, were selected by their even distribution over the whole cellular abundance range. The selection of best flyer peptides and most intense transitions was performed as described before. In total, 666 transitions corresponding to 85 peptides and 23 target proteins were endogenously detectable and measured by label-free SRM (supplemental Table S2). Distributions of peptides per protein ranged from 1 to 5, and each peptide was represented by 3 to 14 transitions (supplemental Fig. S3). Subsequently, the quantification model TopPep3/TopTra2 and the linear calibration curves generated for each sample of interest, respectively (Fig. 4C), were applied to estimate absolute protein quantities (anchor point and target proteins, in total 39 proteins). The resulting concentrations for the three different biological samples are summarized in supplemental Table S3. The results were in good agreement to recently reported abundances based on shotgun MS (24) (R2 = 0.81) or directed MS (27) (R2 = 0.82; supplemental Fig. S4).
Notably, within our investigated protein set five low abundant proteins (FlgE, FlgK, FliD, FliG, and FliM) were described as not quantifiable by the shotgun method based on precursor ion intensities (24). Using the SRM approach, each of these low abundant proteins was successfully quantified with one to four peptides per protein, resulting in protein concentrations ranging from 40 to 580 copies/cell (supplemental Table S3). These data confirm the highly sensitive and selective performance of the SRM technology, which makes it especially suited for the reliable quantification of low abundant analytes.
Biological Application of Absolute Quantitative Information
Finally, we were interested in evaluating the obtained absolute quantitative results in the context of biologically relevant interrogations. Therefore, we first investigated protein abundance changes upon varying exposure times to the antibiotic ciprofloxacin (supplemental Table S3). For the identification of significant protein changes, thresholds were defined based on a protein ratio > 2 and a p value < 0.01 (calculated by a two-tailed and heteroscedastic t test) (Fig. 5). Herein, three proteins showed a significant up-regulation after 12 and 24 h of ciprofloxacin treatment (recA, LIC_12210 and hsp15). In all three cases, these results confirmed regulative trends previously reported (24, 27). Furthermore, according to the applied filter criteria, three proteins were identified as significantly down-regulated after 12 h (Mcp, LIC_11769, and FliG), whereas only Mcp remained down-regulated also after 24 h of ciprofloxacin treatment. The detected down-regulated ratios were generally smaller than the up-regulated ones. Notably, in our analysis the statistical t test analysis has been performed based on technical replicates, but typically biological variability exceeds the technical SRM measurement error. Hence biological replicates are required for confident identification and quantification of especially small protein expression differences. However, here our focus was not the reliable quantification of new protein changes upon antibiotic treatment, but the validation of our quantitative data by confirming previously reported regulations.
Fig. 5.

Identification of significant protein abundance changes between control and antibiotic-treated samples. Logarithmic protein changes (log2) of the 12 h of ciprofloxacin treatment (A) and 24 h of ciprofloxacin treatment (B) relative to the control condition were correlated to their respective logarithmic (log10) p values, calculated by a t test analysis. Threshold settings of protein changes >2-fold and p values < 0.01 (black lines) were applied to identify significantly regulated proteins.
In a second biological interrogation, we compared the determined absolute protein abundances with literature-described complex stoichiometries. This analysis requires the comparison of different protein quantities within one sample, which represents a unique type of information extractable from absolute but not from relative quantitative data sets. To date, four protein complex assemblies, comprising at least two protein components quantified in this study, have been published in the RCSB Protein Data Bank. None of these structures is derived from the presently investigated organism L. interrogans; however, in each case, the corresponding proteins from Escherichia coli, Thermus aquaticus, Bacillus sp. ta2.a1, or Thermus thermophilus represent highly homologous versions (sequence identity in average 50%). In Table II, the Protein Data Bank-derived stoichiometries and the corresponding values determined in this study are compared for all three investigated biological samples. The comparison revealed a generally good correlation, i.e. the total abundance levels of proteins known to be complex-assembled showed a reasonable stoichiometric conformance within the expected error range of ∼2-fold. Further, for three complexes (DNA-directed RNA polymerase, ATP synthase, and 30 S ribosome), the quantitative MS information was highly consistent throughout the antibiotic treatment, whereas for the GroEL-GroES chaperone complex, the stoichiometric composition changed stepwise, indicating a possibly altered complex assembly. However, it is important to consider that with the described technique, the absolute protein quantities can only be estimated averaged over the whole cell population. Hence, a discrimination between proteins present in their unassembled or complex-assembled form cannot be realized.
Table II. Comparison of protein complex stoichiometries.
| Complex name | Involved proteins (gene names) | Protein Data Bank code | Protein Data Bank stoichiometrya | Control stoichiometry | Ciprofloxacin stoichiometry |
|
|---|---|---|---|---|---|---|
| 12 h | 24 h | |||||
| DNA-directed RNA polymerase | rpoA, rpoB, rpoC | 1L9U | 2:1:1 | 3.7:1:1.0 | 3.7:1:0.8 | 3.7:1:0.9 |
| ATP synthase | atpA, atpD | 2QE7 | 1:1 | 1.6:1 | 1.6:1 | 1.6:1 |
| 30 S ribosome | rpsE rpsF | 3ORA | 1:1 | 1.0:1 | 1.0:1 | 0.9:1 |
| GroEL-GroES chaperone | groL, groS | 1WE3 | 2:1 | 0.9:1 | 1.3:1 | 1.5:1 |
a Shown Protein Data Bank-derived complex stoichiometries are based on crystal structure information from highly homolog protein complexes out of E. coli, T. aquaticus, Bacillus sp. ta2.a1, or T. thermophilus.
DISCUSSION
In this study we extend the previously described best flyer peptide approach for absolute protein abundance estimation based on precursor ion intensities (24, 27, 28) onto the SRM technology. The best flyer hypothesis assumes that the specific MS signal intensity of the most intense tryptic peptides (best flyers) per protein is approximately constant throughout a whole proteome. Hence, those intensities can be used to directly estimate protein abundances and to compare proteins within and across samples. To convert the signal intensity unit (counts/s) into a protein concentration unit (mol/liter or copies/cell), a linear calibration curve is applied that is based on accurate absolute protein abundances determined by stable isotope dilution MS for a small number of anchor point proteins.
The application of the best flyer approach onto the SRM technology was not straightforward, because peptide SRM signals are composed of several transition intensities, whereas in discovery-driven or directed MS data sets, a peptide is represented by only a single intensity value. In SRM, the respective transition intensities depend on peptide-specific fragmentation characteristics, which introduces a new level of complexity for the absolute label-free protein abundance estimation. We comprehensively investigated the application and performance of the method in a sample of medium complexity, i.e. total cell lysates of the microbe L. interrogans. Our data showed that on a TSQ Vantage QQQ platform, label-free SRM measurements were highly reproducible over a time period of 3 days, exhibiting an average technical CV of 6% (in SID measurements average CV = 1%).
Further, we determined the predictive accuracy of our method via Monte Carlo cross-validation using 16 independently quantified anchor point proteins spanning the whole cellular abundance range. We studied the influence of systematically varied best flyer peptide and transition intensity sets onto the quantitative results. Our cross-validation study revealed that performance differences across all tested peptide and protein combinations were small (cross-correlated mean fold error in the range of 1.76–2.03). However, we consistently observed that considering too many transitions and peptides per protein decreased model performance. On the first sight this finding seemed counterintuitive because considering a higher number of input data points should translate into considering more information for abundance estimation and therefore improve performance. It is, however, conceivable that certain transitions are not informative or even misleading about protein abundance. Noisy, low intense transitions are likely to belong to this type of transitions, which can lead to overfitting of the respective models and a deteriorated prediction performance on new data. Hence, it is beneficial to confine the models to fewer but maximally informative transitions. Further, as described previously, the best flyer approach is based on the hypothesis that the specific MS signal intensity of the most intense tryptic peptides per protein is approximately constant over all proteins of the proteome. This assumption does not necessarily gain in relevance when taking into account an increasing number of peptide intensity values/protein. Hence, a direct improvement in model performance based on an increased peptide number cannot necessarily be expected, as reflected in our experimental data. On the other hand, protein quantification based on a single peptide value is sensitive toward peptide outliers, caused for example by false-positive identifications, chemical and biological modifications, or incomplete and unspecific digestion procedures. To address these issues, we selected the model based on three best flying peptides per protein with the two most intense transitions per peptide (TopPep3/TopTra2) as the model of choice for absolute quantification, which showed compared with the statistically most accurate model (TopPep1/TopTra6) quantitative performance parameters that were impaired to only a minor extent. Subsequently, we used this model to estimate absolute protein abundances for in total 39 target proteins upon varying exposure times to the antibiotic ciprofloxacin. Herein five low abundant proteins, previously not quantifiable by shotgun proteomics (24), were included. With SRM, each protein was reproducibly detectable with one to four peptides per protein, highlighting the improved measurement sensitivity of the SRM technology. We evaluated and validated our quantitative results by comparing the thus determined absolute protein quantities to two recently published data sets (R2 = 0.81 and 0.82 (24, 27); supplemental Fig. S4) and by investigating and confirming significant protein changes upon ciprofloxacin treatment. For the latter relative comparison, absolute protein concentrations are not necessarily required. Instead protein changes could have been also directly determined based on transition intensity ratios between the samples. Notably, in such a relative label-free quantification experiment, measured intensity ratios originating from different transitions and peptides of the same protein are expected to have similar values, although exceptions because of interferences, modifications, or other technical artifacts might exist. Hence, based on the variance of all input ratios per protein, the quality of the obtained quantitative results can be assessed for each individual protein, and outlier values can generally be identified with greater confidence. In contrast, for the described absolute quantification approach, the multiple transition intensities need to be assembled to a single readout for each protein, leading to only a single reported protein ratio. These considerations render relative label-free quantification more sensible in detecting subtle though statistically significant abundance changes. However, a second important point needs to be considered, which is the issue of data normalization. Although absolute protein quantities are intrinsically normalized and can directly be compared between samples, experiments, or even laboratories, relative sample comparisons require an additional normalization step. Conclusively, for the accurate determination of protein changes between samples, relative as well as absolute approaches do have particular strengths and limitations that need to be considered carefully depending on the applied workflow.
Finally, we also analyzed and verified our absolute quantitative data set by comparing stoichiometric compositions of proteins known to be complex-assembled with crystal structure derived stoichiometries. We observed a generally good agreement, i.e. in all cases, the observed stoichiometries confirmed crystal structure values within the expected error range of ∼2-fold. Further, for three of four investigated protein complexes, the quantitative MS information was highly consistent throughout the antibiotic treatment, whereas for the GroEL-GroES chaperone complex, the stoichiometric composition changed stepwise. Importantly, with the described technique, complex stoichiometries can only be estimated averaged over the whole cell population. Depending on the specific complex of interest, not necessarily all subunits need to be fully assembled, but also free subunits or proteins shared between different complexes might exist in a time-, cellular compartment-, and condition-dependent manner. With the described method exclusively, population-wide absolute protein abundances can be estimated, from which stoichiometric complex compositions can be calculated and investigated under various conditions for known complex assemblies. Subsequently interesting candidate complexes can be subjected to further analyses and validations preferably using specialized techniques on the single-cell or purified complex level.
In the following section, we discuss limitations, requirements, and advantages of the presented absolute label-free quantification method to provide a guide for appropriate fields of application. In all quantitative MS experiments, precision and accuracy represent two important characteristics, which both need to be investigated and considered carefully for a meaningful interpretation of quantitative data. In terms of measurement precision, label-free MS workflows tend to be less precise than workflows based on the SID technology, because label-free methods cannot account for numerous potential sources of error, including the following: 1) variations in system sensitivity within or across LC-MS/MS runs; 2) chromatographic performance differences; 3) variable ion suppression effects; 4) interferences from co-eluting and contaminating substances; 5) electrospray instability; and 6) variations in injection volume. However, the present work, as well as a previous comparative study between label-free and SID-based SRM (42) shows that label-free SRM measurements can be performed with good reproducibility also over longer time periods and that protein abundance differences greater than 2-fold can be monitored confidently, particularly in cases where substantially similar samples are being analyzed.
The CE applied during CID can affect the fragment ion spectrum and therefore the measured transition intensities. Significant changes in the recorded transition intensities would be expected to compromise the quantitative accuracy. However, recent studies regarding CE optimization consistently reported for singly charged y-ion fragments minor changes between the usage of predicted and empirically optimized CE values (below 8% variation) (35, 43). In this study, we targeted predominantly singly charged y-ions (85%) and used an optimized equation for the TSQ Vantage instrument type to predict CE values for each peptide (35). We therefore expect the transition signal intensities to be quite robust. However, we do not rule out that depending on instrument type and sample, the process of CE optimization will be worthwhile and help to further improve absolute protein abundance estimation.
False-positive peptide identifications, i.e. erroneous peptide to SRM trace matches, may also affect precision and accuracy of the method, because in those cases protein quantities are estimated based on erroneous peptide data points. Hence, a thorough investigation and control of the underlying FDR for a given MS data set is important. In the present study, we used the mProphet algorithm (31) and the associated decoy strategy to control and limit the FDR. The determined FDR of ∼1% showed that even in the absence of isotope-labeled standards, confident peptide identifications could be realized based on transition concurrency, peak shape, intensity, and intensity correlations to a spectral library. However, we would like to sensitize users of the SRM technology that the introduction of stable isotopes can become crucial for confident peptide identifications, especially in cases where low abundant analytes are targeted in complex samples. Notably, for the purpose of improved peptide identifications, it is not necessary that SIS peptides are spiked into the sample of interest for every protein. Significantly cheaper isotope labeling techniques, such as those based on metabolic, chemical, or enzymatic labeling (for an overview see Ref. 15), can be equally applied, although leading to a significant increase in sample complexity. To further minimize the erroneous effect of false-positive identifications onto the quantitative result, several peptide data points per protein should be considered, as performed in this study by applying the TopPep3/TopTra2 model for absolute label-free quantification.
To assess the accuracy of an absolute MS measurement is challenging, because it is difficult to control variability in protein extraction, protein digestion, and protein recovery (42). Importantly, these issues apply for any MS-based absolute quantification approach, including the SID technology, which represents the most widely accepted method for absolute protein quantification in complex protein samples. The use of full-length protein standards can help accounting for digestion and protein recovery effects during sample preparation (21), but a complete extraction of the whole cellular proteome for accurate determination of copy per cell numbers is still hardly controllable. However, assuming that deviations from accuracy are equally distributed, accurate comparative studies of different proteins between samples or within one sample are feasible.
Conclusively, precise and accurate absolute label-free quantification of proteins represents a challenging task, impaired by multiple potential sources of error. However, these errors can be minimized to a satisfactory level, if sample preparation, MS measurement, and data analysis are adjusted to the respective sample type under investigation and if each step of the workflow is conducted thoroughly and reproducibly.
In the following section, we discuss three important requirements that need to be fulfilled to perform the presented absolute label-free quantification method. They are: 1) selection of a set of anchor point proteins for data calibration; 2) selection of best flyer peptides for the proteins of interest, including anchor point and target proteins; and 3) design of SRM assays for all selected best flyer peptides.
The anchor point protein set should comprise an appropriate number of proteins spanning the whole cellular abundance range. Importantly, for each anchor point protein, the absolute concentration must be known or determined accurately. In this study, we used a set of 16 proteins that were selected based on label-free quantitative shotgun data (24) and determined their quantities using SRM and SID. It is not essential that anchor point proteins remain invariant across samples and conditions; however, a distribution over the whole abundance range is important for generating meaningful linear regression curves. Although the selection and generation of suited anchor point proteins is crucial for the performance of the approach and demands a significant investment of time and costs, it needs to be performed only once per organism. The typical SIS peptide amount provided by the manufacturer (5 nmol) is sufficient for thousands of LC-MS sample injections. Hence, once established, an anchor point SIS peptide mix can be used universally for a given organism of interest over many samples and experiments. Alternatively to SIS peptides also a mixture of purified proteins from another species can be added to the sample to anchor the quantification calculations. In particular, the commercially available universal proteomic dynamic range standard 2 (UPS2; Sigma), which comprises 48 recombinant human proteins ranging from 50 pmol to 500 amol, has already been shown applicable for absolute label-free quantification based on precursor ion intensities (7). This sample, if properly tested, could potentially also serve as an anchor point protein set for absolute label-free SRM analysis of any species other than human.
The second important topic for absolute label-free SRM quantification is the selection of best flyer peptides for each targeted protein. This is an especially crucial point in the context of the SRM, where confident best flyer peptide information must be available a priori, and in contrast to discovery-driven or data-independent MS, where quantitative information for a higher number of detectable peptides per protein is gathered. Overall, in the present method the same peptide selection criteria are applicable as for other types of SRM measurements (29, 44). We only selected proteotypic peptides (45) and eliminated nontryptic or partially tryptic peptides. Further filter criteria, for example the exclusion of methionines, were not applied. Ideally, best flyer peptide selection should be performed based on empirical MS data, i.e. on the basis of precursor ion intensities or spectral counts from in-depth MS experiments. Preferably, these data sets should also include sample fractionation for increased sensitivity and proteome coverage. Such extensive MS analyses are labor-, time-, and cost-intensive; however, for various organisms qualitative and quantitative peptide identifications are already publicly available, including in-depth proteome cataloging experiments executed by various specialized labs (46, 47). Thanks to latest improvements in MS instrumentations, even more comprehensive proteome catalogs of an even broader range of organisms can be expected in the future, further facilitating the identification of best flyer peptides. Alternatively, for proteins or organisms lacking any empirical MS data, best flyer peptide selection can also be performed using predictive algorithms (44, 45).
The third requirement for the described method is the availability of SRM assay information, which includes parameters such as most intense transitions per peptide, retention time, and relative transitions intensities. This type of information can be obtained either from shotgun-based full MS/MS scans (48, 49) or from crude synthetic peptide analogs investigated by SRM triggered full MS/MS scans (50). In this study, we applied the latter approach, which has the intrinsic advantage that low complex synthetic peptide mixes are analyzed directly on the MS instrument of interest, yielding comprehensive and high quality MS/MS scans. Currently efforts are being undertaken to generate SRM assays for all MS-detectable proteins within a specific organism of interest (50).2 Hence, in the future, comprehensive SRM assay databases can be expected. Prospectively, these databases would be ideally suited to include information regarding best flyer peptides per protein and corresponding SRM assays, which will make absolute label-free quantification easily accessible for all users of the SRM technology.
Taking into account the strengths, requirements, and limitations discussed above, when and how can the described absolute label-free SRM method be applied? It is generally applicable to any SRM data set that includes measurements of the best flyer peptides per protein with a sufficient number of most intense transitions. For the conversion of protein intensities into absolute protein concentrations, a calibration curve is required. To generate this curve, accurate absolute abundance information for the anchor point proteins within the sample of interest need to be determined and correlated to label-free monitored best flyer peptides of the same proteins. Hence, the calibration curve generation necessitates an additional sample preparation step, i.e. the spiking of SIS peptides into the sample of interest, and additional measurement time (in this study ∼300 transitions). Other than these variations, the estimation of absolute protein quantities using the described method is identical to conventional SRM measurements.
In conclusion, the presented SRM-based method for absolute label-free quantification, like similar techniques based on precursor ion intensities or spectral counts, does not represent a highly accurate protein abundance measurement. However, for a sample of medium complexity, it supports the estimation of absolute protein abundances with an averaged error of ∼2-fold, if reproducible sample preparation and MS workflows are provided. Hence, it can be applied for confident determination of protein abundance differences greater than that, not only for comparative studies between different samples but also for comparisons of different proteins within one sample. The presented SRM-based technique realizes performance advantages over previously mentioned techniques, like improvements in reproducibility, precision, sensitivity, and dynamic range, which can be exploited for the simultaneous abundance estimation of 10s to 100s of target proteins at minimized costs for labeling reagents. We expect that the method can serve as a valuable supplement to discovery-driven or directed techniques, with particular strengths in analyzing low abundant proteins and in working with large cohorts of complex biological samples.
SRM data sets associated with this manuscript have been deposited to the PeptideAtlas SRM Experiment Library (PASSEL) and are accessible via the website http://www.peptideatlas.org/passel/. A R-script for model selection with Monte Carlo cross-validation is available at http://ai.stanford.edu/∼manfredc/lfqsrm.html.
Acknowledgments
We thank Dr. Mariette Matondo and Dr. Nathalie Selevsek for excellent maintenance of the TSQ instruments and constant technical advice. Further, we thank Dr. Martin Beck for helpful discussions and providing of data and information. We gratefully acknowledge Dr. Lukas Reiter and Dr. Oliver Rinner for help in data analysis and applying the mProphet software tool. We also thank Dr. Abdullah Kahraman for valuable input in using the Protein Data Bank database and Dr. Alexander Leitner for support in performing MS measurements using the LTQ-FT-ICR instrument. Olga Schubert, Dr. Ralph Schiess and Ruth Hüttenhain we gratefully acknowledge for fruitful discussions and critical reading of the manuscript.
Footnotes
* The work was supported in part by SystemsX.ch (YeastX project), the Swiss initiative for systems biology, European Union 7th Framework project PROSPECTS (Proteomics Specification in Space and Time) Grant HEALTH-F4_2008-201648, and the European Union via ERC Proteomics v3.0 Grant 233226 (to R. A.). This article must therefore be hereby marked “advertisement” in accordance with 18 U.S.C. Section 1734 solely to indicate this fact.
 This article contains supplemental Tables S1–S3 and Figs. S1–S4.
2 P. Picotti, et al., A complete mass spectrometric reference map for the analysis of the yeast proteome, manuscript in revision.
1 The abbreviations used are:
- SIS
- stable isotope-labeled standard
- CE
- collision energy
- CV
- coefficient of variation
- FDR
- false discovery rate
- SID
- stable isotope dilution technology
- SRM
- selected reaction monitoring
- QQQ
- triple quadrupole mass spectrometer
- Q
- quadrupole.
REFERENCES
- 1. de Godoy L. M., Olsen J. V., Cox J., Nielsen M. L., Hubner N. C., Fröhlich F., Walther T. C., Mann M. (2008) Comprehensive mass-spectrometry-based proteome quantification of haploid versus diploid yeast. Nature 455, 1251–1254 [DOI] [PubMed] [Google Scholar]
- 2. Krijgsveld J., Ketting R. F., Mahmoudi T., Johansen J., Artal-Sanz M., Verrijzer C. P., Plasterk R. H., Heck A. J. (2003) Metabolic labeling of C. elegans and D. melanogaster for quantitative proteomics. Nat. Biotechnol. 21, 927–931 [DOI] [PubMed] [Google Scholar]
- 3. Faca V. M., Song K. S., Wang H., Zhang Q., Krasnoselsky A. L., Newcomb L. F., Plentz R. R., Gurumurthy S., Redston M. S., Pitteri S. J., Pereira-Faca S. R., Ireton R. C., Katayama H., Glukhova V., Phanstiel D., Brenner D. E., Anderson M. A., Misek D., Scholler N., Urban N. D., Barnett M. J., Edelstein C., Goodman G. E., Thornquist M. D., McIntosh M. W., DePinho R. A., Bardeesy N., Hanash S. M. (2008) A mouse to human search for plasma proteome changes associated with pancreatic tumor development. PLoS Med. 5, e123. [DOI] [PMC free article] [PubMed] [Google Scholar]
- 4. Olsen J. V., Vermeulen M., Santamaria A., Kumar C., Miller M. L., Jensen L. J., Gnad F., Cox J., Jensen T. S., Nigg E. A., Brunak S., Mann M. (2010) Quantitative phosphoproteomics reveals widespread full phosphorylation site occupancy during mitosis. Sci Signal. 3, ra3. [DOI] [PubMed] [Google Scholar]
- 5. Bennett E. J., Rush J., Gygi S. P., Harper J. W. (2010) Dynamics of cullin-RING ubiquitin ligase network revealed by systematic quantitative proteomics. Cell 143, 951–965 [DOI] [PMC free article] [PubMed] [Google Scholar]
- 6. Kuepfer L., Peter M., Sauer U., Stelling J. (2007) Ensemble modeling for analysis of cell signaling dynamics. Nat. Biotechnol. 25, 1001–1006 [DOI] [PubMed] [Google Scholar]
- 7. Schwanhäusser B., Busse D., Li N., Dittmar G., Schuchhardt J., Wolf J., Chen W., Selbach M. (2011) Global quantification of mammalian gene expression control. Nature 473, 337–342 [DOI] [PubMed] [Google Scholar]
- 8. Nanavati D., Gucek M., Milne J. L., Subramaniam S., Markey S. P. (2008) Stoichiometry and absolute quantification of proteins with mass spectrometry using fluorescent and isotope-labeled concatenated peptide standards. Mol. Cell. Proteomics 7, 442–447 [DOI] [PubMed] [Google Scholar]
- 9. Schmidt C., Lenz C., Grote M., Lührmann R., Urlaub H. (2010) Determination of protein stoichiometry within protein complexes using absolute quantification and multiple reaction monitoring. Anal. Chem. 82, 2784–2796 [DOI] [PubMed] [Google Scholar]
- 10. Wepf A., Glatter T., Schmidt A., Aebersold R., Gstaiger M. (2009) Quantitative interaction proteomics using mass spectrometry. Nat. Methods 6, 203–205 [DOI] [PubMed] [Google Scholar]
- 11. Addona T. A., Abbatiello S. E., Schilling B., Skates S. J., Mani D. R., Bunk D. M., Spiegelman C. H., Zimmerman L. J., Ham A. J., Keshishian H., Hall S. C., Allen S., Blackman R. K., Borchers C. H., Buck C., Cardasis H. L., Cusack M. P., Dodder N. G., Gibson B. W., Held J. M., Hiltke T., Jackson A., Johansen E. B., Kinsinger C. R., Li J., Mesri M., Neubert T. A., Niles R. K., Pulsipher T. C., Ransohoff D., Rodriguez H., Rudnick P. A., Smith D., Tabb D. L., Tegeler T. J., Variyath A. M., Vega-Montoto L. J., Wahlander A., Waldemarson S., Wang M., Whiteaker J. R., Zhao L., Anderson N. L., Fisher S. J., Liebler D. C., Paulovich A. G., Regnier F. E., Tempst P., Carr S. A. (2009) Multi-site assessment of the precision and reproducibility of multiple reaction monitoring-based measurements of proteins in plasma. Nat. Biotechnol. 27, 633–641 [DOI] [PMC free article] [PubMed] [Google Scholar]
- 12. Pan S., Aebersold R., Chen R., Rush J., Goodlett D. R., McIntosh M. W., Zhang J., Brentnall T. A. (2009) Mass spectrometry based targeted protein quantification: Methods and applications. J. Proteome Res. 8, 787–797 [DOI] [PMC free article] [PubMed] [Google Scholar]
- 13. Cima I., et al. (2011) Cancer genetics-guided discovery of serum biomarker signatures for diagnosis and prognosis of prostate cancer. Proc. Natl. Acad. Sci. U.S.A. [DOI] [PMC free article] [PubMed] [Google Scholar]
- 14. Uhlén M. (2008) Affinity as a tool in life science. BioTechniques 44, 649–654 [DOI] [PubMed] [Google Scholar]
- 15. Bantscheff M., Schirle M., Sweetman G., Rick J., Kuster B. (2007) Quantitative mass spectrometry in proteomics: A critical review. Anal. Bioanal. Chem. 389, 1017–1031 [DOI] [PubMed] [Google Scholar]
- 16. Domon B., Aebersold R. (2010) Options and considerations when selecting a quantitative proteomics strategy. Nat. Biotechnol. 28, 710–721 [DOI] [PubMed] [Google Scholar]
- 17. Kito K., Ito T. (2008) Mass spectrometry-based approaches toward absolute quantitative proteomics. Curr. Genomics 9, 263–274 [DOI] [PMC free article] [PubMed] [Google Scholar]
- 18. Desiderio D. M., Kai M. (1983) Preparation of stable isotope-incorporated peptide internal standards for field desorption mass spectrometry quantification of peptides in biologic tissue. Biomed. Mass Spectrom. 10, 471–479 [DOI] [PubMed] [Google Scholar]
- 19. Gerber S. A., Rush J., Stemman O., Kirschner M. W., Gygi S. P. (2003) Absolute quantification of proteins and phosphoproteins from cell lysates by tandem MS. Proc. Natl. Acad. Sci. U.S.A. 100, 6940–6945 [DOI] [PMC free article] [PubMed] [Google Scholar]
- 20. Rivers J., Simpson D. M., Robertson D. H., Gaskell S. J., Beynon R. J. (2007) Absolute multiplexed quantitative analysis of protein expression during muscle development using QconCAT. Mol. Cell. Proteomics 6, 1416–1427 [DOI] [PubMed] [Google Scholar]
- 21. Brun V., Dupuis A., Adrait A., Marcellin M., Thomas D., Court M., Vandenesch F., Garin J. (2007) Isotope-labeled protein standards: toward absolute quantitative proteomics. Mol. Cell. Proteomics 6, 2139–2149 [DOI] [PubMed] [Google Scholar]
- 22. Ishihama Y., Oda Y., Tabata T., Sato T., Nagasu T., Rappsilber J., Mann M. (2005) Exponentially modified protein abundance index (emPAI) for estimation of absolute protein amount in proteomics by the number of sequenced peptides per protein. Mol. Cell. Proteomics 4, 1265–1272 [DOI] [PubMed] [Google Scholar]
- 23. Lu P., Vogel C., Wang R., Yao X., Marcotte E. M. (2007) Absolute protein expression profiling estimates the relative contributions of transcriptional and translational regulation. Nat. Biotechnol. 25, 117–124 [DOI] [PubMed] [Google Scholar]
- 24. Malmström J., Beck M., Schmidt A., Lange V., Deutsch E. W., Aebersold R. (2009) Proteome-wide cellular protein concentrations of the human pathogen Leptospira interrogans. Nature 460, 762–765 [DOI] [PMC free article] [PubMed] [Google Scholar]
- 25. Farrah T., et al. (2011) A high-confidence human plasma proteome reference set with estimated concentrations in PeptideAtlas. Mol. Cell. Proteomics [DOI] [PMC free article] [PubMed] [Google Scholar]
- 26. Grossmann J., et al. (2010) Implementation and evaluation of relative and absolute quantification in shotgun proteomics with label-free methods. J. Proteomics [DOI] [PubMed] [Google Scholar]
- 27. Schmidt A., Beck M., Malmström J., Lam H., Claassen M., Campbell D., Aebersold R. (2011) Absolute quantification of microbial proteomes at different states by directed mass spectrometry. Mol. Syst. Biol. 7, 510. [DOI] [PMC free article] [PubMed] [Google Scholar]
- 28. Silva J. C., Gorenstein M. V., Li G. Z., Vissers J. P., Geromanos S. J. (2006) Absolute quantification of proteins by LCMSE: A virtue of parallel MS acquisition. Mol. Cell. Proteomics 5, 144–156 [DOI] [PubMed] [Google Scholar]
- 29. Lange V., Picotti P., Domon B., Aebersold R. (2008) Selected reaction monitoring for quantitative proteomics: A tutorial. Mol. Syst. Biol. 4, 222. [DOI] [PMC free article] [PubMed] [Google Scholar]
- 30. Picotti P., Bodenmiller B., Mueller L. N., Domon B., Aebersold R. (2009) Full dynamic range proteome analysis of S. cerevisiae by targeted proteomics. Cell 138, 795–806 [DOI] [PMC free article] [PubMed] [Google Scholar]
- 31. Reiter L., Rinner O., Picotti P., Hüttenhain R., Beck M., Brusniak M. Y., Hengartner M. O., Aebersold R. (2011) mProphet: Automated data processing and statistical validation for large-scale SRM experiments. Nat. Methods 8, 430–435 [DOI] [PubMed] [Google Scholar]
- 32. Ren S. X., Fu G., Jiang X. G., Zeng R., Miao Y. G., Xu H., Zhang Y. X., Xiong H., Lu G., Lu L. F., Jiang H. Q., Jia J., Tu Y. F., Jiang J. X., Gu W. Y., Zhang Y. Q., Cai Z., Sheng H. H., Yin H. F., Zhang Y., Zhu G. F., Wan M., Huang H. L., Qian Z., Wang S. Y., Ma W., Yao Z. J., Shen Y., Qiang B. Q., Xia Q. C., Guo X. K., Danchin A., Saint Girons I., Somerville R. L., Wen Y. M., Shi M. H., Chen Z., Xu J. G., Zhao G. P. (2003) Unique physiological and pathogenic features of Leptospira interrogans revealed by whole-genome sequencing. Nature 422, 888–893 [DOI] [PubMed] [Google Scholar]
- 33. Frank R. (2002) The SPOT-synthesis technique. Synthetic peptide arrays on membrane supports: Principles and applications. J. Immunol. Methods 267, 13–26 [DOI] [PubMed] [Google Scholar]
- 34. Smith P. K., Krohn R. I., Hermanson G. T., Mallia A. K., Gartner F. H., Provenzano M. D., Fujimoto E. K., Goeke N. M., Olson B. J., Klenk D. C. (1985) Measurement of protein using bicinchoninic acid. Anal. Biochem. 150, 76–85 [DOI] [PubMed] [Google Scholar]
- 35. Maclean B., Tomazela D. M., Abbatiello S. E., Zhang S., Whiteaker J. R., Paulovich A. G., Carr S. A., Maccoss M. J. (2010) Effect of collision energy optimization on the measurement of peptides by selected reaction monitoring (SRM) mass spectrometry. Anal. Chem. 82, 10116–10124 [DOI] [PMC free article] [PubMed] [Google Scholar]
- 36. Pedrioli P. G., Eng J. K., Hubley R., Vogelzang M., Deutsch E. W., Raught B., Pratt B., Nilsson E., Angeletti R. H., Apweiler R., Cheung K., Costello C. E., Hermjakob H., Huang S., Julian R. K., Kapp E., McComb M. E., Oliver S. G., Omenn G., Paton N. W., Simpson R., Smith R., Taylor C. F., Zhu W., Aebersold R. (2004) A common open representation of mass spectrometry data and its application to proteomics research. Nat. Biotechnol. 22, 1459–1466 [DOI] [PubMed] [Google Scholar]
- 37. Deutsch E. W., Mendoza L., Shteynberg D., Farrah T., Lam H., Tasman N., Sun Z., Nilsson E., Pratt B., Prazen B., Eng J. K., Martin D. B., Nesvizhskii A. I., Aebersold R. (2010) A guided tour of the Trans-Proteomic Pipeline. Proteomics 10, 1150–1159 [DOI] [PMC free article] [PubMed] [Google Scholar]
- 38. Lam H., Deutsch E. W., Eddes J. S., Eng J. K., Stein S. E., Aebersold R. (2008) Building consensus spectral libraries for peptide identification in proteomics. Nat. Methods 5, 873–875 [DOI] [PMC free article] [PubMed] [Google Scholar]
- 39. MacLean B., Tomazela D. M., Shulman N., Chambers M., Finney G. L., Frewen B., Kern R., Tabb D. L., Liebler D. C., MacCoss M. J. (2010) Skyline: An open source document editor for creating and analyzing targeted proteomics experiments. Bioinformatics 26, 966–968 [DOI] [PMC free article] [PubMed] [Google Scholar]
- 40. Mirzaei H., McBee J. K., Watts J., Aebersold R. (2008) Comparative evaluation of current peptide production platforms used in absolute quantification in proteomics. Mol. Cell. Proteomics 7, 813–823 [DOI] [PMC free article] [PubMed] [Google Scholar]
- 41. Shao J. (1993) Linear model selection by cross-validation. J. Am. Stat. Assoc. 88, 486–494 [Google Scholar]
- 42. Zhang H., et al. (2011) Methods for peptide and protein quantitation by liquid chromatography-multiple reaction monitoring mass spectrometry. Mol. Cell. Proteomics 10, 10.1074/mcp.M110.006593 [DOI] [PMC free article] [PubMed] [Google Scholar]
- 43. Holstein Sherwood C. A., Gafken P. R., Martin D. B. (2011) Collision energy optimization of b- and y-ions for multiple reaction monitoring mass spectrometry. J. Proteome Res. 10, 231–240 [DOI] [PubMed] [Google Scholar]
- 44. Fusaro V. A., Mani D. R., Mesirov J. P., Carr S. A. (2009) Prediction of high-responding peptides for targeted protein assays by mass spectrometry. Nat. Biotechnol. 27, 190–198 [DOI] [PMC free article] [PubMed] [Google Scholar]
- 45. Mallick P., Schirle M., Chen S. S., Flory M. R., Lee H., Martin D., Ranish J., Raught B., Schmitt R., Werner T., Kuster B., Aebersold R. (2007) Computational prediction of proteotypic peptides for quantitative proteomics. Nat. Biotechnol. 25, 125–131 [DOI] [PubMed] [Google Scholar]
- 46. Deutsch E. W., Lam H., Aebersold R. (2008) PeptideAtlas: A resource for target selection for emerging targeted proteomics workflows. EMBO Rep. 9, 429–434 [DOI] [PMC free article] [PubMed] [Google Scholar]
- 47. Martens L., Hermjakob H., Jones P., Adamski M., Taylor C., States D., Gevaert K., Vandekerckhove J., Apweiler R. (2005) PRIDE: The proteomics identifications database. Proteomics 5, 3537–3545 [DOI] [PubMed] [Google Scholar]
- 48. Han B., Higgs R. E. (2008) Proteomics: From hypothesis to quantitative assay on a single platform. Guidelines for developing MRM assays using ion trap mass spectrometers. Brief Funct. Genomic Proteomic 7, 340–354 [DOI] [PubMed] [Google Scholar]
- 49. Prakash A., Tomazela D. M., Frewen B., Maclean B., Merrihew G., Peterman S., Maccoss M. J. (2009) Expediting the development of targeted SRM assays: Using data from shotgun proteomics to automate method development. J. Proteome Res. 8, 2733–2739 [DOI] [PMC free article] [PubMed] [Google Scholar]
- 50. Picotti P., Rinner O., Stallmach R., Dautel F., Farrah T., Domon B., Wenschuh H., Aebersold R. (2010) High-throughput generation of selected reaction-monitoring assays for proteins and proteomes. Nat. Methods 7, 43–46 [DOI] [PubMed] [Google Scholar]
- 51. Farrah T., Deutsch E. W., Kreisberg R., Sun Z., Campbell D. S., Mendoza L., Kusebauch U., Brusniak M.-Y., Hüttenhain R., Schiess R., Selevsek N., Aebersold R., Moritz R. L., PASSEL: The PeptideAtlas SRM Experiment Library, 2012, Proteomics, in press [DOI] [PMC free article] [PubMed] [Google Scholar]