

Abstract
Duplications and triplications of the α-synuclein (SNCA) gene increase risk for PD, suggesting increased expression levels of the gene to be associated with increased PD risk. However, past SNCA expression studies in brain tissue report inconsistent results. We examined expression of the full-length SNCA transcript (140 amino acid protein isoform), as well as total SNCA mRNA levels in 165 frontal cortex samples (101 PD, 64 control) using quantitative real-time polymerase chain reaction. Additionally, we evaluated the relationship of eight SNPs in both 5′ and 3′ regions of SNCA with the gene expression levels. The association between postmortem interval (PMI) and SNCA expression was different for PD and control samples: SNCA expression decreased with increasing PMI in cases, while staying relatively constant in controls. For short PMI, SNCA expression was increased in PD relative to control samples, whereas for long PMI, SNCA expression in PD was decreased relative to control samples.
1. Introduction
One of the genes ubiquitously involved in Parkinson disease (PD, OMIM no. 168600) is the α-synuclein (SNCA) or PARK1/4 gene. The SNCA gene encodes two major transcripts: the full-length NM_000345.2 transcript and the NM_007308.1 transcript (corresponding to the NACP140, and the NACP112 protein isoforms, resp.). Missense mutations in SNCA [1–3], as well as duplications and triplications of the SNCA locus [4–6], have been shown to lead to familial PD in an autosomal dominant manner, suggesting that increased levels of SNCA are associated with PD risk. Several studies have compared sporadic PD and control SNCA mRNA levels, as well as α-synuclein protein levels in various tissues [7–14]. SNCA expression in human brain has been shown to be significantly different between sporadic PD cases and controls, although the direction of results varies among different studies (Table 1).
Table 1.
Previous brain SNCA expression studies.
| Study | Method | Brain Region | #Samples (PD/C) | PMI, hours (range)1 | Expression in PD compared to controls | SNCA Transcript |
|---|---|---|---|---|---|---|
| Neystat et al. (1999) [7] | Ribonuclease protection assay | Substantia nigra | 15 (9/6) | 11.55 (4–18) 10.62 (3.5–17) |
Decreased, both transcripts | NM_000345.2 NM_007308.1 |
| Frontal cortex | 15 (9/6) | 11.55 (4–18) 10.62 (3.5–17) |
No significant difference | |||
| Kingsbury et al. (2004) [9] | Semiquantitative in situ | Substantia nigra | 11 (7/4) | 23.2 (9.3–56) 33.0 (22–53) |
Decreased | NM_000345.2 |
| Hybridization | Frontal cortex | 12 (8/4) | 24.4 (10.6–40) 33.0 (22–53) |
Decreased | ||
| Temporal cortex | 12 (8/4) | 24.4 (10.6–40) 33.0 (22–53) |
No significant difference | |||
| Chiba-Falek et al. (2006) [11] | Real-time PCR | Mid-brain | 14 (7/7) | 16.93 (2.00–22.08) 18.62 (14–24) |
Increased | NM_000345.2 |
| Frontal cortex | 7 (4/3) | 14 (2–20) 24.66 (22–28) |
No significant difference | |||
| Fuchs et al. (2008) [13] | Real-time PCR | Substantia nigra | 22 (8/14) | All: 25 (N/A) | No significant difference | NM_000345.2 |
| Cingulate gyrus | 32 (13/19) | All: 22 (N/A) | No significant difference | |||
| Cerebellum | 10 (5/5) | All: 15 (N/A) | Decreased | |||
| Beyer et al. (2011) [14] | Real-time PCR | Caudate nucleus | 21 (7/14) | 6.03 (3.5–7.0) 7.40 (3.5–13.0) |
No significant difference | NM_007308.1 |
| Pons | 21 (7/14) | 6.03 (3.5–7.0) 7.40 (3.5–13.0) |
No significant difference | |||
| Temporal cortex | 21 (7/14) | 6.03 (3.5–7.0) 7.40 (3.5–13.0) |
No significant difference |
C: Control; PD: Parkinson disease.
NM_000345.2 =140 amino acid isoform; NM_007308.1 =112 amino acid isoform.
1The postmortem interval mean and range data for PD samples are on the first line and those for control samples are on the second line. The Fuchs et al. study (2008) only had aggregate mean postmortem interval data available.
Variations in both the 3′ and the 5′ regions of the SNCA gene have also been associated with increased risk for idiopathic PD [15–22]. Additionally, there is evidence that single-nucleotide polymorphisms in the 3′ region of SNCA influence the gene's mRNA levels [13, 23–25].
None of the past SNCA expression studies contrasting PD cases and controls used more than 32 total brain samples per brain region (Table 1). Small sample sizes reduce power to detect consistent effects and may have contributed to the conflicting results. We present the largest study to date contrasting SNCA expression between PD and control brain samples, with analysis performed for both full-length SNCA transcript (140 residue protein isoform, hereafter referred to as SNCA-FL), and total SNCA mRNA in the frontal cortex. Additionally, we analyze the relation of eight SNPs in the 5′ and 3′ regions of SNCA to SNCA expression levels.
2. Materials and Methods
2.1. Brain Samples
Brain tissue from the frontal cortex Brodmann area 9 was collected from 118 PD cases and 87 control brains. The brain tissue was obtained from three different brain banks: the Harvard Brain Tissue Resource Center (HBTRC) McLean Hospital, Belmont, Massachusetts, the Human Brain and Spinal Fluid Resource Center (HBSFRC) VA West Los Angeles Healthcare Center, California, and the Sun Health Research Institute (SHRI) Sun City, Arizona.
2.2. pH Measurements
The pH of all samples was measured following a previously established protocol [26]. A minimum of two pH measurements were taken for each brain sample and the average value of all readings was used.
2.3. Neuropathological Information
Neuropathology reports were available for case and control samples. These reports were used to verify the PD diagnosis in the cases, and to evaluate the presence of Alzheimer disease (AD) characteristics in all brain samples. The AD variable for each brain was categorized as 0, 1, or 2 and was determined by a grading of plaques and the Braak score [27, 28]. A value of 0 corresponds to brains that had no indication of Alzheimer pathology, a value of 1 corresponds to brains that had suggestive Alzheimer pathology, and a value of 2 corresponds to brains with unequivocal Alzheimer pathology (Supplementary Table 1 available at doi:10.1155/2012/614212).
2.4. Quantitative Real-Time Polymerase Chain Reaction
2.4.1. RNA Extraction and cDNA Synthesis
Total RNA from the brain samples was extracted using the TRIzol reagent (Invitrogen, Carlsbad, CA). The obtained RNA was quantified at 260 nm using a NanoDrop spectrophotometer (Thermo Fisher Scientific, Wilmington, DE). One microgram cDNA was synthesized for each brain sample using the iScriptTM cDNA Synthesis Kit (BIO-RAD, Hercules, CA).
2.4.2. Endogenous Control Gene and the Analysis Method
We considered both the Relative Standard Curve and the ΔΔCt methods for the real-time PCR quantification of SNCA expression. QARS (encoding for Glutaminyl-tRNA synthetase) was selected as a control gene, given its successful use in previous cortex expression studies [29, 30]. Predesigned TaqMan primers for QARS (Hs00909458_g1), SNCA transcript NM_000345.2 (Hs00240907_m1, e.g., SNCA-FL), and all SNCA transcripts (Hs01103383_m1, total SNCA) were obtained from Applied Biosystems (Foster City, CA). Each sample was run in triplicate for each assay on an ABI PRISM 7900HT Sequence Detection system (Applied Biosystems, Foster City, CA). The control gene did not have the same PCR amplification efficiency as the SNCA target assays, which is a requirement for valid ΔΔCt calculations (Validation Experiment, ABI qRT-PCR manual). Therefore, the Relative Standard Curve Method was used to assess the expression data. The standard curves for the three assays were created from pooled cDNA from all available samples and were used to transform the Ct values into quantity units. For each sample that passed the QC filtering criteria, the quantity units for the SNCA-FL and total SNCA assays were standardized by division to the QARS control assay quantity value.
2.4.3. DNA Extraction
DNA from the brain samples was extracted using QIAGEN's Puregene Core Kit A (QIAGEN, Valencia, CA) according to the manufacturer's protocol.
2.4.4. Genotyping
Eight SNPs around the SNCA gene on chromosome 4 (Table 3) were genotyped in the available brain samples using the TaqMan technology implemented on an ABI PRISM 7900HT Sequence Detection system (Applied Biosystems, Foster City, CA). Pairs of SNPs rs356219-rs356229 (r 2 = 0.51) and rs4106153-rs1504489 (r 2 = 0.27) were in modest LD, as calculated by using all available brain samples.
Table 3.
Description of the genotyped SNPs and results for association with SNCA expression.
| SNP | Position (Genome Build 36.3) | Gene | Familial PD GWAS P-values [32] | SNCA expression estimate | SNCA expression min P-value | Samplea/ Transcriptb/Modelc |
MAF in expression samples | A1/A2 |
|---|---|---|---|---|---|---|---|---|
| rs1560488 | 90,444,858 | GPRIN3 | 0.12 | 0.235 | 0.048 | C/T/rec | 0.229 | T/C |
| rs4106153 | 90,463,499 | intergenic | 9.18 × 10⁻⁵ | −0.048 | 0.206 | All/T/add | 0.196 | C/A |
| rs1504489 | 90,477,611 | intergenic | 8.42 × 10⁻⁵ | −0.124 | 0.089 | PD/T/rec | 0.425 | T/G |
| rs924033 | 90,654,576 | intergenic | 0.02 | 0.165 | 0.041 | C/FL/add | 0.067 | G/T |
| rs356229 | 90,825,620 | intergenic | 5.48 × 10⁻⁵ | −0.099 | 0.247 | C/FL/rec | 0.360 | C/T |
| rs356219 | 90,856,624 | intergenic | *2.24 × 10⁻⁶ | 0.053 0.040 |
0.062 0.085 |
PD/FL/add All/FL/add |
0.391 | G/A |
| rs356188 | 90,910,560 | SNCA | 8.41 × 10⁻⁵ | 0.062 | 0.063 | C/FL/add |
0.278 | C/T |
| rs3775478 | 91,061,863 | MMRN1 | 6.07 × 10⁻⁵ | 0.035 0.017 |
0.672 0.672 |
C/T/add All/FL/add |
0.090 | G/A |
2.5. Quality Control
2.5.1. RNA and DNA Extraction
Samples with RNA or DNA extraction yields below 5 μg after several attempts were removed from the study.
2.5.2. RT-PCR
Samples were removed from the study if the variation in expression across the triplicate Ct values for any of the four gene expression assays was larger than 2 (Section 2.4).
2.5.3. Postmortem Information
Samples were excluded if their PMI information was missing.
2.5.4. Neuropathological Information
Samples were removed when controls showed signs of Lewy bodies, or when PD was not confirmed neuropathologically (e.g., absence of Lewy bodies).
2.5.5. Age at Death
The age at death was available for cases and controls, but the range of values differed by disease status. All controls outside of ±5 years of the PD range (Table 2) were excluded from the case-control contrasts.
Table 2.
Characteristics of the PD cases and controls included in analysis.
| Site | Type | Gender | Age, years (range) | PMI, hours (range) | Tissue pH (range) | PD Duration, years (range) |
|---|---|---|---|---|---|---|
| HBSFRC | 2 C | 2M | 86.5 (80–93) | 19.5 (13–26) | 6.41 (6.26–6.55) | N/A |
| 17 PD | 9F/8M | 82.2 (63–95) | 16.3 (9–37) | 6.30 (6.02–6.62) | 11.5 (4–28) | |
| BTRC | 39 C | 39M | 61.4 (36–106) | 21.9 (10–39.6) | 6.71 (5.95–7.32) | N/A |
| 35 PD | 35M | 76.3 (64–95) | 17.9 (6.6–30.7) | 6.50 (5.86–7.13) | 11.2 (3–23) | |
| SHRI | 23 C | 13F/10M | 84.3 (63–97) | 2.68 (1–5.5) | 6.71 (6.29–7.13) | N/A |
| 49 PD | 11F/38M | 78.5 (64–90) | 3.11 (1–10) | 6.59 (6.17–7.44) | 10.4 (0–40) | |
| All | 64 C | 13F/51M | 70.5 (36–106) | 14.9 (1–39.6) | 6.70 (5.95–7.32) | N/A |
| 101 PD | 20F/81M | 78.3 (63–95) | 10.4 (1–37) | 6.51 (5.86–7.44) | 10.9 (0–40) | |
| Final C Set* | 46 C | 13F/33M | 77.2 (58–97) | 11.7 (1–39.6) | 6.67 (5.95–7.32) | N/A |
C: Control; PD: Parkinson disease.
HBSFRC = Human Brain and Spinal Fluid Resource Center VA West Los Angeles Healthcare Center.
HBTRC = Harvard Brain Tissue Resource Center, McLean Hospital, Belmont, Massachusetts.
SHRI = Sun Health Research Institute in Sun City, Arizona.
*after removing controls with age at death ± 5 years beyond age at death of cases (< age 58 or > age 100).
2.5.6. Genotyping
All samples with missing genotypes for more than 4 SNPs (less than 50% call rate) were removed from the genotype-expression part of the study. All genotyped SNPs had call rates higher than 92.12%.
2.5.7. Statistical Analyses
The statistical analyses were performed using SAS 9.1 for Windows. The base 10 logarithm of the standardized SNCA-FL and total SNCA expression values was used for all analyses, to ensure the normal distribution of data required by the statistical tests performed. The distributions of the log10 SNCA-FL and log10 total SNCA expression values were examined within site, sex, and disease status subgroups. Samples were removed from analysis if they had SNCA-FL and total SNCA expression values lower than the 1st quartile minus 1.5∗ interquartile range, or greater than the 3rd quartile plus 1.5∗ interquartile range. In the final sample data-set, the SNCA-FL and total SNCA log10 transformed expression values did not deviate significantly from the normal distribution (Shapiro-Wilk test), except for two of the total SNCA subgroups (SHRI/female/Control and HBTRC/male/PD).
2.6. Regression Models
2.6.1. Association of SNCA Expression with Disease Status
We considered several covariates when looking at the association between SNCA expression and disease status, including sex, PMI, source of the specimen, pH, AD, and age at death. Since the PMI was highly correlated to the brain bank source (Table 2), the use of either PMI or site as a covariate yielded comparable results in our models. We retained PMI in these models. PMI and pH were selected as covariates because they were found to be associated with SNCA expression. Sex was retained due to a prior report, showing differences in SNCA expression between men and women [31]. Age at death was retained in the final model because it was significantly associated with SNCA expression in controls and was a modest confounder of the relationship between disease status and SNCA expression. AD was not associated and was not a confounder of SNCA expression; therefore, it was not included in the regression analyses. The interaction between PMI and disease status was included to adjust for the observed variation in SNCA expression between PD cases and controls at different PMIs.
2.6.2. Genotyping Analysis
Eight SNPs were tested for association with disease status, as well as for association with SNCA-FL and total SNCA expression. Each SNP was evaluated in additive and, whenever the rare homozygote was present, recessive models. Disease association models included adjustment for sex and age at death. Expression models were analyzed for the set of all brains, as well as within only PD cases and only controls. The entire sample analysis included adjustment for disease status, sex, pH, age at death, as well as for the interaction between PMI and disease status. In the analyses stratified by disease status only, sex, pH, age at death, and PMI were included in the model.
3. Results
Unless otherwise stated, a significance level of α = 0.05 and log10 expression values (see Section 2.5.7) were used for all tests.
3.1. Samples Excluded from the Final Analyses
One control brain and one PD case from HBTRC were excluded from the study due to low DNA extraction yields. One control sample from HBSFRC and seven control samples from SHRI were excluded from further analyses due to low RNA yields. Eleven PD cases (5 from HBTRC, 5 from SHRI, 1 from HBSFRC) and eleven controls (5 from HBTRC, 5 from SHRI, 1 from HBSFRC) were excluded due to inconsistencies among the Ct values in replicates. One control and one PD case from HBSFRC were discarded due to missing PMI information. One HBTRC control showing Lewy bodies at the neuropathological exam, and one HBTRC PD case with very long duration of disease but no Lewy body pathology were removed from analysis. Four brain samples (1 control from HBTRC, 1 PD from HBSFRC, and 2 PD from SHRI) were outliers for both SNCA-FL and total SNCA expression assays and were, therefore, removed. Four PD cases from HBTRC with missing genotypes for at least 6 SNPs were removed from the genotype-expression analysis only. Eighteen controls from HBTRC that were outside the ± 5 years age at death range for the PD group were removed for the expression analyses. The description of the final set of samples used in the study is presented in Table 2.
3.2. Correlations and Associations
SNCA-FL and total SNCA expression values were highly correlated (Pearson correlation r value = 0.76, P < 0.0001 in the 165 samples).
We observed a significant association between age at death and SNCA expression values in controls, after adjustment for pH, PMI, and sex (Figure 1 and Supplementary Figure 1; total SNCA: β = −0.0059, P = 0.0053; SNCA-FL: β = −0.0031, P = 0.0324). No significant association between age at death and expression values was observed in PD cases after adjusting for pH, PMI, and sex (total SNCA: P = 0.84; SNCA-FL: P = 0.72). The significant association between SNCA expression and age at death remained in controls even after removing samples outside the PD age at death range ± 5 years (total SNCA: β = −0.0107, P = 0.0075; SNCA-FL: β = −0.0056, P = 0.0317). Our results confirm the previous finding by Tan et al. (2005), who observed a similar relationship of total SNCA expression with age at death in lymphocyte samples from 80 ethnic Chinese control subjects [10].
Figure 1.
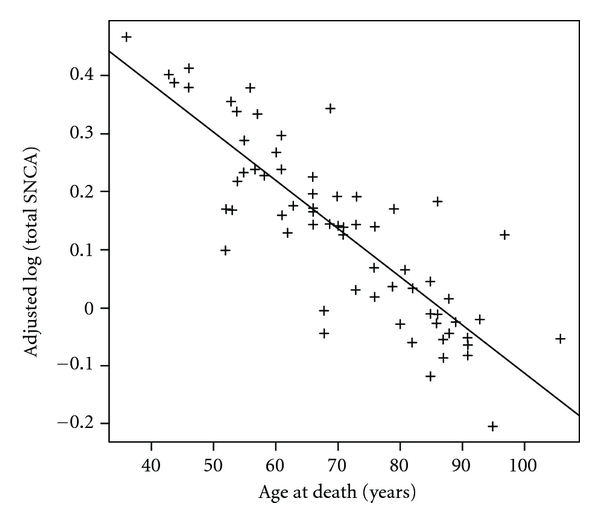
Age at death versus total SNCA expression values adjusted for pH, PMI, and sex in 64 controls.
In a PMI, age at death, and sex-adjusted model, pH was significantly, positively associated with expression of total SNCA in PD cases (P < 0.0001) and controls (P = 0.002) and with SNCA-FL in PD cases (P = 0.0024), but not in controls (P = 0.14). We also observed a significant negative association between PMI and both SNCA-FL and total SNCA expression values in PD samples after adjustment for sex, age at death, and pH (P < 0.0001 for both SNCA-FL and total SNCA), but not in controls (total SNCA: P = 0.96; SNCA-FL: P = 0.54).
The correlation between duration of disease in PD samples and SNCA expression was not significant (total SNCA: P = 0.97; SNCA-FL: P = 0.64). Additionally, no significant association between the duration of disease in PD samples and SNCA expression was observed after adjustment for sex, age at death, and pH.
3.3. Expression Results
Interestingly, the PMI was determined to modify the relationship between expression and disease status for both SNCA-FL and total SNCA. For PMI of 5.5 hours or less (23 controls, 45 cases), PD cases had higher total SNCA expression (β = 0.1501, P = 0.0319) and higher SNCA -FL expression (β = 0.1195, P = 0.0051) than controls. For PMI of 10 hours or more (23 controls, 48 cases), PD cases had lower total SNCA expression (β = −0.2716, P = 0.0005) and lower SNCA-FL expression (β = −0.1708, P = 0.0093) than controls. The presented results were adjusted for sex, age at death, pH, and PMI. The predicted regression lines for total SNCA and SNCA-FL for PD cases and controls after adjustment for age at death, pH, PMI, sex, and disease status-PMI interaction are shown in Figure 2 and Supplementary Figure 2, respectively.
Figure 2.
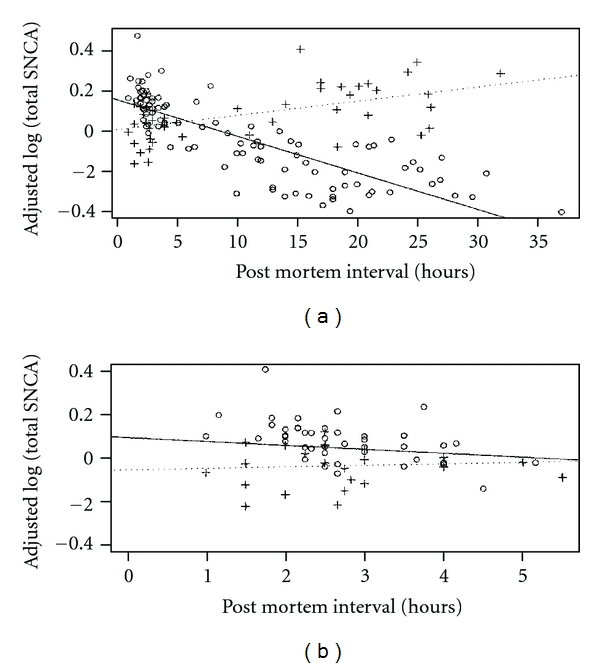
Adjusted total SNCA expression values by PMI for (a) all samples and (b) only samples with PMI less or equal to 5.5 hours. Controls are depicted as crosses (dotted regression line) and PD samples as circles (solid regression line).
3.4. eSNP Results
None of the eight SNPs had a significant nominal P-value for association with disease status in our data. Additionally, none of the SNPs had a P-value associated with expression that was significant after Bonferroni adjustment for multiple testing. Nevertheless, significant nominal P-values (Table 3) were obtained for the following SNPs: rs924033 for SNCA-FL expression using the additive model in controls only, and rs1560488 for total SNCA expression using the recessive model in controls only.
4. Discussion
The presence of the α-synuclein protein (α-syn) in Lewy bodies [34], together with the findings of SNCA gene mutations [1–3], SNCA gene duplications, and triplications in familial PD [4–6], and SNCA SNP associations in PD genome-wide association studies [32] make this gene a focal point of PD research. The association of increased gene dosage with PD risk strongly suggests that increased levels of α-syn increase risk for PD. Yet, SNCA gene expression studies have yielded inconsistent results with several reporting reduced SNCA mRNA levels in PD versus control brains. In this study of 101 PD and 64 control brains, we found significant differences for the effect of post mortem interval on SNCA levels in PD. These results may shed light on the previous contradictory expression findings and support the hypothesis that PD is associated with increased SNCA levels.
We detected increased expression of the full-length SNCA transcript, as well as overall SNCA gene expression, in PD compared to control brains at PMI up to 5.5 hours. Additionally, we observed significantly decreased levels of full-length and total SNCA in PD compared to control brains at PMI longer than 10 hours. The result obtained for short PMI suggests the presence of biologically increased levels of SNCA expression in PD compared to normal brains, while the apparently conflicting findings between short and long PMI groups could be attributable to a more rapid degradation rate of SNCA, and possibly other transcripts, in PD brains. The presence of increased RNA degradation activity in PD compared to normal brains is conceivable, given the large differences in expression profiles between normal and affected brains [29]. Additionally, although little information is available on the differential mRNA degradation levels between neurologically healthy and diseased brains, there exists a prior report of correlation between PMI and pH (and indirectly between PMI and certain mRNAs level [26]) in Alzheimer disease, but not in control brains [35].
Previous SNCA expression studies have consistently used relatively small numbers of brain samples with mixed PMI values (commonly above 10 hours), precluding an accurate assessment of the effect of PMI [36]. Therefore, the previous conflicting results (Table 1) might be an artifact of both small sample sizes and heterogeneous PMI values.
It is important to note, however, that the different sources of tissue in our study were also related to different PMI values (Table 2). Nearly all of the short PMI samples were from the SHRI brain bank. Therefore, we cannot exclude the possibility that the source of the tissue also influences SNCA expression levels. Nevertheless, our statistical analyses included all major variables that are commonly considered in expression studies, and we do not know of any other differences that may exist among the different brain tissue sources and would influence SNCA expression. Additionally, given the previous knowledge of frontal cortex homogeneity in terms of expression [11], it is unlikely that variation within the Brodmann area 9 from different brain banks is a factor in the observed findings.
We acknowledge as a possible limitation for our SNCA RT-PCR expression study the use of a single control gene. To address this potential problem, we tried to evaluate the obtained RT-PCR expression data by using expression results from a recent microarray study [37]. The microarray experiment was performed on the One-Color Agilent 60-mer Whole Human Genome Microarray, which contains a single 3′ UTR probe for the SNCA gene repeated 10 times on the chip. The microarray experiment included a subset of 26 PD and 23 control samples from the RT-PCR study. The range of PMI values for the microarray samples did not allow the interaction study presented in this paper to be tested. Nevertheless, we could evaluate the correlation between the two RT-PCR SNCA probes and the median expression value of the microarray SNCA probe, which measures total expression of the gene. As expected, the correlation between the total SNCA and the microarray SNCA probe (r = 0.68, P = 6.6E−8) was strong and better than the correlation between the SNCA-FL and the microarray SNCA probe (r = 0.43, P = 0.001). These correlation results imply the validity of the RT-PCR data.
Our study suggests that sporadic PD is associated with increased SNCA mRNA levels in samples with short PMI. The observation of higher SNCA expression in controls among samples with longer PMI suggests that SNCA transcripts may degrade more rapidly in PD than in normal brain; this result points to the importance of brain samples with short PMI for an accurate evaluation of RNA levels in PD. Therefore, brain banks such as the Sun Health Research Institute, which can provide samples with very low PMI to the research community, are valuable for future neurodegenerative research.
Supplementary Material
The Supplementary Materials contain the following information: 1) a description of the neuropathological criteria used to define the Alzheimer disease variable discussed in Section 2.3 of Materials and Methods (Table 1), 2) a scatter plot of age at death and SNCA-FL expression values (after adjustment for pH, PMI, and sex) in controls, which shows a significant association (Figure 1), and 3) the scatter plots and predicted regression lines for SNCA-FL expression (after adjustment for age at death, pH, PMI, sex and disease status-PMI interaction) in PD cases and controls for the whole range of available postmortem intervals and for postmortem intervals up to 5.5 hours (Figure 2).
Acknowledgments
This study was supported by the PHS Grant R01 NS36711-09 “Genetic Linkage Study in PD,” NIH Grant T32 GM074905 “Interdisciplinary Training for Biostatisticians,” the Robert P. and Judith N. Goldberg Foundation, and the Bumpus Foundation. The authors would like to thank the following institutions for providing us with brain tissue used in this study: the Banner Sun Health Research Institute Brain and Body Donation Program, which is supported by the National Institute of Neurological Disorders and Stroke (U24 NS072026 National Brain and Tissue Resource for Parkinson's Disease and Related Disorders), the National Institute on Aging (P30 AG19610 Arizona Alzheimer's Disease Core Center), the Arizona Department of Health Services (Contract 211002, Arizona Alzheimer's Research Center), the Arizona Biomedical Research Commission (Contracts 4001, 0011, 05-901, and 1001 to the Arizona Parkinson's Disease Consortium), the Michael J. Fox Foundation for Parkinson's Research, the Harvard Brain Tissue Resource Center, which is supported in part by PHS Grant no. R24 MH 068855, and the Human Brain and Spinal Fluid Resource Center at VA West Los Angeles Healthcare Center, which is sponsored by NINDS/NIMH, National Multiple Sclerosis Society, Department of Veterans.
References
- 1.Polymeropoulos MH, Lavedan C, Leroy E, et al. Mutation in the α-synuclein gene identified in families with Parkinson’s disease. Science. 1997;276(5321):2045–2047. doi: 10.1126/science.276.5321.2045. [DOI] [PubMed] [Google Scholar]
- 2.Krüger R, Kuhn W, Müller T, et al. Ala30Pro mutation in the gene encoding α-synuclein in Parkinson’s disease. Nature Genetics. 1998;18(2):106–108. doi: 10.1038/ng0298-106. [DOI] [PubMed] [Google Scholar]
- 3.Zarranz JJ, Alegre J, Gómez-Esteban JC, et al. The new mutation, E46K, of α-synuclein causes Parkinson and lewy body dementia. Annals of Neurology. 2004;55(2):164–173. doi: 10.1002/ana.10795. [DOI] [PubMed] [Google Scholar]
- 4.Singleton AB, Farrer M, Johnson J, et al. α-synuclein locus triplication causes Parkinson’s disease. Science. 2003;302(5646):p. 841. doi: 10.1126/science.1090278. [DOI] [PubMed] [Google Scholar]
- 5.Chartier-Harlin MC, Kachergus J, Roumier C, et al. α-synuclein locus duplication as a cause of familial Parkinson’s disease. The Lancet. 2004;364(9440):1167–1169. doi: 10.1016/S0140-6736(04)17103-1. [DOI] [PubMed] [Google Scholar]
- 6.Ibáñez P, Bonnet AM, Débarges B, et al. Causal relation between α-synuclein gene duplication and familial Parkinson’s disease. The Lancet. 2004;364(9440):1169–1171. doi: 10.1016/S0140-6736(04)17104-3. [DOI] [PubMed] [Google Scholar]
- 7.Neystat M, Lynch T, Przedborski S, Kholodilov N, Rzhetskaya M, Burke RE. α-synuclein expression in substantia nigra and cortex in Parkinson's disease. Movement Disorders. 1999;14(3):417–422. doi: 10.1002/1531-8257(199905)14:3<417::aid-mds1005>3.0.co;2-x. [DOI] [PubMed] [Google Scholar]
- 8.Kim S, Seo JH, Suh YH. Alpha-synuclein, Parkinson's disease, and Alzheimer's disease. Parkinsonism & Related Disorders. 2004;10(supplement 1):S9–S13. doi: 10.1016/j.parkreldis.2003.11.005. [DOI] [PubMed] [Google Scholar]
- 9.Kingsbury AE, Daniel SE, Sangha H, Eisen S, Lees AJ, Foster OJF. Alteration in α-synuclein mRNA expression in Parkinson's disease. Movement Disorders. 2004;19(2):162–170. doi: 10.1002/mds.10683. [DOI] [PubMed] [Google Scholar]
- 10.Tan EK, Chandran VR, Fook-Chong S, et al. Alpha-synuclein mRNA expression in sporadic Parkinson’s disease. Movement Disorders. 2005;20(5):620–623. doi: 10.1002/mds.20391. [DOI] [PubMed] [Google Scholar]
- 11.Chiba-Falek O, Lopez GJ, Nussbaum RL. Levels of alpha-synuclein mRNA in sporadic Parkinson disease patients. Movement Disorders. 2006;21(10):1703–1708. doi: 10.1002/mds.21007. [DOI] [PubMed] [Google Scholar]
- 12.Westerlund M, Belin AC, Anvret A, et al. Cerebellar α-synuclein levels are decreased in Parkinson's disease and do not correlate with SNCA polymorphisms associated with disease in a Swedish material. FASEB Journal. 2008;22(10):3509–3514. doi: 10.1096/fj.08-110148. [DOI] [PubMed] [Google Scholar]
- 13.Fuchs J, Tichopad A, Golub Y, et al. Genetic variability in the SNCA gene influences α-synuclein levels in the blood and brain. FASEB Journal. 2008;22(5):1327–1334. doi: 10.1096/fj.07-9348com. [DOI] [PubMed] [Google Scholar]
- 14.Beyer K, Ispierto L, Latorre P, Tolosa E, Ariza A. Alpha- and beta-synuclein expression in Parkinson disease with and without dementia. Journal of the Neurological Sciences. 2011;310(1-2):112–117. doi: 10.1016/j.jns.2011.05.049. [DOI] [PubMed] [Google Scholar]
- 15.Farrer M, Maraganore DM, Lockhart P, et al. α-synuclein gene haplotypes are associated with Parkinson’s disease. Human Molecular Genetics. 2001;10(17):1847–1851. doi: 10.1093/hmg/10.17.1847. [DOI] [PubMed] [Google Scholar]
- 16.Izumi Y, Morino H, Oda M, et al. Genetic studies in Parkinson’s disease with an α-synuclein/NACP gene polymorphism in Japan. Neuroscience Letters. 2001;300(2):125–127. doi: 10.1016/s0304-3940(01)01557-9. [DOI] [PubMed] [Google Scholar]
- 17.Holzmann C, Krüger R, Vieira Saecker AMM, et al. Polymorphisms of the α-synuclein promoter: expression analyses and association studies in Parkinson’s disease. Journal of Neural Transmission. 2003;110(1):67–76. doi: 10.1007/s00702-002-0769-5. [DOI] [PubMed] [Google Scholar]
- 18.Mueller JC, Fuchs J, Hofer A, et al. Multiple regions of α-synuclein are associated with Parkinson’s disease. Annals of Neurology. 2005;57(4):535–541. doi: 10.1002/ana.20438. [DOI] [PubMed] [Google Scholar]
- 19.Maraganore DM, De Andrade M, Elbaz A, et al. Collaborative analysis of α-synuclein gene promoter variability and Parkinson disease. Journal of the American Medical Association. 2006;296(6):661–670. doi: 10.1001/jama.296.6.661. [DOI] [PubMed] [Google Scholar]
- 20.Hadjigeorgiou GH, Xiromerisiou G, Gourbali V, et al. Association of α-synuclein Rep1 polymorphism and Parkinson's disease: influence of Rep1 on age at onset. Movement Disorders. 2006;21(4):534–539. doi: 10.1002/mds.20752. [DOI] [PubMed] [Google Scholar]
- 21.Mizuta I, Satake W, Nakabayashi Y, et al. Multiple candidate gene analysis identifies α-synuclein as a susceptibility gene for sporadic Parkinson’s disease. Human Molecular Genetics. 2006;15(7):1151–1158. doi: 10.1093/hmg/ddl030. [DOI] [PubMed] [Google Scholar]
- 22.Pals P, Lincoln S, Manning J, et al. α-Synuclein promoter confers susceptibility to Parkinson’s disease. Annals of Neurology. 2004;56(4):591–595. doi: 10.1002/ana.20268. [DOI] [PubMed] [Google Scholar]
- 23.Sotiriou S, Gibney G, Baxevanis AD, Nussbaum RL. A single nucleotide polymorphism in the 3′UTR of the SNCA gene encoding alpha-synuclein is a new potential susceptibility locus for Parkinson disease. Neuroscience Letters. 2009;461(2):196–201. doi: 10.1016/j.neulet.2009.06.034. [DOI] [PMC free article] [PubMed] [Google Scholar]
- 24.Linnertz C, Saucier L, Ge D, et al. Genetic regulation of α-synuclein mRNA expression in various human brain tissues. PLoS ONE. 2009;4(10) doi: 10.1371/journal.pone.0007480. Article ID e7480. [DOI] [PMC free article] [PubMed] [Google Scholar]
- 25.McCarthy JJ, Linnertz C, Saucier L, et al. The effect of SNCA 3′ region on the levels of SNCA-112 splicing variant. Neurogenetics. 2011;12(1):59–64. doi: 10.1007/s10048-010-0263-4. [DOI] [PMC free article] [PubMed] [Google Scholar]
- 26.Harrison PJ, Heath PR, Eastwood SL, Burnet PWJ, McDonald B, Pearson RCA. The relative importance of premortem acidosis and postmortem interval for human brain gene expression studies: selective mRNA vulnerability and comparison with their encoded proteins. Neuroscience Letters. 1995;200(3):151–154. doi: 10.1016/0304-3940(95)12102-a. [DOI] [PubMed] [Google Scholar]
- 27.Jellinger KA, Seppi K, Wenning GK, Poewe W. Impact of coexistent Alzheimer pathology on the natural history of Parkinson’s disease. Journal of Neural Transmission. 2002;109(3):329–339. doi: 10.1007/s007020200027. [DOI] [PubMed] [Google Scholar]
- 28.Beach TG, Adler CH, Lue LF, et al. Unified staging system for Lewy body disorders: correlation with nigrostriatal degeneration, cognitive impairment and motor dysfunction. Acta Neuropathologica. 2009;117(6):613–634. doi: 10.1007/s00401-009-0538-8. [DOI] [PMC free article] [PubMed] [Google Scholar]
- 29.Moran LB, Duke DC, Deprez M, Dexter DT, Pearce RKB, Graeber MB. Whole genome expression profiling of the medial and lateral substantia nigra in Parkinson’s disease. Neurogenetics. 2006;7(1):1–11. doi: 10.1007/s10048-005-0020-2. [DOI] [PubMed] [Google Scholar]
- 30.Moran LB, Hickey L, Michael GJ, et al. Neuronal pentraxin II is highly upregulated in Parkinson’s disease and a novel component of Lewy bodies. Acta Neuropathologica. 2008;115(4):471–478. doi: 10.1007/s00401-007-0309-3. [DOI] [PMC free article] [PubMed] [Google Scholar]
- 31.Cantuti-Castelvetri I, Keller-McGandy C, Bouzou B, et al. Effects of gender on nigral gene expression and parkinson disease. Neurobiology of Disease. 2007;26(3):606–614. doi: 10.1016/j.nbd.2007.02.009. [DOI] [PMC free article] [PubMed] [Google Scholar]
- 32.Pankratz N, Wilk JB, Latourelle JC, et al. Genomewide association study for susceptibility genes contributing to familial Parkinson disease. Human Genetics. 2009;124(6):593–605. doi: 10.1007/s00439-008-0582-9. [DOI] [PMC free article] [PubMed] [Google Scholar]
- 33.Latourelle JC, Pankratz N, Dumitriu A, et al. Genomewide association study for onset age in Parkinson disease. BMC Medical Genetics. 2009;10, article 1471:p. 98. doi: 10.1186/1471-2350-10-98. [DOI] [PMC free article] [PubMed] [Google Scholar]
- 34.Spillantini MG, Schmidt ML, Lee VMY, Trojanowski JQ, Jakes R, Goedert M. α-synuclein in Lewy bodies. Nature. 1997;388(6645):839–840. doi: 10.1038/42166. [DOI] [PubMed] [Google Scholar]
- 35.Preece P, Cairns NJ. Quantifying mRNA in postmortem human brain: influence of gender, age at death, postmortem interval, brain pH, agonal state and inter-lobe mRNA variance. Molecular Brain Research. 2003;118(1-2):60–71. doi: 10.1016/s0169-328x(03)00337-1. [DOI] [PubMed] [Google Scholar]
- 36.Birdsill AC, Walker DG, Lue L, Sue LI, Beach TG. Postmortem interval effect on RNA and gene expression in human brain tissue. Cell and Tissue Banking. 2011;12(4):311–318. doi: 10.1007/s10561-010-9210-8. [DOI] [PMC free article] [PubMed] [Google Scholar]
- 37.Dumitriu A, Pacheco CD, Wilk JB, et al. Cyclin-G-associated kinase modifies α-synuclein expression levels and toxicity in Parkinson's disease: results from the GenePD Study. Human Molecular Genetics. 2011;20(8):1478–1487. doi: 10.1093/hmg/ddr026. [DOI] [PMC free article] [PubMed] [Google Scholar]
Associated Data
This section collects any data citations, data availability statements, or supplementary materials included in this article.
Supplementary Materials
The Supplementary Materials contain the following information: 1) a description of the neuropathological criteria used to define the Alzheimer disease variable discussed in Section 2.3 of Materials and Methods (Table 1), 2) a scatter plot of age at death and SNCA-FL expression values (after adjustment for pH, PMI, and sex) in controls, which shows a significant association (Figure 1), and 3) the scatter plots and predicted regression lines for SNCA-FL expression (after adjustment for age at death, pH, PMI, sex and disease status-PMI interaction) in PD cases and controls for the whole range of available postmortem intervals and for postmortem intervals up to 5.5 hours (Figure 2).