Abstract
The proinflammatory cytokine TNFα contributes to cell death in central nervous system (CNS) disorders by altering synaptic neurotransmission. TNFα contributes to excitotoxicity by increasing GluA2-lacking AMPA receptor (AMPAR) trafficking to the neuronal plasma membrane. In vitro, increased AMPAR on the neuronal surface after TNFα exposure is associated with a rapid internalization of GABAA receptors (GABAARs), suggesting complex timing and dose dependency of the CNS's response to TNFα. However, the effect of TNFα on GABAAR trafficking in vivo remains unclear. We assessed the effect of TNFα nanoinjection on rapid GABAAR changes in rats (N = 30) using subcellular fractionation, quantitative western blotting, and confocal microscopy. GABAAR protein levels in membrane fractions of TNFα and vehicle-treated subjects were not significantly different by Western Blot, yet high-resolution quantitative confocal imaging revealed that TNFα induces GABAAR trafficking to synapses in a dose-dependent manner by 60 min. TNFα-mediated GABAAR trafficking represents a novel target for CNS excitotoxicity.
1. Introduction
Gamma amino butyric acid type A receptors (GABAARs) are a major source of fast inhibitory synaptic transmission in the CNS and thus play a crucial role in regulating neuronal networks. Altering the number of GABAARs in a synapse through rapid receptor trafficking therefore can have a major inhibitory impact on neuronal excitability [1–3]. Trafficking of GABAARs to and from the plasma membrane has been shown to depend on neuronal activity [4–7]. GABAAR redistribution is also mediated by a variety of neuromodulatory substances such as hormones and cytokines. For example, insulin and PI3 kinase cause rapid insertion of GABAARs into the plasma membrane increasing the amplitude of miniature inhibitory postsynaptic currents (mIPSCs) [8, 9].
Tumor necrosis factor alpha (TNFα), a proinflammatory cytokine that is constitutively expressed following spinal cord injury (SCI), has been shown to alter receptor trafficking of GABAARs to and from the cell surface in vitro [10]. In vivo, TNFα levels are increased as part of the inflammatory response following SCI and various other nervous system disorders, contributing to secondary cell death [11–13]. TNFα has been shown to specifically promote trafficking of glutamate-receptor-2-(GluA2-) lacking AMPA receptors (AMPARs) to the plasma membrane of spinal neurons inducing excitotoxicity in vivo [13]. Blocking TNFα action pharmacologically reduces AMPAR trafficking and cell death after SCI, suggesting that modulation of AMPARs is a major mechanism by which TNFα promotes cell death in CNS disease [13].
The aim of the current study is to assess in vivo the effect of TNFα on GABAAR trafficking to the plasma membrane of spinal neurons. We modeled the inflammatory response associated with SCI by TNFα nanoinjection into the spinal cord to establish whether GABAARs are exocytosed onto or endocytosed from the plasma membrane. By determining the direction of trafficking, we can then infer whether trafficking of GABAARs is exacerbating or attenuating TNFα-mediated excitotoxicity. GABAARs were identified and quantified based on the presence of the gamma-2 (γ2) subunit as studies show that this subunit is critical for postsynaptic clustering of GABAARs and the vast majority of GABAARs are composed of subunits α and β combined with γ2 [14, 15]. We used a combination of biochemical fractionation and laser scanning confocal microscopy followed by iterative deconvolution and automated image analysis to evaluate GABAAR levels in the plasma membrane and at synapses after TNFα nanoinjection into the spinal parenchyma. Whole membrane fractionation and quantitative western blotting showed a trend towards increased membrane GABAAR protein levels within 60 min of TNFα nanoinjection delivery, but these results did not reach significance. Confocal data revealed increased GABAARs at synaptic sites following TNFα nanoinjection, underscoring the subcellular specificity of GABAAR localization. Confocal image findings also suggest that there is a nonlinear dose-dependent relationship between TNFα and GABAAR trafficking.
2. Materials and Methods
2.1. Animals
Female Long-Evans rats, 77- to 87-d-old, were housed in pairs (N = 30) with ad libitum access to food and water. All procedures were nonsurvival surgeries performed under deep anesthesia. All possible steps were taken to avoid unnecessary suffering. All experimental procedures followed the National Institutes of Health guidelines and were approved by the Institutional Animal Care and Use Committees at The Ohio State University and the University of California, San Francisco.
2.2. TNFα Nanoinjection
Nanoinjections (35 nl) were delivered stereotactically into the T9-10 ventral horn as described in Hermann et al., 2001, by applying compressed air micropressure to pulled glass pipettes (tip diameter, 30 μm; 30° bevel; Radnoti). An albumin injection served as a control due to its similarity in molecular weight to rat recombinant TNFα (R&D systems). For imaging experiments, subjects (n = 4) received a dose of TNFα (0.01, 0.1, or 1 μM) and an injection of albumin on the contralateral ventral horn to serve as a within-subject control. These doses of TNFα have been found sufficient to increase glutamate-mediated excitotoxicity in the spinal cord, but insufficient to cause cell death [11]. The dye FluoroRuby (Invitrogen) was included in each injection solution in order to localize injection sites for high-resolution confocal analyses (Figure 1). Subjects were sacrificed 60 minutes following nanoinjection by transcardiac perfusion with 0.9% saline followed by 4% paraformaldehyde. For biochemical experiments, subjects received four evenly spaced nanoinjections of either TNFα (1 μM) or albumin along a 750 μm length of spinal cord (TNFα, n = 8; vehicle, n = 10).
Figure 1.
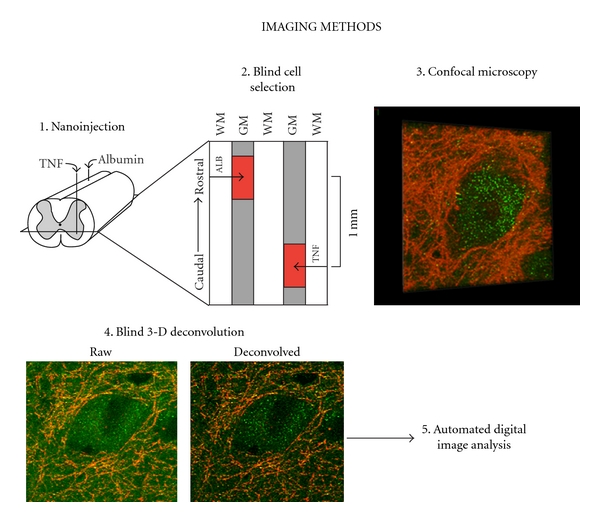
Overview of in vivo nanoinjection methods for confocal imaging experiments. (1) Subjects (n = 4) received a single TNFα injection dose (0.01, 0.1, or 1 μM) as well as a contralateral control injection of albumin. (2) Injection sites were 1 mm apart along the rostrocaudal axis. Injection sites were localized using FluoroRuby (depicted as red regions). (3) Within injection sites, large ventral motor neurons were selected under wide-field fluorescence in a blinded fashion by using the characteristic pattern of presynaptic synaptophysin outlining the plasma membrane to identify cells. (4) Confocal z-stacks were deblurred by 3D blind iterative deconvolution (AutoQuant). Panels depict a z-stack before (left) and after (right) deconvolution. (5) Custom macros designed using MetaMorph software (Molecular Devices) were used to quantify the number of fluorescently-labeled receptor puncta on the plasma membrane. WM: white matter; GM: gray matter.
2.3. Subcellular Fractionation by Centrifugation
One hour after nanoinjection, the spinal cord was extracted under deep anesthesia; 7.5 mm of the cord was snap-frozen with dry ice and stored at −80°C for later processing. Fractionation procedures were based on prior work with rat spinal cord [13]. The snap-frozen spinal cord was thawed on ice and homogenized with 30 passes of a “Type B” pestle in a Dounce homogenizer (Kontes) with 500 μL of homogenization buffer (10 mM Tris, 300 mM sucrose, Roche miniComplete protease inhibitor, pH = 7.5). The resulting suspension was then passed through a 22 gauge needle five times and centrifuged at 5,000 RCF for 5 min at 4°C. The supernatant (S1) was transferred to a new tube and centrifuged again at 13,000 RCF for 30 min at 4°C. The supernatant (S2) was transferred to a new tube, and the membrane-enriched pellet (P2) was resuspended in 50 μL of PBS containing protease inhibitor. P2 fractions were vortexed and sonicated, and all sample fractions were stored at −80°C.
2.4. Protein Assay and Immunoblotting
Sample protein concentration was assayed using BCA (Pierce) and quantified with a plate reader (Tecan; GeNios). P2 fractions from each subject were diluted 1 : 2 with cold Laemmli sample buffer containing 5% β-mercaptoethanol (BioRad), and 20 μg of protein per lane was immediately loaded onto a precast 10% Tris-HCl polyacrylamide gel (BioRad). Sample loading on the gel was performed so that each subject had their own lane, loading order was counterbalanced across injection condition to account for regional variability within the gel, and the experimenter was blind to subject condition. A kaleidoscope ladder (3 μL; BioRad) was loaded to confirm molecular weights. The loaded gel was electrophoresed in SDS running buffer (BioRad; 25 mM Tris, 192 mM glycine, 0.1% SDS, pH = 8.3) for 1 h at 100 volts. The protein was then transferred to nitrocellulose membrane in cold tris-glycine buffer (25 mM Tris, 192 mM glycine, 20% methanol, pH = 8.3). The membrane was blocked for 1 h in Odyssey blocking buffer (Li-Cor) containing 0.1% Tween 20 and then incubated overnight (18 h) in the dark at 4°C in a primary antibody solution containing Odyssey blocking buffer, 0.05% Tween 20, and a rabbit polyclonal anti- GABAA receptor γ2 primary antibody (1 : 500; Chemicon, AB5559). The membrane was washed 4 × 5 min with TBS containing 0.1% Tween 20 (TTBS) then incubated for 1 h in a fluorescently labeled secondary antibody solution containing Odyssey blocking buffer, 0.2% Tween 20, and 1 : 30,000 IRDye 680 goat anti-rabbit secondary antibody (Li-Cor) and subsequently washed 4 × 5 min in TTBS, 1 × 5 min in TBS. The membrane was immediately scanned for protein bands using the corresponding 680 nm laser at a scanning intensity of 4 on the Odyssey Infrared Imaging System (Li-Cor). The membrane was then reblocked and reincubated in a primary antibody solution containing 1 : 800 mouse anti-N-Cadherin primary antibody (BD Biosciences, 610920). The membrane was washed and reincubated in a secondary antibody solution containing 1 : 30,000 IRDye 800 goat anti-mouse secondary antibody (Li-Cor). The membrane was washed again and rescanned for protein bands in the 800 nm channel at a scanning intensity of 3.
2.5. Quantitative Fluorescence Western Blotting
Although traditional Western Blot analysis using chemiluminescence and densitometry measurements is considered to be merely semiquantitative, we used an established near-infrared labeling and detection technique (Odyssey Infrared Imaging System, Li-Cor) to definitively quantify the intensity of fluorescently labeled protein bands. To ensure that our intensity measurements were truly quantitative, we generated linear ranges for each antibody by plotting band intensity measurement relative to the concentration of protein loaded for a protein dilution curve. Laser scanning intensities for each antibody were selected by determining the laser intensity which yielded the highest linear range, R 2, of protein band fluorescent intensity from a protein dilution curve of a control sample (Figures 2(a) and 2(b)). The intensity of each fluorescently labeled protein band was quantified using the Odyssey Application Software Version 3.0 (Li-Cor). Background fluorescence was assessed and corrected for using Odyssey Software which determined median pixel densities above and below each protein band and normalized these bands of interest accordingly.
Figure 2.
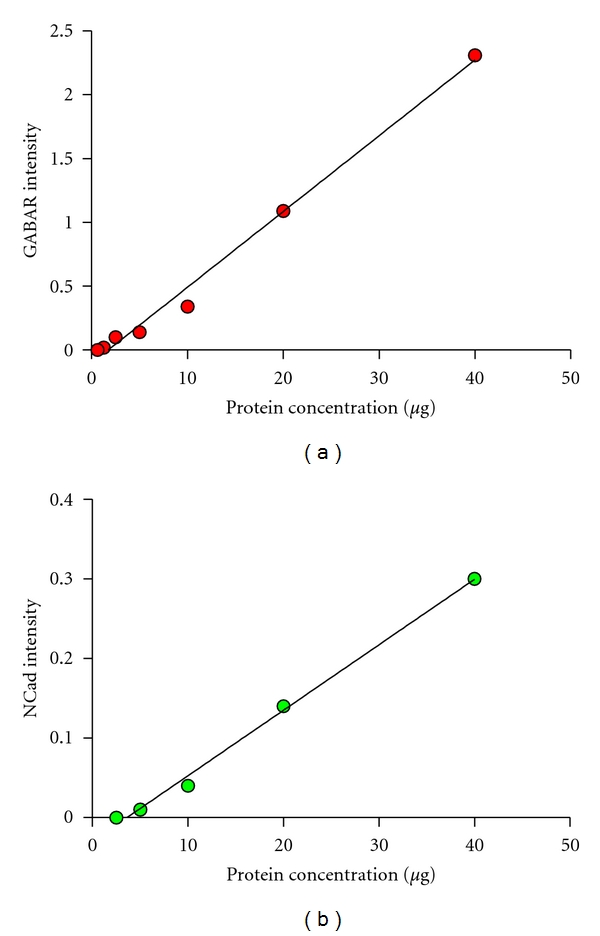
Quantitative Western Blot linear ranges for each protein. (a) GABAAR protein band fluorescent intensity corresponding to a protein dilution curve, 680 nm laser at a scanning intensity of 4 (R 2 = 0.9916). (b) NCad protein band fluorescent intensity corresponding to a protein dilution curve, 800 nm laser at a scanning intensity of 3 (R 2 = 0.9957).
Prior experiments have used the plasma membrane protein N-Cadherin (NCad) to characterize the degree of membrane enrichment in each fraction generated by spinal cord subcellular fractionation [13, 16]. In these studies, western blotting revealed that subcellular fractionation generates P2 samples with a modest enrichment of the plasma membrane as evidenced by the presence of NCad. Neither NCad (P = 0.883) nor actin (P = 0.610) intensity varied between conditions. We therefore used NCad as a control both for variability in protein loading and in plasma membrane enrichment through subcellular fractionation [16]. GABAAR band intensities from each sample were normalized with respect to NCad by dividing GABAAR intensity by NCad intensity. All biochemistry was performed in a blinded, counterbalanced fashion. Two independent replications were performed, and the normalized densitometry results were averaged across runs.
2.6. Histological Processing
The 30 mm length of spinal cord centered on the injection site was isolated and postfixed overnight (<18 h) in 4% paraformaldehyde followed by cryoprotection of the tissue in 30% sucrose for 2d. The tissue was then cut into 10 mm blocks, flash-frozen on dry ice, embedded in OCT, and sectioned into 20 μm thick horizontal slices.
2.7. Immunohistochemistry
Fixed tissue sections from a full set of experimental conditions were antibody-labeled using a high-throughput staining station (Sequenza; Thermo Scientific). Tissue was blocked and permeabilized with 5% normal goat serum and 0.3% Triton X-100 for 1 h. Sections were incubated in a solution consisting of mouse monoclonal antibody against presynaptic synaptophysin (1 : 200; Millipore MAB5258-50UG) and rabbit polyclonal antibody against GABAA receptor γ2 primary antibody (1 : 200; Chemicon, AB5559) overnight at room temperature. Slides were washed with 2 mL PBS then incubated for 1 h at room temperature in a solution containing 1 : 100 Alexa 488 goat anti-rabbit and 1 : 100 Alexa 633 goat anti-mouse secondary antibodies. After washing with 2 mL PBS, slides were coverslipped with Vectashield containing DAPI (4′, 6-diamidino-2-phenylindole; Vector Laboratories). Negative immunolabel control conditions consisted of no primary antibody, and each individual primary with the incorrect secondary. Confocal microscopy of the negative control slides showed no detectable label exceeding threshold.
2.8. Confocal Microscopy Sampling and Deconvolution
Large ventral motor neurons (characterized by a diameter >40 μm) were selected using wide-field fluorescence based on the distinctive synaptophysin outline surrounding the plasma membrane (Figure 1). One motor neuron was sampled every 100 μm following the rostrocaudal axis of each ventral horn centered around the FluoroRuby-labeled injection sites. This sampling procedure was performed through horizontal sections of the spinal cord up to 600 μm rostral and caudal to the center of each injection site. In a sampling region of multiple motor neurons, a single motor neuron was chosen at random. A Zeiss 510 META laser scanning confocal microscope (63x objective; NA = 1.4; 2x zoom) was used to generate confocal stacks for large motor neurons. Control tissue was used to optimize filter and laser settings, which were then held constant throughout the experiment. These settings allowed for virtually complete distinction between immunolabels GABAARs (Alexa 488), synaptophysin (Alexa 633), and FluoroRuby (Texas Red). Confocal z-stacks consisted of 1 μm slices which were oversampled at 0.5 μm z-intervals. AutoQuant software was used to deblur these confocal stacks through the process of 3D blind iterative deconvolution. An iteration number of 3 was determined for GABAAR labeling based on a random subset of images and held constant during the experiment. Performing deconvolution on confocal image stacks allowed for greater resolution of receptor puncta than was possible with either technique alone.
2.9. Confocal Image Analysis
Images underwent automated image analysis to quantify the number of fluorescently labeled receptor puncta on the plasma membrane exceeding a predetermined pixel threshold based on control tissue. Automated image analysis was performed using custom designed MetaMorph (Molecular Devices) macros. One macro was designed to measure the amount of total GABAAR receptor pixels (intra- and extracellular puncta) as well as colocalization of synaptophysin and GABAAR pixels (synaptically localized GABAAR puncta) in each field of the z-stack. This macro allowed for measurement of GABAAR puncta at the level of the neuropil. Another macro quantified fluorescently labeled GABAAR puncta on the plasma membrane of motor neurons. First, the macro identified the plane in the z-series with the highest amount of GABAAR/synaptophysin colocalization. A blinded researcher supervised the automated plane selection to prevent selection based on staining artifacts. Once a single plane was selected, a blinded researcher identified the plasma membrane of the motor neuron by tracing the synaptophysin-labeled outline of the cell. A 2 μm-thick “image-based subcellular fraction” was produced containing the plasma membrane of the cell from the single plane. From the plasma membrane subcellular image fraction, MetaMorph quantified GABAAR pixels (extrasynaptic receptors) and colocalized GABAAR/synaptophysin pixels (synaptic receptors).
2.10. Data Analysis
Quantitative Western Blot data were analyzed using an analysis of variance (ANOVA). Immunofluorescence data were analyzed using ANOVA, and the experiment was a mixed design (injection side and distance from injection site served as within-subject variables). When appropriate, Tukey's post hoc analyses were used to determine significant differences amongst multiple outcomes within a variable. Total GABAAR protein levels were accounted for by ANCOVA, which allowed for the distinction between receptor trafficking versus an increase in total GABAAR puncta as a result of receptor synthesis. Significance was established as P < 0.05.
3. Results
3.1. Quantitative Western Blot Detects a Nonsignificant Trend of Increased GABAAR in Total Membrane Fractions
Quantitative western blotting was used to generate normalized GABAAR intensity ratios (GABAAR : NCad) for the membrane-enriched fraction of spinal cord homogenate (Figure 3(a)). These ratios for each subject were generated by running all subjects across two counterbalanced gels. ANOVA revealed no significant difference in total membrane GABAAR between injection condition (P = 0.315), yet group means reflect a nonsignificant trend towards a higher concentration of GABAARs in TNFα-treated subjects (Figure 3(b)). A crude subcellular fractionation of samples, which in the past has been sufficient to reveal changed receptor levels from TNFα-mediated trafficking of AMPARs [13], did not show a significant distinction in GABAAR between injection conditions perhaps due to a lack of membrane resolution. Therefore, the high-resolution, low-throughput method of quantitative confocal microscopy was used to elucidate changes in localized receptor trafficking.
Figure 3.
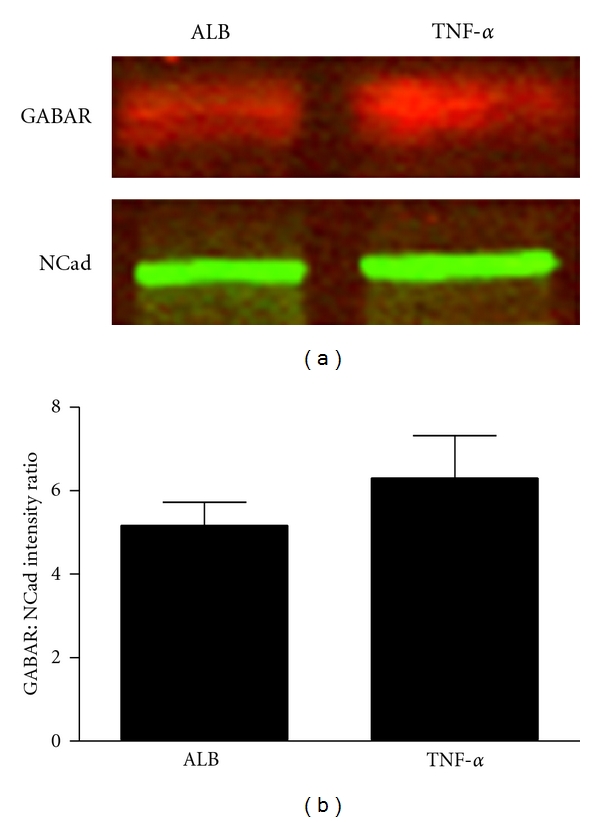
Quantitative western blotting reveals a nonsignificant trend towards an increase in plasma membrane GABAAR. (a) Representative examples of Western Blots of membrane-enriched homogenate fractions from an albumin subject and a TNFα subject that were run on the same gel. GABAAR (red) and plasma membrane protein N-Cadherin (NCad; green) bands were visualized and quantified using the Odyssey IR Imaging System (Li-Cor). (b) Linear intensity quantification of Western Blots of the P2 fraction yields a trend suggesting an increase in GABAAR : NCad ratio following TNFα injection (P = 0.315, n = 10 albumin subjects, n = 8 TNFα subjects). Bars represent group intensity means averaged across 2 Western Blots. Error bars indicate SEM.
3.2. Quantitative Confocal Microscopy Reveals That TNFα Increases Synaptic and Total GABAAR in the Neuropil
Automated image analysis of the 3-dimensional neuropil (defined as the entire set of pixels in a confocal z-stack) revealed a dose-dependent increase in synaptic GABAAR (colocalized GABAAR and synaptophysin pixels) 60 minutes following TNFα nanoinjection (P < 0.001). Total GABAAR in the neuropil increased in a dose-dependent manner (P < 0.001) as well (Figure 4). Additionally, there was a significant increase in total GABAAR puncta from the middle to the lowest TNFα dose (P < 0.02) (Figures 4(i) and 4(j)). Studies have shown that GABAARs can undergo rapid activity-dependent ubiquitination and lysosomal degradation to maintain homeostatic levels of the receptor [15, 17], which could explain the significant decrease in GABAAR associated with the middle dose of TNFα relative to the lowest dose. It is possible that the low dose of TNFα elicited a modest increase in GABAAR undetectable to regulatory systems within the neuron, whereas a middle dose of TNFα sufficiently increased GABAARs to the point where they would be downregulated.
Figure 4.
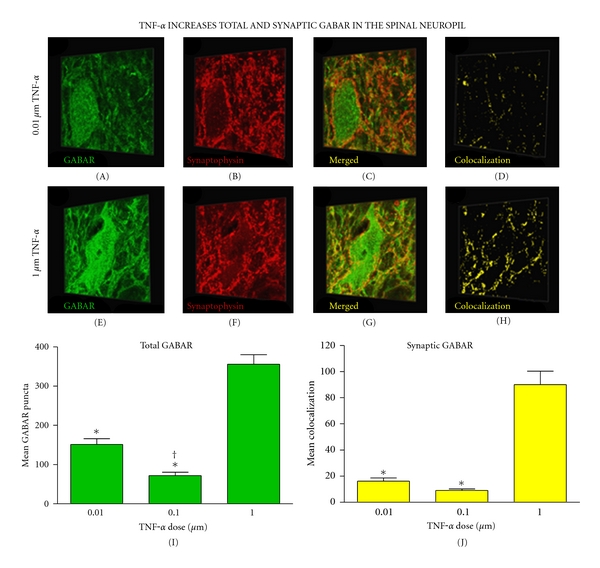
Increased synaptic GABAAR expression in the neuropil 60 min after TNFα injection. (a)–(h) Three-dimensional representative images of motor neurons demonstrating a dose-dependent increase in synaptic GABAARs in the neuropil after TNFα injection. (i) Quantification of confocal stacks shows a significant increase in total GABAARs following the highest dose of TNFα (*P < 0.001 from middle and lowest doses). An increase in total GABAARs was also observed in the lowest dose relative to the middle dose († P = 0.015). (j) An increase in synaptic GABAARs occurred following the highest dose of TNFα (*P < 0.001 from middle and lowest doses). Bars represent group means across >800 confocal image stacks (12 subjects, n = 4 subjects per group). Error bars reflect SEM. Scale bar, 30 μm.
An ANCOVA was used to statistically account for the TNFα-mediated increase in total GABAAR protein in the neuropil, thus isolating the dose-dependent changes in synaptic GABAAR attributable to receptor trafficking. After correcting for changes in total GABAAR protein, the dose-dependent effect of TNFα on synaptic GABAARs in the neuropil was robustly maintained (P < 0.001) indicating that the dose-dependent increase in synaptic GABAAR does not depend solely on wholesale protein changes but also relies on receptor trafficking to the synapse. Correcting for variance in total GABAAR protein in the neuropil with ANCOVA, revealed no significant interaction of dose by side for synaptic GABAAR (P = 0.325). Overall, results reveal that TNFα dose significantly influenced GABAAR receptor trafficking to synaptic sites within the neuropil containing spinal motor neurons.
3.3. Analysis of Confocal Microscopic Images Reveals That TNFα Increases Extrasynaptic and Synaptic GABAAR on the Plasma Membrane of Ventral Motor Neurons
Image analysis of the plasma membrane also revealed a dose-dependent increase in synaptic and extrasynaptic GABAAR 60 minutes after TNFα injection (Figures 5(g) and 5(h)) (P < 0.001). There was significantly more extrasynaptic GABAARs associated with the lowest TNFα dose relative to the middle dose (P < 0.003). After statistically correcting for TNFα-mediated changes in total GABAAR level with ANCOVA, there remained a significant dose-dependent effect of TNFα on synaptic GABAAR indicating that TNFα increases receptor trafficking to synapses on the motor neurons' somatic surface in addition to increasing extrasynaptic receptors (P < 0.05). The effect of TNFα was widespread and extended onto the contralateral side of the spinal cord (the site of vehicle injection) eliciting a dose-dependent increase in synaptic and total GABAARs at the level of the plasma membrane and the neuropil, which spanned both sides of the cord (all measures, P < 0.001). The extensive effect of TNFα on spinal tissue is also evidenced by the fact that there was no main effect of side of the cord in synaptic, nor total GABAAR measures (Figure 6) (all measures, P > 0.05). There was an interaction of dose by side for extrasynaptic GABAAR on the plasma membrane (P = 0.037), but there was not a significant interaction for any other GABAAR measures (P > 0.05) (Figure 6). Accounting for changes in total extrasynaptic GABAAR in the plasma membrane with ANCOVA showed no higher order interactions between dose and side for synaptic GABAAR (P > 0.05). Taken together, results indicate that there is a significant effect of TNFα dose that is driving GABAAR trafficking to synapses on the plasma membrane and that this effect was widespread throughout the tissue.
Figure 5.
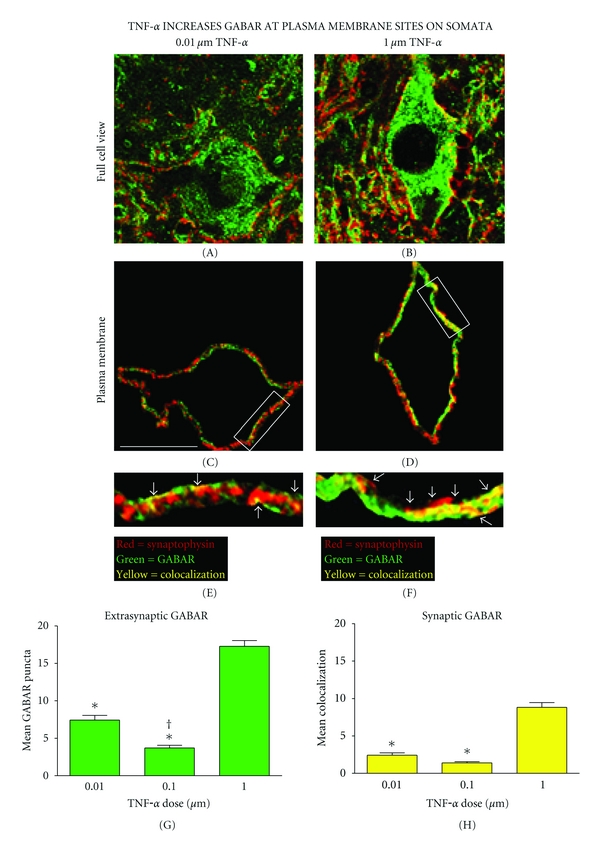
Increased GABAARs on the plasma membrane of spinal neurons after TNFα injection. ((a) and (b)) An image analysis program identified the confocal plane with the greatest colocalization of GABAAR and synaptophysin for each motor neuron. ((c) and (d)) A 2 μm wide cutout of the image containing the somatic plasma membrane. ((e) and (f)) Boxed plasma membrane fractions enlarged to demonstrate representative differences in extrasynaptic (green) and synaptic (yellow) GABAAR puncta on the plasma membrane following the highest and lowest injections of TNFα in vivo. ((g) and (h)) The highest dose of TNFα yielded a significant increase in extrasynaptic and synaptic GABAARs on the plasma membrane (extrasynaptic GABAAR *P < 0.001 from low and middle dose; synaptic GABAAR *P < 0.001 from low and middle dose). Furthermore, the lowest dose of TNFα produced a significant increase in extrasynaptic GABAARs relative to the middle dose († P = 0.002). Bars represent group means across > 800 confocal image stacks (12 subjects, n = 4 subjects per group). Error bars reflect SEM. Scale bar, 30 μm.
Figure 6.
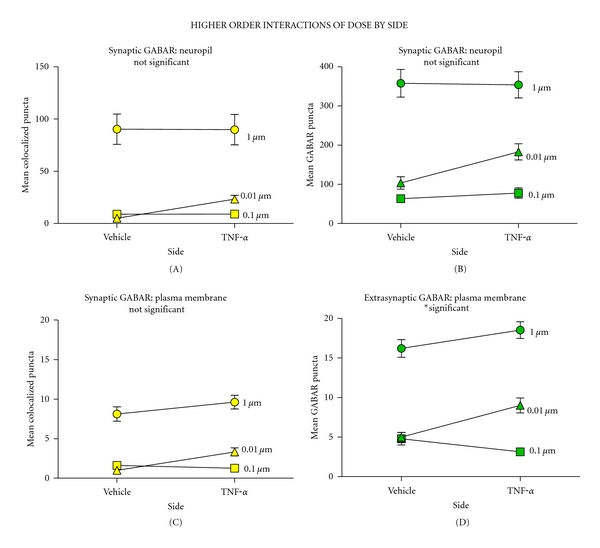
Two-way interactions of drug dose and injection side. ((a)–(d)) There was a significant effect of dose across all outcomes (P < 0.001). High doses of TNFα had a widespread effect extending onto the contralateral side of the cord such that there was no effect of injection side across any outcome (P > 0.05). ((a)–(c)) A 2-factor mixed ANOVA revealed that there was not a significant interaction between dose and side on total GABAAR on the neuropil, synaptic GABAAR on the neuropil, or plasma membrane (P > 0.05); yet there was a significant effect of interaction for extrasynaptic GABAAR on the plasma membrane ((d) P = 0.037).
4. Discussion
Our present findings suggest that there is an increase in synaptic GABAAR that occurs in spinal cord neurons in response to TNFα. TNFα nanoinjection in vivo allowed us to model rapid changes in synaptic efficacy that result from the inflammatory response following SCI. Biochemical fractionation methods that have previously been shown to be sufficient to measure rapid trafficking of the excitatory AMPA receptors [13, 16] did not appear to have sufficient resolution to detect changes in inhibitory GABAARs. However, quantitative high-resolution confocal microscopy on morphologically preserved tissue sections revealed significant changes in GABAARs 60 minutes after TNFα injection. Analysis of the total neuropil in confocal z-series revealed significant increases in GABAAR positive puncta. By statistically correcting confocal images for total GABAAR puncta, we were able to isolate the effect of TNFα on synaptic GABAAR trafficking, revealing a specific increase in synaptic GABAAR levels in the neuropil. By applying algorithmic postprocessing of confocal images, we were able to generate image-based subcellular fractionation, isolating the plasma membrane of large ventral motor neurons. Analysis of this confocal subcellular fraction revealed a U-shaped TNFα dose-response effect on GABAAR levels at both extrasynaptic and synaptic sites on the motor neuron plasma membrane.
The present results contribute to a more complete understanding of TNFα-mediated, dynamic receptor changes at synapses following the inflammatory response in SCI. TNFα tissue levels have been shown to peak 60 minutes after SCI [18]. This increase in TNFα has potential to contribute to excitotoxic cell death in the spinal cord [11]. In vivo studies have shown that TNFα causes GluA2-lacking AMPARs to be trafficked to synapses of spinal neurons [13], thereby contributing to excitotoxicity by increasing neural permeability to Ca++. Inhibitory synaptic strength is directly correlated to the number of synaptic GABAARs, thus any mechanism that controls the quantity of synaptic GABAARs can have a profound effect on neuronal excitability [1–3]. Given this, our study suggests that GABAAR trafficking to the synapse may serve as a homeostatic mechanism that combats the excitotoxic effect of TNFα following SCI in vivo. An increase in extrasynaptic GABAAR as well as total GABAAR is consistent with research showing that GABAAR are first exocytosed onto the plasma membrane before trafficking laterally to synapses [7, 19]. An upregulation of extrasynaptic GABAAR may be necessary in order to ensure a sufficient availability of GABAARs for trafficking to synaptic sites. Increased GABAAR synthesis may occur in this system to meet the demands placed on intracellular receptor stores imposed by trafficking.
An unexpected finding was that extrasynaptic and total GABAARs decreased following the middle dose of TNFα. This phenomenon could be due to a compensatory homeostatic degradation of GABAAR at the middle TNFα dose. At a low dose, GABAAR synthesis could increase to maintain cellular reserves of the receptor for trafficking to the membrane, yet an increase in GABAAR at a low dose could be slight enough to go undetected by regulatory mechanisms that would otherwise decrease GABAAR accumulation [15, 17]. However, at the medium TNFα dose, GABAAR synthesis could increase to a level that would elicit a rapid homeostatic degradation or ubiquitination of these receptors so that there is a drop in total GABAAR protein following the middle dose. A large and rapid GABAAR accumulation following a high dose of TNFα could conceivably overwhelm homeostatic compensatory degradation of GABAAR resulting in a global increase in the protein.
Results also showed that at high doses of TNFα, there was a widespread effect of synaptic and total GABAAR protein that extended onto the contralateral side of the spinal cord into the region of albumin nanoinjection, as previously reported for AMPAR receptor trafficking effects [13]. At a high dose, there was not a significant difference between GABAAR measures on the TNFα-injected side and the contralateral albumin side. Yet, at lower doses, TNFα does not influence GABAAR measures at the site of albumin injection. Our results demonstrate that the TNFα-affected area increases with the size of the dose. This result could be explained by evidence that TNFα promotes a heightened inflammatory response, which causes an increase in glial activation leading to the release of a variety of inflammatory cytokines including TNFα [20–22]. Therefore, higher doses of TNFα could elicit a greater immune response leading to further release of TNFα through a positive feedback loop, which has been demonstrated in vitro [23, 24]. Additionally, at higher doses, TNFα elicits a higher excitatory effect in the neural circuitry at the injection site that could be transmitted across the midline of the spinal cord by commissural fibers [25, 26]. Higher doses of TNFα also are known to elicit a greater localized excitation which is propagated further relative to lower doses of TNFα [13]. Our results suggest that GABAAR trafficking may counteract this TNFα-induced excitotoxicity, so increasing the radius of excitation would likewise increase the tissue area affected by GABAAR trafficking.
At first glance, our results seem to contradict the in vitro findings of Stellwagen et al. that TNFα decreases surface GABAARs through endocytosis while simultaneously increasing surface GluA2-lacking AMPARs [10]. Taken together with our prior publications, we have now found in vivo that GABAARs and AMPARs are both trafficked to the membrane after TNF nanoinjection (Figures 4–6) [13]. Although we found an increase in synaptic GABAAR following the highest TNFα dose, our experiment also showed that TNFα elicited a nonlinear dose-response effect on GABAAR levels (total GABAAR in neuropil and extrasynaptic GABAAR). An interesting finding was that the middle dose of TNFα used in our study elicited a lower amount of total GABAAR relative to our highest and lowest drug doses (Figure 7). This complex, nonlinear dose-dependent relationship of TNFα on GABAAR trafficking, actually replicates the finding of Stellwagen et al. when examined in the context of the study by Ferguson et al. [13], which demonstrated that, at 0.1 μM TNFα, the very same intermediate dose used in our experiment, there was an increase in extrasynaptic GluA1 coinciding with our decrease in GABAAR (Figure 7). Our experiment expands upon these in vitro findings, recontextualizing them in vivo and revealing a potentially nonlinear dependence of GABAAR trafficking on TNFα. An in vivo account of TNFα-mediated GABAAR trafficking simulates the microenvironmental tissue changes following injury. While cell culture enables greater control over experimental variables and outcomes, a limitation of in vitro studies is their inability to replicate the compensatory homeostatic mechanisms present in a whole organism. In analyzing the effect of a range of TNFα doses on GABAAR trafficking, we can glean time-emergent effects following injury since TNFα is constitutively expressed following SCI [18]. Thus, there appear to be both dose and time components to TNFα receptor trafficking in vivo.
Figure 7.
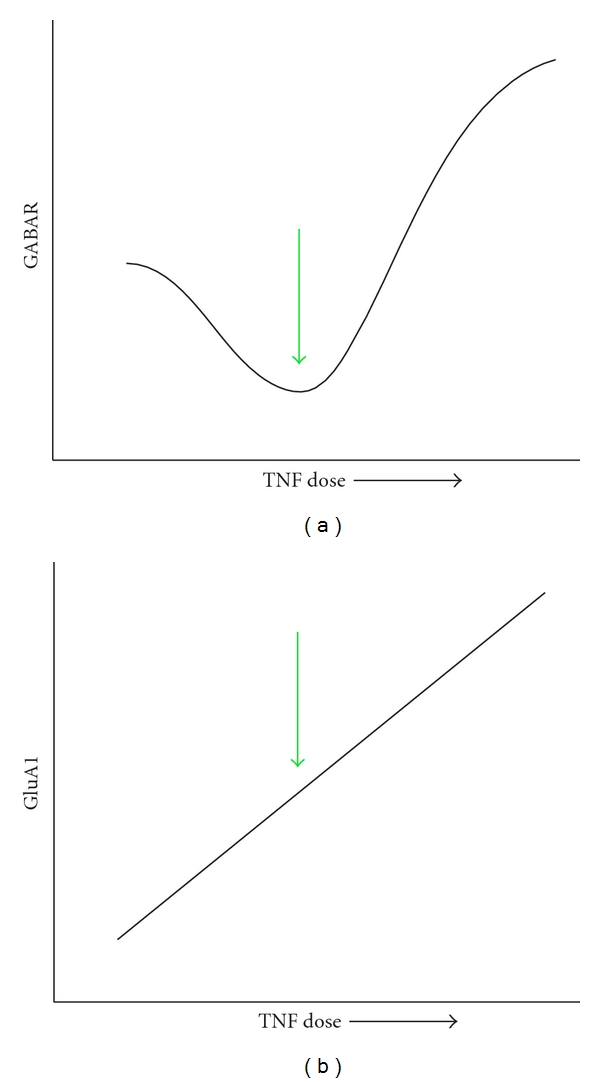
Graphical representation of combined findings from current research, Ferguson et al., 2008 [13], and Stellwagen et al., 2005 [10]. (a) Depiction of current findings that TNF causes a U-shaped response in total GABAAR in vivo. (b) Representation of findings from Ferguson et al. [13]that TNF causes an increase in total GluA1 in vivo. Green arrows represent the findings of Stellwagen et al., 2005 [10] that a particular dose of TNF elicits an increase in GluA1 and a decrease in GABAAR in vitro.
Further studies are necessary in order to corroborate our current findings and determine their functional consequences. It has been shown that mIPSC strength is directly correlated with the number of postsynaptic GABAARs indicating that trafficking receptors to the synapse greatly affects neuronal excitability [15]. Electrophysiological studies are critical in order to determine whether TNFα-mediated GABAAR trafficking translates into differences in synaptic current transmission. Aside from GABAAR trafficking, other modulatory mechanisms regulate receptor functionality and distribution including changes in GABAAR phosphorylation, half-life, ubiquitination, lysosomal degradation, and interactions with other glutamate receptor subtypes such as the NMDA receptor [6, 7, 17, 27, 28]. An additional physiological variable to consider is that, under certain conditions, GABAergic synapses can be excitatory. GABAARs are permeable to both Cl− and HCO3− and these currents have reversal potentials (EGABA) close to the neuronal resting potential. Physiological conditions that cause the membrane potential to become more negative than EGABA reverse the direction of ion flow through GABAARs [29]. For example, a heightened level of neuronal activity has been shown to transiently alter EGABA in hippocampal CA1 pyramidal cells in vitro. GABAergic synapses become depolarizing after a high-frequency train of stimulation causing an accumulation of Cl− inside the cell and high K+ outside, in the interstitial fluid [30, 31]. In the spinal cord, excitatory effects of GABAARs have been implicated in pathological pain conditions and maladaptive spinal plasticity [32–34]. In light of these caveats, it is essential to determine the electrophysiological consequences of TNFα-mediated GABAAR trafficking. A better understanding of the link between TNFα-induced synaptic GABAAR trafficking and neural excitability is a clear target for further research that may lead to a novel therapeutic target for combating the spread of excitotoxicity after SCI and other CNS diseases.
Acknowledgments
The authors would like to thank Rochelle J. Deibert for help with surgeries and optimizing GABAAR staining, Stephanie Beattie for supervising confocal artifact-detection algorithms, and John Komon for help with illustrations. This work was supported by NS069537, NS067092, NS038079, and AG032518.
References
- 1.Nusser Z, Cull-Candy S, Farrant M. Differences in synaptic GABAA receptor number underlie variation in GABA mini amplitude. Neuron. 1997;19(3):697–709. doi: 10.1016/s0896-6273(00)80382-7. [DOI] [PubMed] [Google Scholar]
- 2.Otis TS, De Koninck Y, Mody I. Lasting potentiation of inhibition is associated with an increased number of γ-aminobutyric acid type A receptors activated during miniature inhibitory postsynaptic currents. Proceedings of the National Academy of Sciences of the United States of America. 1994;91(16):7698–7702. doi: 10.1073/pnas.91.16.7698. [DOI] [PMC free article] [PubMed] [Google Scholar]
- 3.Fenselau H, Heinke B, Sandkühler J. Heterosynaptic long-term potentiation at GABAergic synapses of spinal lamina I neurons. Journal of Neuroscience. 2011;31(48):17383–17391. doi: 10.1523/JNEUROSCI.3076-11.2011. [DOI] [PMC free article] [PubMed] [Google Scholar]
- 4.Kilman V, Van Rossum MCW, Turrigiano GG. Activity deprivation reduces miniature IPSC amplitude by decreasing the number of postsynaptic GABAA receptors clustered at neocortical synapses. Journal of Neuroscience. 2002;22(4):1328–1337. doi: 10.1523/JNEUROSCI.22-04-01328.2002. [DOI] [PMC free article] [PubMed] [Google Scholar]
- 5.Hartman KN, Pal SK, Burrone J, Murthy VN. Activity-dependent regulation of inhibitory synaptic transmission in hippocampal neurons. Nature Neuroscience. 2006;9(5):642–649. doi: 10.1038/nn1677. [DOI] [PubMed] [Google Scholar]
- 6.Saliba RS, Michels G, Jacob TC, Pangalos MN, Moss SJ. Activity-dependent ubiquitination of GABAA receptors regulates their accumulation at synaptic sites. Journal of Neuroscience. 2007;27(48):13341–13351. doi: 10.1523/JNEUROSCI.3277-07.2007. [DOI] [PMC free article] [PubMed] [Google Scholar]
- 7.Marsden KC, Beattie JB, Friedenthal J, Carroll RC. NMDA receptor activation potentiates inhibitory transmission through GABA receptor-associated protein-dependent exocytosis of GABAA receptors. Journal of Neuroscience. 2007;27(52):14326–14337. doi: 10.1523/JNEUROSCI.4433-07.2007. [DOI] [PMC free article] [PubMed] [Google Scholar]
- 8.Wan Q, Xiong ZG, Man HY, et al. Recruitment of functional GABAA receptors to postsynaptic domains by insulin. Nature. 1997;388(6643):686–690. doi: 10.1038/41792. [DOI] [PubMed] [Google Scholar]
- 9.Wang Q, Liu L, Pei L, et al. Control of synaptic strength, a novel function of Akt. Neuron. 2003;38(6):915–928. doi: 10.1016/s0896-6273(03)00356-8. [DOI] [PubMed] [Google Scholar]
- 10.Stellwagen D, Beattie EC, Seo JY, Malenka RC. Differential regulation of AMPA receptor and GABA receptor trafficking by tumor necrosis factor-α . Journal of Neuroscience. 2005;25(12):3219–3228. doi: 10.1523/JNEUROSCI.4486-04.2005. [DOI] [PMC free article] [PubMed] [Google Scholar]
- 11.Hermann GE, Rogers RC, Bresnahan JC, Beattie MS. Tumor necrosis factor-α induces cFOS and strongly potentiates glutamate-mediated cell death in the rat spinal cord. Neurobiology of Disease. 2001;8(4):590–599. doi: 10.1006/nbdi.2001.0414. [DOI] [PubMed] [Google Scholar]
- 12.Beattie MS, Hermann GE, Rogers RC, Bresnahan JC. Cell death in models of spinal cord injury. Progress in Brain Research. 2002;137:37–47. doi: 10.1016/s0079-6123(02)37006-7. [DOI] [PubMed] [Google Scholar]
- 13.Ferguson AR, Christensen RN, Gensel JC, et al. Cell death after spinal cord injury is exacerbated by rapid TNFα-induced trafficking of GluR2-lacking AMPARs to the plasma membrane. Journal of Neuroscience. 2008;28(44):11391–11400. doi: 10.1523/JNEUROSCI.3708-08.2008. [DOI] [PMC free article] [PubMed] [Google Scholar]
- 14.Essrich C, Lorez M, Benson JA, Fritschy J-M, Lüscher B. Postsynaptic clustering of major GABAA receptor subtypes requires the γ2 subunit and gephyrin. Nature Neuroscience. 1998;1(7):563–571. doi: 10.1038/2798. [DOI] [PubMed] [Google Scholar]
- 15.Luscher B, Keller CA. Regulation of GABAA receptor trafficking, channel activity, and functional plasticity of inhibitory synapses. Pharmacology and Therapeutics. 2004;102(3):195–221. doi: 10.1016/j.pharmthera.2004.04.003. [DOI] [PubMed] [Google Scholar]
- 16.Galan A, Laird JMA, Cervero F. In vivo recruitment by painful stimuli of AMPA receptor subunits to the plasma membrane of spinal cord neurons. Pain. 2004;112(3):315–323. doi: 10.1016/j.pain.2004.09.011. [DOI] [PubMed] [Google Scholar]
- 17.Kittler JT, Moss SJ. Modulation of GABAA receptor activity by phosphorylation and receptor trafficking: implications for the efficacy of synaptic inhibition. Current Opinion in Neurobiology. 2003;13(3):341–347. doi: 10.1016/s0959-4388(03)00064-3. [DOI] [PubMed] [Google Scholar]
- 18.Wang CX, Nuttin B, Heremans H, Dom R, Gybels J. Production of tumor necrosis factor in spinal cord following traumatic injury in rats. Journal of Neuroimmunology. 1996;69(1-2):151–156. doi: 10.1016/0165-5728(96)00080-x. [DOI] [PubMed] [Google Scholar]
- 19.Triller A, Choquet D. Surface trafficking of receptors between synaptic and extrasynaptic membranes: and yet they do move! Trends in Neurosciences. 2005;28(3):133–139. doi: 10.1016/j.tins.2005.01.001. [DOI] [PubMed] [Google Scholar]
- 20.Bethea JR, Dietrich WD. Targeting the host inflammatory response in traumatic spinal cord injury. Current Opinion in Neurology. 2002;15(3):355–360. doi: 10.1097/00019052-200206000-00021. [DOI] [PubMed] [Google Scholar]
- 21.Watkins LR, Milligan ED, Maier SF. Glial activation: a driving force for pathological pain. Trends in Neurosciences. 2001;24(8):450–455. doi: 10.1016/s0166-2236(00)01854-3. [DOI] [PubMed] [Google Scholar]
- 22.Benveniste EN. Inflammatory cytokines within the central nervous system: sources, function, and mechanism of action. American Journal of Physiology, Cell Physiology. 1992;263(1):C1–C16. doi: 10.1152/ajpcell.1992.263.1.C1. [DOI] [PubMed] [Google Scholar]
- 23.Kuno R, Wang J, Kawanokuchi J, Takeuchi H, Mizuno T, Suzumura A. Autocrine activation of microglia by tumor necrosis factor-α . Journal of Neuroimmunology. 2005;162(1-2):89–96. doi: 10.1016/j.jneuroim.2005.01.015. [DOI] [PubMed] [Google Scholar]
- 24.Yarilina A, Park-Min KH, Antoniv T, Hu X, Ivashkiv LB. TNF activates an IRF1-dependent autocrine loop leading to sustained expression of chemokines and STAT1-dependent type I interferon-response genes. Nature Immunology. 2008;9(4):378–387. doi: 10.1038/ni1576. [DOI] [PubMed] [Google Scholar]
- 25.Kiehn O. Locomotor circuits in the mammalian spinal cord. Annual Review of Neuroscience. 2006;29:279–306. doi: 10.1146/annurev.neuro.29.051605.112910. [DOI] [PubMed] [Google Scholar]
- 26.Kiehn O, Butt SJB. Physiological, anatomical and genetic identification of CPG neurons in the developing mammalian spinal cord. Progress in Neurobiology. 2003;70(4):347–361. doi: 10.1016/s0301-0082(03)00091-1. [DOI] [PubMed] [Google Scholar]
- 27.Collingridge GL, Isaac JTR, Yu TW. Receptor trafficking and synaptic plasticity. Nature Reviews Neuroscience. 2004;5(12):952–962. doi: 10.1038/nrn1556. [DOI] [PubMed] [Google Scholar]
- 28.Mabb AM, Ehlers MD. Ubiquitination in postsynaptic function and plasticity. Annual Review of Cell and Developmental Biology. 2010;26:179–210. doi: 10.1146/annurev-cellbio-100109-104129. [DOI] [PMC free article] [PubMed] [Google Scholar]
- 29.Marty A, Llano I. Excitatory effects of GABA in established brain networks. Trends in Neurosciences. 2005;28(6):284–289. doi: 10.1016/j.tins.2005.04.003. [DOI] [PubMed] [Google Scholar]
- 30.Voipio J, Kaila K. GABAergic excitation and K(+)-mediated volume transmission in the hippocampus. Progress in Brain Research. 2000;125:329–338. doi: 10.1016/S0079-6123(00)25022-X. [DOI] [PubMed] [Google Scholar]
- 31.Isomura Y, Sugimoto M, Fujiwara-Tsukamoto Y, Yamamoto-Muraki S, Yamada J, Fukuda A. Synaptically activated Cl- accumulation responsible for depolarizing GABAergic responses in mature hippocampal neurons. Journal of Neurophysiology. 2003;90(4):2752–2756. doi: 10.1152/jn.00142.2003. [DOI] [PubMed] [Google Scholar]
- 32.Sluka KA, Willis WD, Westlund KN. Inflammation-induced release of excitatory amino acids is prevented by spinal administration of a GABAA but not by a GABAA receptor antagonist in rats. Journal of Pharmacology and Experimental Therapeutics. 1994;271(1):76–82. [PubMed] [Google Scholar]
- 33.Sluka KA, Willis WD, Westlund KN. Joint inflammation and hyperalgesia are reduced by spinal bicuculline. NeuroReport. 1993;5(2):109–112. doi: 10.1097/00001756-199311180-00003. [DOI] [PubMed] [Google Scholar]
- 34.Ferguson AR, Washburn SN, Crown ED, Grau JW. GABAA receptor activation is involved in noncontingent shock inhibition of instrumental conditioning in spinal rats. Behavioral Neuroscience. 2003;117(4):799–812. doi: 10.1037/0735-7044.117.4.799. [DOI] [PubMed] [Google Scholar]


