

Abstract
Ty1, the most abundant retrotransposon in Saccharomyces cerevisiae, integrates preferentially upstream of genes transcribed by RNA polymerase III (Pol III). Targeting is likely due to interactions between the Ty1 integration complex and a feature of chromatin characteristic of sites of Pol III transcription. To better understand Ty1 targeting determinants, >150,000 Ty1 insertions were mapped onto the S. cerevisiae genome sequence. Logistic regression was used to assess relationships between patterns of Ty1 integration and various genomic features, including genome-wide data sets of histone modifications and transcription-factor binding sites. Nucleosomes were positively associated with Ty1 insertions, and fine-scale mapping of insertions upstream of genes transcribed by Pol III indicated that Ty1 preferentially integrates into nucleosome-bound DNA near the H2A/H2B interface. Outside of genes transcribed by Pol III, Ty1 avoids coding sequences, a pattern that is not due to selection, but rather reflects a preference for nucleosome-rich sites flanking genes. Ty1 insertion sites were also mapped in four mutant lines that affect Ty1 transposition frequency or integration specificity (rrm3Δ, hos2Δ, rtt109Δ, and rad6Δ). Patterns of integration were largely preserved in the mutants, although significantly more insertions into coding sequences were observed in the rad6Δ strain, suggesting a loosening of target specificity in this mutant that lacks an enzyme involved in ubiquitinating H2A. Overall, our data suggest that nucleosomes are necessary for Ty1 integration, and that a secondary factor, likely a histone modification or nucleosome-bound factor enriched at sites of Pol III transcription, determines preferred target sites.
In most eukaryotes, retrotransposons constitute a large fraction of the genetic material, comprising, for example, up to half of the human genome (Goodier and Kazazian 2008). Retrotransposons attain such high copy numbers by reverse transcribing their mRNA into cDNA, which becomes inserted into new genomic sites through the action of the retrotransposon-encoded integrase (IN) protein (Beauregard et al. 2008). cDNA integration has genetic consequences for the host: It can create mutations, and genome rearrangements; and deletions can result due to recombination between repetitive retrotransposon sequences scattered throughout the genome. In addition to genetic consequences of transposition, retrotransposons are often epigenetically modified and define distinct chromatin domains (Slotkin and Martienssen 2007). The combined genetic and epigenetic consequences of retrotransposition on host genomes are significant, and this impact is determined by the final step in retrotransposition, namely, the choice of where cDNA inserts into the genome.
Recent work suggests that retrotransposons identify genomic integration sites through a conserved mechanism: IN interacts with a specific DNA-bound protein, and this tethers the integration complex to specific genomic sites, resulting in target-site biases (Bushman 2003). Examples of retrotransposons that recognize chromatin during integration include the Schizosaccharomyces pombe Tf1 retrotransposon and the S. cerevisiae Ty3 retrotransposon, which integrate upstream of genes transcribed by RNA polymerases II and III (Pol II, Pol III), respectively (Chalker and Sandmeyer 1992; Bowen et al. 2003). In both cases, transcription of target genes and localization of proteins associated with transcription are required for target-site choice (Yieh et al. 2000, 2002; Leem et al. 2008; Majumdar et al. 2010). For the S. cerevisiae Ty5 retrotransposon, a six amino acid motif at the C terminus of Ty5 IN binds the heterochromatin protein Sir4, resulting in integration into heterochromatin (Xie et al. 2001; Zhu et al. 2003). Retroviruses also recognize chromatin during integration. HIV IN, for example, interacts with the transcription factor lens epithelium-derived growth factor (LEDGF), and this underlies HIV's preference to integrate into actively transcribed genes (Cherepanov et al. 2003; Ciuffi et al. 2005).
Although the yeast retrotransposon Ty1 is among the most-studied mobile genetic element, the molecular mechanism underlying its target-site choice remains elusive. Ty1 preferentially integrates upstream of genes transcribed by RNA Pol III (class III genes), including tRNA genes and 5S rRNA genes (Ji et al. 1993; Devine and Boeke 1996). Targeting occurs within an ∼750-bp window upstream of Pol III transcription start sites, and consistent with a chromatin tethering mechanism, targeting depends on the presence of the Pol III transcription complex.
Previous analyses of Ty1 target specificity monitored insertion patterns on a single chromosome (chr III) (Ji et al. 1993) or at a small number of known Ty1 targets (e.g., a subset of class III genes) (Bachman et al. 2004). A drawback to these studies is that analyses were restricted to a fraction of the genome, and the methods used to recover insertions made it difficult to obtain large numbers of independent insertions (32 on chr III; 836 at class III genes) (Ji et al. 1993; Bachman et al. 2004). To overcome these limitations, we applied linker-mediated PCR and high-throughput sequencing to conduct a genome-wide survey of Ty1 integration patterns. We also took advantage of the wealth of genome-wide data sets for S. cerevisiae, and used machine learning (specifically logistic regression) to identify chromosomal features (e.g., histone modifications or specific transcription factors) associated with Ty1 insertion sites. Our analyses revealed that a specific surface of nucleosomes upstream of class III genes is a critical Ty1 targeting determinant, suggesting that histone modifications or proteins associated with nucleosomes upstream of class III genes are recognized by Ty1 IN and underlie this retrotransposon's target site bias.
Results
Generating, recovering, and mapping Ty1 insertions
Ty1 integration events were generated using a modified version of the well-studied pGTy1his3AI element (called pGTy1his3AI-SCUF) (Curcio and Garfinkel 1991). The 5′ LTR of pGTy1his3AI-SCUF contains six nucleotide substitutions in the U5 region downstream from the initiation codon of the GAG ORF. Nucleotide changes were introduced so as not to alter the GAG amino acid sequence, and pGTy1his3AI-SCUF was found to transpose at frequencies comparable to the unmodified element (data not shown). The 6-nt sequence tag is copied into the 3′ LTR by reverse transcription, making it possible to distinguish the 3′ LTR/genomic DNA junction of de novo Ty1 insertions from the 3′ LTR/genomic DNA junction of pre-existing Ty1 elements in the genome. Reverse transcription of a spliced Ty1his3AI transcript produces a functional HIS3 gene, which, when incorporated in the yeast genome, confers histidine prototrophy (Curcio and Garfinkel 1991). His+ insertion events were recovered from three wild-type strains (YPH499, haploid a mating type; YPH501, diploid; BY4741, a derivative of YPH499 used for the genome-wide deletion project) and four mutant strains in the BY4741 background that affect Ty1 insertion frequency (rrm3Δ, hos2Δ, and rtt109Δ) or pattern (rad6Δ) (Supplemental Table 1). For each yeast strain tested, transposition was induced in 10–14 independent cultures, and ∼10,000 His+ colonies resulting from each induction were pooled. Genomic DNA was purified and digested with either AciI or TaqI. Linkers were annealed to the ends of the digested DNA, and 3′ Ty1/genomic DNA junction fragments were amplified by PCR. PCR primers were specific to the linker and sequence modifications in the pGTy1his3AI-SCUF LTR. The primers had different DNA barcodes to distinguish between yeast strains and restriction enzyme digestions. All PCR products were pooled and sequenced by 454 Life Sciences (Roche) pyrosequencing.
A single 454 run produced between 13,000 and 111,000 sequence reads per pool (Table 1). The data were processed using a pipeline to identify those sequences with a perfect match to the terminus of the Ty1 LTR and a 98% match to genomic DNA, beginning within 3 bp of the end of the LTR. Approximately 89% of the sequence reads passed these filters; insertions at a given position and orientation were counted once in each pool. The sequences were then mapped to the genome via BLAT (Kent 2002), and alignment revealed two distinct sequence categories: ∼85% of the reads mapped unambiguously to unique sites in the genome; the remainder mapped to multiple positions. The majority of ambiguous hits were within endogenous Ty LTRs (see also below). It was possible to use the ambiguous hits in subsequent analyses by down-weighting each hit proportionally to the number of sites it mapped to in the genome. These normalized data were used principally to confirm and validate conclusions drawn from the unambiguous insertion data set.
Table 1.
Insertions recovered

Genomic distribution of Ty1 insertions in wild-type strains
Ty1 insertions mapped to all 16 chromosomes in a punctuate pattern, characterized by clusters of insertions upstream of class III genes (Fig. 1; Supplemental Fig. 1). In addition, a small number of insertions were distributed throughout the genome. Pairwise comparisons between the diploid and two haploid strains failed to reveal a significant difference in the distribution of insertions (pairwise Pearson correlations for YPH499 vs. YPH501 = [.92, 0.93]). We conclude, therefore, that ploidy does not significantly influence targeting patterns. Variation in insertion patterns, however, was observed between YPH499 and BY4741. In particular, the tE(UUC)C and tI(AAU)L1 loci received few to no insertions in BY4741, suggesting that these genes are missing in this strain.
Figure 1.

Distribution of Ty1 insertions on chr 3. The x axis denotes position along the chromosome at 1 kb resolution. (Black bars) Number of unambiguous insertions at a particular site. (Stacked green bars) Ambiguous insertions. Colored bars below the x axis indicate positions of class III genes. (Blue) Genes transcribed from left to right. (Red) Genes transcribed in the opposite direction.
Ty1 insertions were under-represented in open reading frames (ORFs): Only 4.86% of insertions occurred in verified ORFs in haploid cells, whereas random insertion would result in ∼60% of insertions in verified ORFs (P < 2.2 × 10⁻¹⁶). In the diploid strain, 5.02% of insertions occurred in ORFs, which does not differ significantly from the haploid (P = 0.59). As such, we conclude that selection does not have a significant effect on the genomic distribution of Ty1 insertions.
We further analyzed the distribution of Ty1 insertions with respect to class III genes, which include 275 tRNA genes SNR6, RPR1, SCR1, SNR52, RNA170, ZOD1, and 100–200 tandem copies of RDN5 (Harismendy et al. 2003; Roberts et al. 2003). Whereas the 2000 bp upstream of all class III genes constitute <5% of the genome, those regions received 90% of the total Ty1 insertions. However, not all class III genes were equally targeted (Fig. 2). A number of class III genes received zero insertions in all six independent experiments with wild-type strains, whereas other sites received as many as 561 insertions. Comparisons between the number of insertions at each class III gene and the appropriate random distribution (binomial: n = 27382, P = 1/288) indicates that Ty1 clearly prefers certain class III genes over others. This preference was consistent between yeast strains, with the YPH501 and YPH499 being more similar to each other than to BY4741 (pairwise Pearson correlations: YPH501/YPH499 = [.95, 0.97], BY4741/YPH499 = [0.84, .92], BY4741/YPH501 = [0.83, .92] at 99.9% confidence). The differences between YPH501/YPH499 and BY4741 appeared to be spread across all class III genes, with the exception of the tE(UUC)C and tI(AAU)L1 loci, as previously noted. We also correlated our BY4741 data with the results of Bachman et al. (2004) in terms of preference for specific class III gene targets (Spearman rho = 0.43, P = 0.012). While the correlation was relatively poor, it was reasonable given differences in methodology.
Figure 2.

Histogram of Ty1 insertion frequency per class III gene. The x axis depicts the number of Ty1 insertions within a 2-kb window upstream of each class III gene in the S. cerevisiae genome. Values on the y axis indicate the number of class III genes with a given number of insertions. The curve denotes the pattern expected for random selection of class III gene targets.
Ty1 insertion at class III genes
Transcription of class III genes is required for targeted integration by Ty1 (Devine and Boeke 1996), and this motivated investigation into the relationship between targeting patterns and Pol III occupancy at various class III genes. Two tRNA genes, tT(UGU)H and tP(AAG)C, have high levels of TFIIIB occupancy, but low levels of Pol III (due to a premature termination signal and a suboptimal initiation site sequence, respectively) (Soragni and Kassavetis 2008). These two sites received disparate levels of insertion: tT(UGU)H received at least 14 times more insertions than tP(AAG)C. SNR6 has reduced levels of TFIIIB and TFIIIC binding relative to tRNA genes, but a similar ratio of TFIIIC/B to Pol III as seen at most tRNA genes (Soragni and Kassavetis 2008). Despite the modest reduction in Pol III transcription complexes, SNR6 was a relatively hot target (156 insertions). On the other hand, the ZOD1 locus has abnormally high levels of TFIIIC, modestly reduced levels of TFIIIB, and little Pol III (Soragni and Kassavetis 2008). ZOD1 was devoid of insertions, suggesting that a basal level of Pol III occupancy is important for targeting. The S. cerevisiae genome contains eight loci called Extra TFIIIC (ETC) sites (ETC1-8) (Moqtaderi and Struhl 2004) that bind TFIIIC but not TFIIIB or Pol III (Simms et al. 2008). All ETC sites received no insertions. We conclude, therefore, that while some subunits of Pol III transcription-factor complexes discriminate targets from nontargets, none are significantly correlated with Ty1 insertion frequency. This suggests that while these particular subunits of Pol III are associated with target sites, they are not the primary targeting determinants. One conclusion, however, is clear: TFIIIC by itself, and probably TFIIIC and TFIIIB together, are not sufficient to direct Ty1 insertion.
Logistic regression to identify Ty1 targeting determinants
We were interested in a further understanding of the features important for targeting to class III genes as well as to sites elsewhere in the genome. Because numerous genomic features could affect Ty1 insertion patterns, we applied logistic regression to identify those features associated with Ty1's preferred target sites. The feature data set was extensive and included genome-wide information on nucleosome position, histone modifications, and transcription-factor occupancy (Supplemental Table 2). Our analysis treated each base pair in the genome as a potential insertion site and attempted to tell the difference between those with and without insertions. The quality of the models was evaluated using the area under the Receiver Operating characteristic Curve (AUC of the ROC curve) (Bradley 1996). We also trained our models on individual class III genes to identify features that distinguish hot and cold gene targets. These models, however, only generated a subset of features with AUCs of low magnitude, implying that the identified features are not essential for distinguishing class III gene targets (data not shown).
Logistic regression using the genome-wide data sets identified a small set of features associated with Ty1 insertions (Fig. 3). As expected, these features included the region upstream of tRNA genes, which was almost perfectly predictive of a nucleotide that hosts insertions. Ty1 also preferred sites with H3K14 acetylation, the histone variant H2AZ, pre-existing Ty LTRs, nucleosomes (predicted by hidden Markov modeling), and regulatory regions of genes transcribed by Pol II. Ty1 insertions avoided verified ORFs. The AUCs were stable regardless of whether one or two insertions were used as the minimum to define an insertion site. In the following sections we address in greater detail the genome-wide determinants of Ty1 targeting as informed by the logistic regression model.
Figure 3.
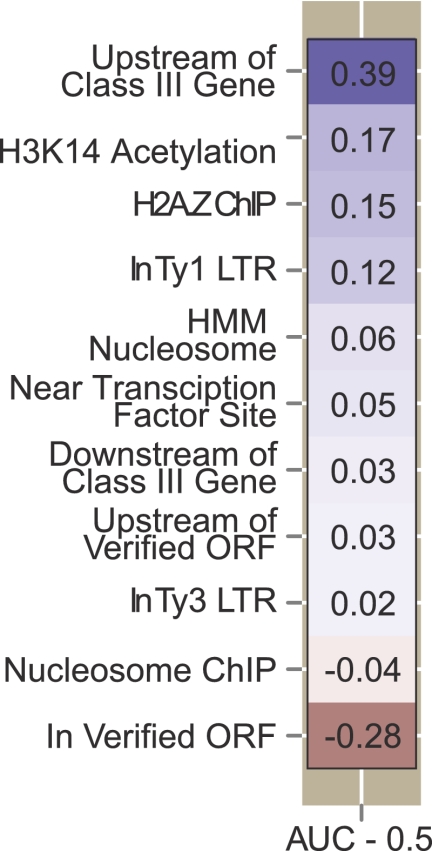
Association of Ty1 insertions with different chromosomal features. Only a subset of features are shown for which significant positive (blue) or negative (red) AUC values were obtained by logistic regression. The color intensity denotes the strength of the association. Actual values shown are AUC-0.5. The analysis treated each base pair as a potential insertion site.
Ty1 insertions and nucleosomes
Logistic regression identified upstream regions of class III genes as most strongly predictive of insertion sites, and so Ty1 insertions upstream of class III genes were combined into a single distribution aligned on the start site of RNA Pol III transcription (Fig. 4A). This pattern, as previously noted (Bachman et al. 2004), is damped periodic with the amplitude attenuating with increasing distance from the start site. The amplitude reached background ∼650 bp upstream of the transcription start. To better visualize the pattern, we applied spline smoothing to the combined data. Six distinct peaks were apparent, and the distances between peaks suggested three periods each with two peaks. The average period was 174 bp, similar to the 182 bp expected between nucleosomes. Because nucleosomes (as predicted by HMM modeling) were also predictive of Ty1 targets, we used a genome-wide atlas of nucleosome positions to overlay nucleosome density onto the Ty1 insertion pattern (Lee et al. 2007). This overlay revealed a tight association between the areas of lowest nucleosome density and the deepest troughs in insertion frequency. The more shallow insertion troughs were associated with the center of nucleosome-dense regions.
Figure 4.

Association of Ty1 insertions with nucleosomes. (A) Ty1 insertions upstream of class III genes were plotted in a single distribution relative to the start of transcription (position 0 on the x axis). Nucleosome density is depicted by the color of the x axis (Lee et al. 2007). Blue denotes the presence of nucleosomes; red denotes the lack of nucleosomes. The intensity of the color indicates the strength of the signal. The y axis indicates the number of insertions per 10 bp. The red line in the graph depicts the spline-smoothed data. The spline identifies three periods, each with two peaks and two troughs. The deepest troughs (intervening) occur at approximately base positions 60, 220, 400, and 590. The other troughs occur within nucleosome-rich regions. Peak1 is the highest peak in each period; peak2 is the lowest. The inset provides calculated average distances (in base pairs) between features in the spline-smoothed data. (B) A radial plot depicting the distribution of insertions relative to the wrapping of DNA in nucleosomes. Each rung of the radial plot denotes 20 insertions. The 0 point is the dyad axis of the nucleosome. The three colors indicate the three periods observed in A. “First” denotes the plot of insertions that occurred within DNA bound by the first nucleosome upstream of the transcription start site; “Second” denotes insertions within the second nucleosome, etc. Note that the two peaks of insertions within a period are coincident on the nucleosome, and the red line indicates the coincident peaks of the spline-smoothed data. Below the radial plot is a space-filling model of a nucleosome. (Yellow) H2A; (red) H2B; (blue) H3; (green) H4. The position on the nucleosome-bound DNA of the coincident peaks of the spline-smoothed data is marked in pink.
A radial plot was used to represent the wrapping of DNA in nucleosomes (Fig. 4B). The two insertion peaks from each period mapped to the same region of the radial plot, indicating that they occurred in the same region of the nucleosome. We used a positional index to describe the position of DNA on the nucleosome. Position zero defines the nucleotide of the dyad axis on the face of the nucleosome with a single DNA helix. According to this index, the spline-smoothed peak of insertions was located 42 bp in the clockwise direction. This region is near the H2A:H2B interface. These results imply that the periodic insertion pattern is driven by an interaction of Ty1 IN with nucleosomes or nucleosome-associated factors. Modification of histone tails could be a contributing determinant; however, the location of tails in the crystal structures is not necessarily reliable.
Ty1 insertions and endogenous Ty elements
As described above, we did not exclude Ty1 insertions into repetitive DNA. This was important in the analysis of insertions in endogenous Ty elements, particularly the Ty1 LTRs, which received numerous integration events. We mapped both ambiguous and unambiguous Ty1 insertions onto a canonical Ty1 LTR, identifying several peaks and troughs (Fig. 5). Since most Ty1 LTRs are upstream of tRNA genes, we asked whether the observed pattern could be explained by positioned nucleosomes in these regions. The distance between each LTR and nearby class III gene was determined, and this information was used to map the nucleosome occupancy peaks (based on the periodic distributions of nucleosomes upstream of class III genes) onto a canonical LTR sequence. The distribution of the nucleosomal peaks closely mirrors the distribution of Ty1 insertions into the LTRs. This suggests that the frequency and distribution of insertion into Ty1 LTRs is a consequence of positioned nucleosomes upstream of class III genes.
Figure 5.

Association of Ty1 insertions with endogenous Ty1 LTRs. Ty1 insertions in a canonical Ty1 LTR were plotted. Separate plots were generated for insertions in LTRs (represented by black dots) in the same orientation (parallel, upper plot) or opposite orientation (divergent, lower plot) with respect to the direction of transcription of the adjacent class III gene. The distance was then calculated between the end of the LTR and the start of transcription of the adjacent class III gene. Using this distance, the expected position of integration peaks were plotted based on the data in Figure 4A. These expected peaks are shown in the plots as colored lines. The gradient of pink to blue color denotes the expected magnitude of the peaks observed at increasing distances from the start of transcription: pink represents the highest peak expected, and blue the lowest. The alignment of the colored bars with the insertion peaks (black dots) suggests that the nonrandom distribution of insertions across the LTR is due to integration into phased nucleosomes upstream of class III gene targets.
Ty1 insertions and class II genes
Verified ORFs were the strongest negative predictor of Ty1 insertion sites, whereas positive predictors were factors associated with transcription and gene regulatory regions (Fig. 3). For example, H3K14 acetylation was positively correlated with Ty1 insertions, and this epigenetic mark, which is mediated by GCN5, is associated with many highly transcribed genes (Pokholok et al. 2005). We hypothesized that discrimination against ORFs may be due to targeting to upstream regions of genes transcribed by Pol II, similar to what was observed at class III genes. We therefore mapped insertions relative to verified ORFs, looking specifically at insertions that occurred within the ORF or either 1 kb upstream or downstream (Fig. 6A). The upstream and downstream regions showed a symmetric pattern of insertions, with the first 400 bp on either side of the coding sequence receiving the fewest insertions. The increase in insertions adjacent to either end of the ORFs was coincident with the rise in nucleosome density. This pattern was consistent in both the haploid and diploid data sets, and underscores our previous arguments that avoidance of ORFs is not due to selection. Rather, the pattern of insertions upstream of and downstream from coding sequences is consistent with targeted insertion into nucleosome-rich regions flanking genes.
Figure 6.

Association of Ty1 insertions with class II genes. The x axis describes the area within and around class II genes. Regions 1 kb upstream of and downstream from the coding region are shown. The falloff in insertions further from the ORF was due to intergenic regions shorter than 1000 bp. Coding regions are depicted as a normalized scale. The y axis describes nucleosome density (gray) or the number of Ty1 insertions (black) in A wild type of B, rad6Δ strains.
Ty1 insertion patterns in mutant backgrounds
The genome-wide pattern of Ty1 insertions was analyzed in four mutant backgrounds that have previously been shown to have altered levels or patterns of Ty1 transposition—hos2Δ, rrm3Δ, rtt109Δ, and rad6Δ (Liebman and Newnam 1993; Huang et al. 1999; Mou et al. 2006; Nyswaner et al. 2008; Stamenova et al. 2009). Previous work showed that the histone deacetylase, Hos2, acts at tRNA genes to promote Ty1 insertion (Mou et al. 2006). Whereas Hos2 may increase the frequency of Ty1 insertion at class III targets, the genome-wide distribution of insertions in hos2Δ is not significantly different from wild type (pairwise Pearson correlations for BY4741 vs. hos2Δ = [0.88, 0.88], P = 0.001). The frequency of insertion into verified ORFs was also equivalent to wild type (4.9%) (Fig. 7A), as was the distribution of insertions at different class III genes ([0.91, 0.96] at 99.9% certainty) (Fig. 7B). Further, no discernable change in insertion pattern was observed upstream of class III genes: All six nucleosome-associated peaks identified in the wild type were present in hos2Δ, with similar relative heights and spacing (Fig. 7C). This finding is consistent with the hypothesis that Hos2 influences integration efficiency and not integration specificity.
Figure 7.

Distribution of Ty1 insertions in mutant strains. (A) Percentage of insertions that occurred in verified ORFs in different wild-type and mutant strains. (B) Pairwise Spearman correlations between strains based on the number of insertions in 2-kb windows upstream of class III genes. This provides a measure of the consistency in targeting between strains to particular class III genes. BY4741 serves as the reference strain. Error bars represent a P-value of 0.001. (C) Pattern of targeting upstream of class III genes in wild-type and mutant backgrounds. The graph is the same as described in Figure 4A with the exception that only the spline-smoothed data is shown. Also, the y axis has been normalized with respect to the total number of insertions in the upstream region. Shading around each spline denotes error for the approximation at P = 0.05.
Rtt109 acetylates histone H3 on K56 and K9 residues, which is important for repression of Ty1 mobility, genome stability, and cell survival of DNA damage (Scholes et al. 2001; Driscoll et al. 2007; Han et al. 2007; Fillingham et al. 2008). The rtt109Δ background showed no significant changes from the wild type with respect to global distribution of insertions (pairwise Pearson correlations for BY4741 vs. rtt109Δ = [0.92, 0.93], P = 0.001). The frequency of insertion into verified ORFs was a moderate 6.6% (Fig. 7A), and the variance in class III gene target preference correlated strongly ([0.90, 0.95] at 99.9% confidence) with BY4741 (Fig. 7B). In addition, the pattern of insertion upstream of class III genes did not differ from wild type (Fig. 7C).
The Rrm3 “sweepase” is a DNA helicase that allows DNA replication forks to traverse non-nucleosomal protein:DNA complexes such as the Pol III transcription complex on tRNA genes (Ivessa et al. 2003). The rrm3Δ mutation increases Ty1 mobility by promoting the insertion of multiple cDNA molecules, sewn together by recombination, into the genome (Stamenova et al. 2009). The global Ty1 integration patterns in rrm3Δ were less well correlated with wild type than the other two strains (pairwise Pearson correlations for BY4741 vs. rrm3 = [0.71, 0.72], P = 0.001), and a significantly higher percentage (9.6%, P = 4 × 10⁻⁶) of insertions occurred in verified ORFs (Fig. 7A). However, patterns of insertion into upstream regions of class III genes correlated with BY4741 ([0.84, 0.92] at 99.9% certainty [Fig. 7B]), and the insertions that did go to class III genes reflected the wild-type pattern with respect to nucleosome positioning [Fig. 7C].
The E2 conjugating enzyme Rad6 is involved in a number of aspects of DNA repair and genome stability (Game and Chernikova 2009). The rad6Δ background received a considerably higher frequency of Ty1 insertions into coding sequences, with 15.0% of insertions going into verified ORFs (Fig. 7A). This is consistent with global targeting patterns, which showed a moderate correlation with wild type (pairwise Pearson correlations for BY4741 vs. rad6Δ = [0.75, 0.75], P = 0.001). Higher frequency of integration into ORFs in rad6Δ is also consistent with previous studies that described higher levels of mutagenesis of CAN1 and URA3 by Ty1 in this genetic background (Liebman and Newnam 1993; Huang et al. 1999). Despite this loosened target specificity, when Ty1 insertions were mapped with respect to the coding sequence of all class II genes, the pattern observed was similar to wild type, namely, there was a preference for nucleosome-bound regions flanking genes (Fig. 6B). Ty1 showed a similar preference for class III gene targets as BY4741 in the rad6Δ background ([0.70, 0.85] at 99.9% certainty) (Fig. 7B), and in the upstream regions of class III genes the pattern of insertions grew, if anything, more pronounced (Fig. 7C). In addition to the pronounced six nucleosomal peaks, two more peaks 600–775 bp upstream of the transcription start site were evident. All peaks matched the magnitudes and spacing observed in wild type.
Discussion
The use of high-throughput DNA sequencing to map large numbers of transposable element insertions is increasingly employed to understand how mobile elements interface with their host genome (Gangadharan et al. 2010; Guo and Levin 2010; Baller et al. 2011). In species such as Saccharomyces cerevisiae, the availability of genome-wide data sets for a large number of chromosomal features and functions (e.g., histone modifications or sites of DNA replication) makes it possible to relate insertion sites to diverse aspects of genome biology. Using these resources, we undertook a rather straightforward approach: We used machine learning (specifically logistic regression) to assess relationships between various chromosomal features, and Ty1 insertions to better understand how this mobile element selects integration sites. This approach for ascertaining targeting determinants was pioneered for analysis of large data sets of retroviral insertions, and the analytic methods we used were based on this previous work (Berry et al. 2006).
Class III genes are preferred Ty1 targets (Devine and Boeke 1996), and fully 90% of the more than 150,000 mapped insertions occurred within a 2-kb window upstream of class III gene transcription start sites. Chromosomal localization of particular Pol III subunits did not explain targeting patterns. For example, Extra TFIIIC (ETC) sites (ETC1-8) (Moqtaderi and Struhl 2004) that bind TFIIIC, but not TFIIIB or Pol III (Simms et al. 2008), received no insertions. We conclude, therefore, that specific components of the Pol III complex are not likely targeted by Ty1, but rather, Ty1 recognizes other feature(s) associated with sites of Pol III transcription. Our study also revealed a wide variation in the number of insertions that occurred at different class III genes. Hot and cold targets were consistent between different wild-type strains, as well as with an earlier study that mapped a smaller number of Ty1 insertions at a subset of tRNA genes (Bachman et al. 2004) and with the large-scale analysis of Ty1 target site choice described in the companion study by Mularoni et al. (2011). Variation in insertion frequency at different class III genes, therefore, appears to be an inherent property of the targets. Insight into the underlying basis for Ty1's preference for different class III genes, however, was frustrated by our inability to identify a genomic feature(s) specifically associated with hot or cold targets.
The density of Ty1 insertions recovered by high-throughput sequencing made it possible, for the first time, to comprehensively evaluate non–class III gene targeting. A strong negative association was observed between Ty1 insertions and verified ORFs. Selection was ruled out as the basis for ORF avoidance, because the frequency of insertion into ORFs was not significantly different between haploid and diploid strains. It would be expected that deleterious effects of an insertion would be mitigated, at least in part, by a second copy of the gene, leading to a higher frequency of ORF insertions in the diploid. Since selection did not significantly influence targeting patterns, this suggests that ORFs are not competent to receive Ty1 insertions, either due to the absence of a targeting determinant or the presence of a repulsive factor. The ability of Ty1 to discriminate between coding and noncoding sequences likely has a selective advantage for Ty1, as it minimizes negative consequences of insertional mutagenesis and ensures host survival.
In addition to selection biases that might result from mutation of host genes, our experimental approach required expression of a HIS3 reporter carried on Ty1 cDNA. Biases in insertion-site patterns may result if HIS3 is not expressed in certain chromosomal environments. However, in previous work with the related yeast retrotransposon Ty5, we found HIS3 to be a very robust reporter for recovering insertions in heterochromatin—the preferred sites of Ty5 integration (Baller et al. 2011). Additionally, the experimental approach for recovering Ty1 insertions in the companion study by Mularoni et al. (2011) did not select cells harboring Ty1 integration events, and yet produced a similar genome-wide pattern of insertions.
One difference between our study and that of Mularoni et al. (2011) is that we did not recover Ty1 insertions in mitochondrial DNA. Because our insertion-site data set is smaller than Mularoni et al. (2011), mitochondrial insertions may be below our detection threshold. Based on the Mularoni et al. (2011) data, 0.011% of sequenced reads matched mitochondrial DNA, suggesting that we should find only about 40 mitochondrial sites in our collection of >390,000 sequencing reads generated from wild-type strains. In addition, Mularoni et al. (2011) suggest that some mitochondrial insertions may have occurred in DNA fragments released from shattered mitochondria, and a subset of these events may not give rise to His+ cells, and therefore they would have not been recovered by our approach.
Ty1 and the nucleosome
Our analyses revealed the nucleosome as a new targeting determinant for Ty1. Logistic regression showed a significant positive association between Ty1 insertions and nucleosomes, especially for well-positioned nucleosomes (i.e., those predicted by hidden Markov modeling), such as those found upstream of tRNA genes. In contrast, a slightly negative association was observed between Ty1 insertions and nucleosomes using ChIP data. This is because the vast majority of nucleosomes genome-wide did not receive Ty1 insertions, but rather there was a distinct bias for specific nucleosomes that were targeted. In addition to the nucleosomes upstream of class III genes, nucleosomes flanking ORFs were much preferred over those located in coding sequences. The nucleosome preference also explains patterns of insertion observed in pre-existing Ty1 elements, which are due in large part to their proximity to class III genes and associated, well-positioned nucleosomes.
Insertions into nucleosome-bound DNA did not distribute evenly, but instead were enriched at one end of the dyad axis. At this position, insertions struck both helices in both orientations, and the peak of insertions was the same as that observed by Mularoni et al. (2011) in their related study. The pattern of insertions on the nucleosome is consistent with an interaction between Ty1 integrase and a specific histone modification or nucleosome-associated factor. A significant positive association was observed between Ty1 insertion sites and H3K14 acetylation; however, this modification is generally characteristic of transcriptionally active regions of the genome (Pokholok et al. 2005), and so the association could be correlative. A strong positive association was also observed with the histone variant H2AZ, which is typically found in promoter-proximal nucleosomes of both active and inactive genes in euchromatin (Raisner et al. 2005; Zhang et al. 2005; Papamichos-Chronakis et al. 2011). H2AZ replaces H2A in nucleosomes, and it is the region of nucleosomal DNA near the H2A/H2B interface that was most highly targeted by Ty1. Further, S. cerevisiae strains lacking H2AZ show decreased levels of Ty1 transposition (Dakshinamurthy et al. 2010), and decreases in levels of H2A and H2B alter patterns of integration at the CAN1 locus (Rinckel and Garfinkel 1996). To evaluate more specifically a role for H2AZ in targeting, we performed logistic regression using models that test whether H2AZ is preferentially associated with hot or cold class III gene targets (data not shown). No significant association (positive or negative) was observed, and thus, whether H2AZ has a specific role in targeting awaits further testing.
An alternative hypothesis to explain targeting to nucleosomes is that there exists an intermediary, bridging factor that links the Ty1 integration complex to nucleosome-bound DNA. Candidates include chromatin remodelers, some of which are known to affect Ty1 insertion patterns. For example, loss of ISW2 alters the periodic pattern of Ty1 insertion upstream of class III gene targets (Bachman et al. 2005). However, this is likely due to changes in nucleosome positioning, as catalytically inactive ISW2 does not change overall targeting to tRNA genes (Gelbart et al. 2005).
Nucleosomes are also preferred targets for retroviruses, due to distortion of nucleosome-bound DNA that allows access to retroviral integrase and promotes the integration reaction (Pryciak et al. 1992a,b). Mapping of large numbers of genomic HIV and gammaretrovirus insertions revealed that they occur in a periodic fashion on the surface of the nucleosome, consistent with favored integration on the outward-facing DNA surface, a pattern not observed for Ty1 (Wang et al. 2007; Roth et al. 2011). Like Ty1, however, insertions of HIV and gammaretroviruses were both associated with epigenetic modifications correlated with transcription. Ty1's preference for nucleosomal DNA stands in contrast to the related S. cerevisiae retrotransposon Ty5, which prefers nucleosome-free DNA for integration (Baller et al. 2011). Nucleosomes are also avoided by the DNA transposon Hermes when it transposes in yeast (Gangadharan et al. 2010). Clearly, considerable variation exists with respect to how mobile elements interact with nucleosomes during transposition.
An association between Ty1 insertions and nucleosomes is also observed in the regions flanking class II genes. Nucleosomes are relatively abundant within the coding sequence; however, as mentioned above, coding sequences are particularly cold for Ty1 integration. In the first few hundred base pairs upstream of and downstream from the coding sequence, both nucleosomes and Ty1 insertions are largely absent; but further away from the coding sequence, the number of Ty1 insertions rise, coincident with the presence of nucleosomes. Our data set of Ty1 insertions is too small to make more precise conclusions about the relationship between intergenic nucleosomes and Ty1; however, in light of the relationship between nucleosomes and tRNA genes, it is possible that a specific histone modification or chromatin factor present in the flanking regions of class II genes attracts Ty1 insertions. We propose that there is a common mechanism underlying targeting at both class II and class III genes, and that the abundance of a particular factor—histone modification or bridging factor—determines degree of target competency. Said factor or modification is particularly enriched in class III genes and is most abundant at the nucleosome closest to the start of transcription.
High-throughput mapping of insertion sites in mutant strains
Another advantage of S. cerevisiae as an experimental system is the wealth of genetic resources that can be applied to better understand mechanisms of transposable element target specificity. As a first step in this direction, we mapped large numbers of Ty1 insertions in strains with mutations previously shown to impact frequency or specificity of Ty1 transposition, thereby allowing us to better describe the integration specificity phenotype. Neither loss of the histone deacetylase Hos2 nor the histone acetyltransferase Rtt109 had any impact on target-site choice, although both are known to influence transposition frequency (Scholes et al. 2001; Mou et al. 2006). Because the transposition defect in these strains occurs after cDNA synthesis, our data suggest that these proteins influence integration efficiency. The loss of the DNA helicase Rrm3 had a modest impact on target-site choice, whereas loss of the E2 conjugating enzyme, Rad6, resulted in significantly higher numbers of insertions into ORFs (∼5% for wild type vs. 15% for rad6Δ). Increased mutagenesis in counter-selectable gene targets was previously observed in rad6Δ strains (Liebman and Newnam 1993; Huang et al. 1999), and it appears that this loosened target specificity occurs genome wide. Because patterns of insertion near tRNA genes were largely unperturbed, the underlying determinants of nucleosomal targeting are intact in rad6Δ strains. This is consistent with Rad6 acting to strengthen the targeting signal, such that in its absence, some integrations go astray. Interestingly, one of the targets of Rad6 is H2A (Robzyk et al. 2000), and the loosening of target specificity may be due to altered modification of this protein.
Whereas our analysis of a handful of mutants in this study did not allow us to make new conclusions about Ty1 targeting mechanisms, it nonetheless illustrates the potential for characterizing large numbers of insertions in mutant backgrounds to dissect Ty1 target specificity. Clearly, one direction for future genetic studies will be to identify the factors that create the distinct nucleosomal surface upstream of genes transcribed by RNA Pol III that is such an attractive target for Ty1 integration.
Methods
Generating Ty1 insertions
Plasmid pGTy1his3AI-SCUF contains six nucleotide substitutions in the U5 region of the 5′ LTR of Ty1-H3 downstream from the initiation codon of the gag ORF. The nucleotide substitutions are underlined in the following sequence, which comprises nucleotides 1–24 of gag: ATGGAATCCCAACAGCTTAGCCAA. Substitutions were introduced by overlap extension PCR using pGTy1his3AId1 (Nyswaner et al. 2008) as template DNA.
Plasmid pGTy1his3AI-SCUF DNA was transformed into strains YPH499, YPH501, BY4741, and rrm3Δ::kanMX, hos2Δ::kanMX, rtt109Δ::kanMX, and rad6Δ::kanMX derivatives of BY4741. Independent Ura+ transformants that supported a robust induction of Ty1HIS3-SCUF transposition were identified by growing patches of each isolate on SC-Ura 2% galactose 2% raffinose agar at 20°C, followed by replicating patches to 5-FOA-His plates. Selected pGTy1his3AI-SCUF transformants were grown overnight in SC-Ura 2% glucose broth at 30°C. A 10-μL aliquot of each culture was transferred to 1 mL of SC-Ura 2% galactose, 2% raffinose, and 2% sucrose broth, and cultures were grown at 20°C for 2 d. Cells were pelleted, resuspended in 0.2 mL of ddH20, transferred to YEPD agar, and incubated at 30°C for 16–18 h. Cells were replicated to 5-FOA-HIS 2% glucose plates and incubated at 30°C for 2 d. A 0.75-mL aliquot of ddH20 was added to each plate, and cells were scraped from the agar into suspension using a sterile plastic scraper. The cell suspension was collected, and the agar surface was washed with an additional 0.75-mL aliquot of ddH20. The cell suspensions were combined, and cells were pelleted; ∼0.1 mL of cell pellet was obtained from each plate. Genomic DNA was prepared from individual pellets. Genomic DNA samples from 10 to 14 independently prepared cell pellets in each strain background were used for PCR. PCR amplification of the integration sites was based upon the linker-mediated PCR protocol found in Baller et al. (2011). Each sample was split, one fraction digested with AciI and the other with TaqI. Linkers were annealed and sequences with an adjacent Ty1 insertion were amplified by PCR. Barcoded primers were used in the PCR step to mark the source of the sequences (oligonucleotide sequences are available upon request).
DNA sequence processing
Raw 454 DNA sequence reads were sorted and cleaned with an in-house pipeline that uses the Smith-Waterman local sequence alignment algorithm to identify primer sequences (Smith and Waterman 1981). Reads were excluded that did not have a perfect match to a barcode and surrounding DNA, or that had more than four mismatches to the primer. Insertions at a given position and orientation were only counted once in each pool. Sequences were aligned to the genome using RazerS, a fast-mapping algorithm capable of handling ambiguous insertions with no loss rate (Weese et al. 2009). For each read, only the highest quality maps with at least 98% similarity to genomic DNA were retained.
All data were housed in a relational database management system (RDBMS) with a many-to-many correspondence between reads and genome maps. Reads that mapped to a single genome location were labeled as unambiguous, whereas those that were related to more than one site were labeled as ambiguous. When multiple reads mapped to the same genomic location, reads from different pools or in different orientations were retained, but reads from the same pool were collapsed with the least-ambiguous read used as a representative.
Control sites were drawn randomly from the genome using a derived nonparametric distribution based on genomic sites for AciI and TaqI in the S. cerevisiae genome. The distribution was derived using the frequency and orientation of case sites in the vicinity of restriction sites. This process produced control sites with a similar bias to that of the case sites, thereby removing restriction enzyme recovery bias from the results of the logistic regression.
Data annotation and analysis
Nucleotide annotation of genomic features was based on information from the Saccharomyces Genome Database (Cherry et al. 1998), primary literature, and in-house calculations (Supplemental Table 2). For features with a nonbinary value, the values of overlapping features were summed. In cases of missing data, the nearest data points were averaged to interpolate the missing point. This process generated a vector of annotations for each site.
Analysis of insertion preference relied on logistic regression. Regression models were trained using the glmnet logistic regression function in the R statistical package (Team 2008; Friedman et al. 2010). Models compared the set of experimentally derived integration sites (case) with a random subset of remaining sites (control), fitting equation (Eq. 1)
where f(z) represents the class labels and z represents a linear function of form z = β0 + β1x1, with x being the level of the feature under investigation and β being the regression coefficients. Logistic models were evaluated using Receiver Operating Characteristic (ROC) analysis with 10-fold cross-validation. Evaluations are presented in the form of the Area Under the ROC Curve (AUC), or more precisely, as AUC-0.5. For AUC-0.5, zero indicates a model with no predictive power and values at 0.5 or −0.5 indicate perfect prediction. The sign of the AUC indicates whether the feature is associated with case sites (positive) or control sites (negative). All visualization was handled in R using the ggplot2 graphics package (Wickham 2009).
Data access
DNA sequence data from this study have been submitted to the NCBI Sequence Read Archive (SRA) (http://trace.ncbi.nlm.nih.gov/Traces/sra/sra.cgi) under accession number SRX105543.
Acknowledgments
We thank J. Boeke for sharing data in advance of publication, and R. Bushman and N. Milani for advice on data processing and statistical approaches.
Footnotes
[Supplemental material is available for this article.]
Article published online before print. Article, supplemental material, and publication date are at http://www.genome.org/cgi/doi/10.1101/gr.129585.111.
References
- Bachman N, Eby Y, Boeke JD 2004. Local definition of Ty1 target preference by long terminal repeats and clustered tRNA genes. Genome Res 14: 1232–1247 [DOI] [PMC free article] [PubMed] [Google Scholar]
- Bachman N, Gelbart ME, Tsukiyama T, Boeke JD 2005. TFIIIB subunit Bdp1p is required for periodic integration of the Ty1 retrotransposon and targeting of Isw2p to S. cerevisiae tDNAs. Genes Dev 19: 955–964 [DOI] [PMC free article] [PubMed] [Google Scholar]
- Baller JA, Gao J, Voytas DF 2011. Access to DNA establishes a secondary target site bias for the yeast retrotransposon Ty5. Proc Natl Acad Sci 108: 20351–20356 [DOI] [PMC free article] [PubMed] [Google Scholar]
- Beauregard A, Curcio MJ, Belfort M 2008. The take and give between retrotransposable elements and their hosts. Annu Rev Genet 42: 587–617 [DOI] [PMC free article] [PubMed] [Google Scholar]
- Berry C, Hannenhalli S, Leipzig J, Bushman FD 2006. Selection of target sites for mobile DNA integration in the human genome. PLoS Comput Biol 2: e157 doi: 10.1371/journal.pcbi.0020157 [DOI] [PMC free article] [PubMed] [Google Scholar]
- Bowen NJ, Jordan IK, Epstein JA, Wood V, Levin HL 2003. Retrotransposons and their recognition of pol II promoters: a comprehensive survey of the transposable elements from the complete genome sequence of Schizosaccharomyces pombe. Genome Res 13: 1984–1997 [DOI] [PMC free article] [PubMed] [Google Scholar]
- Bradley AP 1996. The use of the area under the ROC curve in the evaluation of machine learning algorithms. Pattern Recognit 30: 1145–1159 [Google Scholar]
- Bushman FD 2003. Targeting survival: integration site selection by retroviruses and LTR-retrotransposons. Cell 115: 135–138 [DOI] [PubMed] [Google Scholar]
- Chalker DL, Sandmeyer SB 1992. Ty3 integrates within the region of RNA polymerase III transcription initiation. Genes Dev 6: 117–128 [DOI] [PubMed] [Google Scholar]
- Cherepanov P, Maertens G, Proost P, Devreese B, Van Beeumen J, Engelborghs Y, De Clercq E, Debyser Z 2003. HIV-1 integrase forms stable tetramers and associates with LEDGF/p75 protein in human cells. J Biol Chem 278: 372–381 [DOI] [PubMed] [Google Scholar]
- Cherry JM, Adler C, Ball C, Chervitz SA, Dwight SS, Hester ET, Jia Y, Juvik G, Roe T, Schroeder M, et al. 1998. SGD: Saccharomyces Genome Database. Nucleic Acids Res 26: 73–79 [DOI] [PMC free article] [PubMed] [Google Scholar]
- Ciuffi A, Llano M, Poeschla E, Hoffmann C, Leipzig J, Shinn P, Ecker JR, Bushman F 2005. A role for LEDGF/p75 in targeting HIV DNA integration. Nat Med 11: 1287–1289 [DOI] [PubMed] [Google Scholar]
- Curcio MJ, Garfinkel DJ 1991. Single-step selection for Ty1 element retrotransposition. Proc Natl Acad Sci 88: 936–940 [DOI] [PMC free article] [PubMed] [Google Scholar]
- Dakshinamurthy A, Nyswaner KM, Farabaugh PJ, Garfinkel DJ 2010. BUD22 affects Ty1 retrotransposition and ribosome biogenesis in Saccharomyces cerevisiae. Genetics 185: 1193–1205 [DOI] [PMC free article] [PubMed] [Google Scholar]
- Devine SE, Boeke JD 1996. Integration of the yeast retrotransposon Ty1 is targeted to regions upstream of genes transcribed by RNA polymerase III. Genes Dev 10: 620–633 [DOI] [PubMed] [Google Scholar]
- Driscoll R, Hudson A, Jackson SP 2007. Yeast Rtt109 promotes genome stability by acetylating histone H3 on lysine 56. Science 315: 649–652 [DOI] [PMC free article] [PubMed] [Google Scholar]
- Fillingham J, Recht J, Silva AC, Suter B, Emili A, Stagljar I, Krogan NJ, Allis CD, Keogh MC, Greenblatt JF 2008. Chaperone control of the activity and specificity of the histone H3 acetyltransferase Rtt109. Mol Cell Biol 28: 4342–4353 [DOI] [PMC free article] [PubMed] [Google Scholar]
- Friedman J, Hastie T, Tibshirani R 2010. Regularization paths for generalized linear models via coordinate descent. J Stat Softw 33: 1–22 [PMC free article] [PubMed] [Google Scholar]
- Game JC, Chernikova SB 2009. The role of RAD6 in recombinational repair, checkpoints and meiosis via histone modification. DNA Repair 8: 470–482 [DOI] [PubMed] [Google Scholar]
- Gangadharan S, Mularoni L, Fain-Thornton J, Wheelan SJ, Craig NL 2010. DNA transposon Hermes inserts into DNA in nucleosome-free regions in vivo. Proc Natl Acad Sci 107: 21966–21972 [DOI] [PMC free article] [PubMed] [Google Scholar]
- Gelbart ME, Bachman N, Delrow J, Boeke JD, Tsukiyama T 2005. Genome-wide identification of Isw2 chromatin-remodeling targets by localization of a catalytically inactive mutant. Genes Dev 19: 942–954 [DOI] [PMC free article] [PubMed] [Google Scholar]
- Goodier JL, Kazazian HH Jr 2008. Retrotransposons revisited: the restraint and rehabilitation of parasites. Cell 135: 23–35 [DOI] [PubMed] [Google Scholar]
- Guo Y, Levin HL 2010. High-throughput sequencing of retrotransposon integration provides a saturated profile of target activity in Schizosaccharomyces pombe. Genome Res 20: 239–248 [DOI] [PMC free article] [PubMed] [Google Scholar]
- Han J, Zhou H, Horazdovsky B, Zhang K, Xu RM, Zhang Z 2007. Rtt109 acetylates histone H3 lysine 56 and functions in DNA replication. Science 315: 653–655 [DOI] [PubMed] [Google Scholar]
- Harismendy O, Gendrel CG, Soularue P, Gidrol X, Sentenac A, Werner M, Lefebvre O 2003. Genome-wide location of yeast RNA polymerase III transcription machinery. EMBO J 22: 4738–4747 [DOI] [PMC free article] [PubMed] [Google Scholar]
- Huang H, Hong JY, Burck CL, Liebman SW 1999. Host genes that affect the target-site distribution of the yeast retrotransposon Ty1. Genetics 151: 1393–1407 [DOI] [PMC free article] [PubMed] [Google Scholar]
- Ivessa AS, Lenzmeier BA, Bessler JB, Goudsouzian LK, Schnakenberg SL, Zakian VA 2003. The Saccharomyces cerevisiae helicase Rrm3p facilitates replication past nonhistone protein-DNA complexes. Mol Cell 12: 1525–1536 [DOI] [PubMed] [Google Scholar]
- Ji H, Moore DP, Blomberg MA, Braiterman LT, Voytas DF, Natsoulis G, Boeke JD 1993. Hotspots for unselected Ty1 transposition events on yeast chromosome III are near tRNA genes and LTR sequences. Cell 73: 1007–1018 [DOI] [PubMed] [Google Scholar]
- Kent WJ 2002. BLAT–the BLAST-like alignment tool. Genome Res 12: 656–664 [DOI] [PMC free article] [PubMed] [Google Scholar]
- Lee W, Tillo D, Bray N, Morse RH, Davis RW, Hughes TR, Nislow C 2007. A high-resolution atlas of nucleosome occupancy in yeast. Nat Genet 39: 1235–1244 [DOI] [PubMed] [Google Scholar]
- Leem YE, Ripmaster TL, Kelly FD, Ebina H, Heincelman ME, Zhang K, Grewal SI, Hoffman CS, Levin HL 2008. Retrotransposon Tf1 is targeted to Pol II promoters by transcription activators. Mol Cell 30: 98–107 [DOI] [PMC free article] [PubMed] [Google Scholar]
- Liebman SW, Newnam G 1993. A ubiquitin-conjugating enzyme, RAD6, affects the distribution of Ty1 retrotransposon integration positions. Genetics 133: 499–508 [DOI] [PMC free article] [PubMed] [Google Scholar]
- Majumdar A, Chatterjee AG, Ripmaster TL, Levin HL 2010. Determinants that specify the integration pattern of retrotransposon Tf1 in the fbp1 promoter of Schizosaccharomyces pombe. J Virol 85: 519–529 [DOI] [PMC free article] [PubMed] [Google Scholar]
- Moqtaderi Z, Struhl K 2004. Genome-wide occupancy profile of the RNA polymerase III machinery in Saccharomyces cerevisiae reveals loci with incomplete transcription complexes. Mol Cell Biol 24: 4118–4127 [DOI] [PMC free article] [PubMed] [Google Scholar]
- Mou Z, Kenny AE, Curcio MJ 2006. Hos2 and Set3 promote integration of Ty1 retrotransposons at tRNA genes in Saccharomyces cerevisiae. Genetics 172: 2157–2167 [DOI] [PMC free article] [PubMed] [Google Scholar]
- Mularoni L, Zhou Y, Bowen T, Gangadharan S, Wheelan SJ, Boeke JD 2011. Ty1 integration targets specific nucleosomal DNA. Genome Res (this issue). doi: 10.1101/gr.129460.111 [DOI] [PMC free article] [PubMed] [Google Scholar]
- Nyswaner KM, Checkley MA, Yi M, Stephens RM, Garfinkel DJ 2008. Chromatin-associated genes protect the yeast genome from Ty1 insertional mutagenesis. Genetics 178: 197–214 [DOI] [PMC free article] [PubMed] [Google Scholar]
- Papamichos-Chronakis M, Watanabe S, Rando OJ, Peterson CL 2011. Global regulation of H2A.Z localization by the INO80 chromatin-remodeling enzyme is essential for genome integrity. Cell 144: 200–213 [DOI] [PMC free article] [PubMed] [Google Scholar]
- Pokholok DK, Harbison CT, Levine S, Cole M, Hannett NM, Lee TI, Bell GW, Walker K, Rolfe PA, Herbolsheimer E, et al. 2005. Genome-wide map of nucleosome acetylation and methylation in yeast. Cell 122: 517–527 [DOI] [PubMed] [Google Scholar]
- Pryciak PM, Muller HP, Varmus HE 1992a. Simian virus 40 minichromosomes as targets for retroviral integration in vivo. Proc Natl Acad Sci 89: 9237–9241 [DOI] [PMC free article] [PubMed] [Google Scholar]
- Pryciak PM, Sil A, Varmus HE 1992b. Retroviral integration into minichromosomes in vitro. EMBO J 11: 291–303 [DOI] [PMC free article] [PubMed] [Google Scholar]
- Raisner RM, Hartley PD, Meneghini MD, Bao MZ, Liu CL, Schreiber SL, Rando OJ, Madhani HD 2005. Histone variant H2A.Z marks the 5′ ends of both active and inactive genes in euchromatin. Cell 123: 233–248 [DOI] [PMC free article] [PubMed] [Google Scholar]
- Rinckel LA, Garfinkel DJ 1996. Influences of histone stoichiometry on the target site preference of retrotransposons Ty1 and Ty2 in Saccharomyces cerevisiae. Genetics 142: 761–776 [DOI] [PMC free article] [PubMed] [Google Scholar]
- Roberts DN, Stewart AJ, Huff JT, Cairns BR 2003. The RNA polymerase III transcriptome revealed by genome-wide localization and activity-occupancy relationships. Proc Natl Acad Sci 100: 14695–14700 [DOI] [PMC free article] [PubMed] [Google Scholar]
- Robzyk K, Recht J, Osley MA 2000. Rad6-dependent ubiquitination of histone H2B in yeast. Science 287: 501–504 [DOI] [PubMed] [Google Scholar]
- Roth SL, Malani N, Bushman FD 2011. Gammaretroviral integration into nucleosomal target DNA in vivo. J Virol 85: 7393–7401 [DOI] [PMC free article] [PubMed] [Google Scholar]
- Scholes DT, Banerjee M, Bowen B, Curcio MJ 2001. Multiple regulators of Ty1 transposition in Saccharomyces cerevisiae have conserved roles in genome maintenance. Genetics 159: 1449–1465 [DOI] [PMC free article] [PubMed] [Google Scholar]
- Simms TA, Dugas SL, Gremillion JC, Ibos ME, Dandurand MN, Toliver TT, Edwards DJ, Donze D 2008. TFIIIC binding sites function as both heterochromatin barriers and chromatin insulators in Saccharomyces cerevisiae. Eukaryot Cell 7: 2078–2086 [DOI] [PMC free article] [PubMed] [Google Scholar]
- Slotkin RK, Martienssen R 2007. Transposable elements and the epigenetic regulation of the genome. Nat Rev Genet 8: 272–285 [DOI] [PubMed] [Google Scholar]
- Smith TF, Waterman MS 1981. Identification of common molecular subsequences. J Mol Biol 147: 195–197 [DOI] [PubMed] [Google Scholar]
- Soragni E, Kassavetis GA 2008. Absolute gene occupancies by RNA polymerase III, TFIIIB, and TFIIIC in Saccharomyces cerevisiae. J Biol Chem 283: 26568–26576 [DOI] [PMC free article] [PubMed] [Google Scholar]
- Stamenova R, Maxwell PH, Kenny AE, Curcio MJ 2009. Rrm3 protects the Saccharomyces cerevisiae genome from instability at nascent sites of retrotransposition. Genetics 182: 711–723 [DOI] [PMC free article] [PubMed] [Google Scholar]
- Team RDC. 2008. R: a language and environment for statistical computing. Vienna, Austria. [Google Scholar]
- Wang GP, Ciuffi A, Leipzig J, Berry CC, Bushman FD 2007. HIV integration site selection: Analysis by massively parallel pyrosequencing reveals association with epigenetic modifications. Genome Res 17: 1186–1194 [DOI] [PMC free article] [PubMed] [Google Scholar]
- Weese D, Emde AK, Rausch T, Doring A, Reinert K 2009. RazerS–fast read mapping with sensitivity control. Genome Res 19: 1646–1654 [DOI] [PMC free article] [PubMed] [Google Scholar]
- Wickham H. 2009. Ggplot2: elegant graphics for data analysis. Springer, New York. [Google Scholar]
- Xie W, Gai X, Zhu Y, Zappulla DC, Sternglanz R, Voytas DF 2001. Targeting of the yeast Ty5 retrotransposon to silent chromatin is mediated by interactions between integrase and Sir4p. Mol Cell Biol 21: 6606–6614 [DOI] [PMC free article] [PubMed] [Google Scholar]
- Yieh L, Kassavetis G, Geiduschek EP, Sandmeyer SB 2000. The Brf and TATA-binding protein subunits of the RNA polymerase III transcription factor IIIB mediate position-specific integration of the gypsy-like element, Ty3. J Biol Chem 275: 29800–29807 [DOI] [PubMed] [Google Scholar]
- Yieh L, Hatzis H, Kassavetis G, Sandmeyer SB 2002. Mutational analysis of the transcription factor IIIB-DNA target of Ty3 retroelement integration. J Biol Chem 277: 25920–25928 [DOI] [PubMed] [Google Scholar]
- Zhang H, Roberts DN, Cairns BR 2005. Genome-wide dynamics of Htz1, a histone H2A variant that poises repressed/basal promoters for activation through histone loss. Cell 123: 219–231 [DOI] [PMC free article] [PubMed] [Google Scholar]
- Zhu Y, Dai J, Fuerst PG, Voytas DF 2003. Controlling integration specificity of a yeast retrotransposon. Proc Natl Acad Sci 100: 5891–5895 [DOI] [PMC free article] [PubMed] [Google Scholar]