

Abstract
Background. A cross-sectional survey was designed to provide a baseline data on the prevalence and distribution of overweight and obesity and their associations among adults in Palestine. Methods. A random representative sample of 3617 adults aged 18–64 years was collected between October 1999 and October 2000. Results. The prevalence of overweight was 35.5% in women and 40.3% in men, obesity was 31.5% in women and 17.5% in men. Adults aged 45–54 years old were significantly more likely to be obese (29.2% in men and 50.2% in women) or overweight (48.1% in men and 37.2% in women). When compared with women, men showed significantly more normal BMI level (40.5% versus 31.6%; P < 0.05). Cut-off points for a high waist circumference and high waist-to-hip ratio identified 57.8% and 47.2% of the population, respectively, to be at an increased and high risk for cardiovascular disease. Sociodemographic factors (age, sex, educational level, and marital status) were also found to be significantly related to BMI. Conclusion. Obesity and overweight are enormous public health problems in Palestine. Population-based research at the national level to investigate the social and cultural factors associated with high prevalence of overweight and obesity among Palestinian adults should be implemented.
1. Introduction
Obesity and the related health risks have been noted to be an epidemic problem worldwide [1], especially in developing countries [2, 3]. Within the Eastern Mediterranean Region, an increasing prevalence of overweight has been recorded [4–6] and has been noted to be at “an alarming level” [7]. The factors leading to this widespread increase in obesity have been suggested to include economic growth, modernization, westernization of lifestyles (including foods higher in fats and decrease in exercise levels), and the globalisation of food markets [8–12], with women being suggested to be especially at risk [13, 14].
Palestine is currently divided into the West Bank, a 5,800 km² area located along the northwest border of Jordan, and Gaza, a 365 km² strip of land on the Mediterranean coast, northeast of Egypt [15]. The Central Intelligence Agency (CIA) world factbook reports there to be 2.5 million Palestinians residing in the West Bank and 1.5 million in the Gaza Strip [16]. 5.8% of the population of the West Bank and 31.3% of the population of the Gaza Strip live in refugee camps. Women of reproductive age (15–49 years of age) are estimated to 838,555 (45.1%) of the total number of the females in 2005 and constitute 22.3% of the total population, out of which 292,480 (43%) in Gaza Strip represent 17.2% of the total population and 543,075 in West Bank (46.4%) [17]. The population is relatively young: in mid-2005 the Palestinian Central Bureau of Statistics reported 18% of the population to be under 5 and 46% to be under 15 years old. Due to this, the Palestinian population is expected to grow dramatically to 7.4 million by 2025 [17]. The socioeconomic situation is relatively poor with nearly 40% of Palestinians being considered chronically food insecure [18].
Palestine is not an exception regarding obesity. A study of an urban Palestinian population found 49% of women and 30% of men to be obese [19], and a later study including Palestinians in rural West Bank found 37% obesity levels for women and 18% amongst men [20]. Among adolescents, a study taking place at the national level in both West Bank and Gaza found the prevalence of overweight for both genders (n = 12,847; 6,099 boys and 6,748 girls) was 16.5% (13.3% overweight; 3.2% obese); off these, 20.4% were boys and 13.0% were girls [21]. Previously, Abdeen, Greenough, Shaheen, and Tayback (2003) conducted the first national representative study with objective measurement of height and weight for assessment of obesity prevalence in Palestinian children, finding relatively low prevalence of overweight (14.9%) and obesity in children (5.9%) under 59 months [22]. Since then problems with Palestinian children's eating, dieting, and physical activity have been reported warranting further study [23].
Due to the increasing challenges to the health of the Palestinian population in the occupied Palestinian territory, the national health plans have recognized the need to tackle the existence of obesity-related diabetes, cardiovascular disease (CVD), and certain types of cancer [24]. However, some factors hinder the public health planning from creating intervention and control programs for these diseases. These factors include the inadequacy of the societal and health care system reflected in the lack of cooperation between the Ministry of Health and civil society organizations, nongovernmental organizations, international organizations, and private sector who should all adopt prevention as a national priority and work towards a common goal [25]. One other major impediment to the improvement of the Palestinian health intervention system is the continuing military occupation with all its consequences (checkpoints, the separation wall, and many other fences and barriers to movement) which have detrimental effects on the ability to deliver good health care [26–28], as well as the continued focus needed on emergency health care needs, the growing poverty, and unemployment faced by Palestinians [20]. In accordance with the country's nutrition policy, national priorities in research encompassed the identification of the problem of overweight among the Palestinian population and its geographical, sex, and socioeconomic distribution [29].
This paper presents the results of the first national health and nutrition survey (FNHANS) using objective anthropometric measurements, regarding obesity prevalence in the adult Palestinian population residing in the West Bank and Gaza. The objective of the study was to (i) provide baseline and reference data on the prevalence and distribution of overweight and obesity, using different anthropometric measurements (height, weight, waist, and hip circumferences) in adult Palestinians and (ii) to analyze the association between BMI, waist circumference (WC), and waist-to-hip ratio (WHR) measurements with socio demographic variables (educational level, region, area of residency, marital status, and family income), physical activity and smoking.
2. Method
2.1. Procedure
Palestinians residing in the West Bank including East Jerusalem and Gaza regions were selected at random to participate in the study. The sample for this study was based on the health survey (HS) frame provided by the 1999 Palestinian Central Bureau of Statistics (PCBS) [30]. The frame consists of data on each primary sampling unit (PSU), each of which is composed of 100 housing units. The sample was selected using a stratified three-stage cluster sampling design. For data stratification, the population localities in each of the 16 administrative governorates in both regions, 11 in the West Bank and 5 in Gaza Strip, were divided into two strata: urban and rural. For this survey, each locality with ≥2000 inhabitants or more as revealed by the 1997 Palestinian Population and Housing Census was considered “urban”. The remaining localities were considered “rural”. In the first stage of sampling 234 PSUs, 142 in the West Bank and 92 in Gaza Strip were selected. These units were distributed across governorates according to each unit's weight in terms of the number of households it contains. The PSUs were selected using probability proportionate to size with a systematic selection procedure. In the second stage, the equal secondary sampling units were selected (20 and 17 households per PSU in West Bank and Gaza, resp.). In the third stage, one eligible adult was selected per dwelling.
In total, 3,702 adults were eligible to participate in this study. The total number of respondents completed the survey questionnaire was 3,617 with response rate of 97.7%. Of the 3,617 questionnaire, 212 female participants were excluded for being pregnant as well as 27 of physically disabled participants, and those who did not fall within the targeted age group (18–64) were also excluded since BMI calculations would be affected. The final sample for this analysis comprised 3378 participants, with a mean of 35.6 ± 11.2 years. Of them 1725 (51.07%) were men and 1653 (48.93%) were women.
2.2. Data Collection
A pilot study in one urban and on nonurban primary sampling unit cluster took place in September, 1999. The data collection period was between October 1999 and October 2000. Data on food intake, health, and lifestyle, physical activity, attitudes to food and health and anthropometry were collected using a previously validated survey instruments. Questionnaires were checked for completeness, accuracy, and bias at two levels prior to data entry, by field supervisors in the field and by data entry staff at the Al Quds Nutrition and Health Research Institute in Jerusalem.
2.3. Anthropometric Measurements
For each participant, four anthropometric measures were taken in the following order; height, weight, waist circumference (WC), and hip circumference (HC). All measurements were performed according to World Health Organization (WHO) guidelines [31] by well-trained ten males and ten females under the supervision of two health professionals who have public health background and previous experience in performing anthropometric measurements. Height and weight were measured in light clothes without shoes. Height was measured using a coil spring tape measure, and a fixed wood angle was placed on the wall to mark the top of the head. If two measurements differed by >0.4 cm, a third measurement was taken. Weight was measured using a portable analogue Soehnle scale (Soehnle-Waagen GmbH and Co. KG, Wilhelm-Soehnle-Straße 2, D-71540 Murrhardt/Germany) (maximum measurement 130 kg, level of accuracy 0.5 kg) placed on a noncarpeted floor. If measurements differed by >1 kg, a third measurement was taken. For waist circumference measurement, participants were asked to stand erect, to breathe normally, and to relax the abdomen. Circular tapes were used in direct contact with but not compressing the skin. This measure was taken at the midpoint of the subcostal margin of the rib cage and the highest point of the iliac crest.
The hip circumference was measured with participants standing erect with their arms by their sides and with their feet together. The measure was taken to the nearest millimetre with circular tapes placed around the hip, at the level of the greater trochanter (when possible, in direct contact with but not compressing the skin; when not possible, with light and tight contact with clothing). At least two measurements were taken for both waist and hip circumferences to improve accuracy. Both waist and hip circumferences were registered in the database, and waist-to-hip ratio (WHR) was then calculated (by dividing waist values by corresponding hip values), as an indicator of fat distribution.
The BMI cut-offs for overweight and obesity categories, as well as the waist circumference cut-off for increased cardiovascular health risk, were the ones proposed by the WHO [31, 32]: for BMI, underweight <18.5; normal weight 18.5–24.9 kg/m2; overweight 25.0–29.9 kg/m2; obesity I 30.0–34.9 kg/m2; obesity II 35.0–39.9 kg/m2; obesity III ≥40 kg/m2. Two risk categories of waist circumference were used to identify participants who were at an increased risk (men >94 cm, women >80 cm) or a high risk (men >102 cm, women >88 cm) for metabolic diseases [33]. A high risk of cardiovascular disease was also assessed using cut-off points for waist-to-hip ratios (WHR) defined as >0.95 for men and as >0.80 for women as used by other authors [34].
Age was categorized into five groups (18–24, 25–34, 35–44, 45–54, and 55–64 years) while education was categorized as 0–8 years; 9–11 years and ≥12 years of education. Income was categorized as below average (<300 JD/month) and above average (>300 JD/month; 1$ = 0.7 JD). Participants were asked about their smoking and physical activities: “do you now smoke?” (yes or no); “have you ever smoked?” (yes or no); “over the past year, have you regularly engaged in physical activity, lasting for 20 minutes or more, causing rapid breathing and perspiration?” (yes or no).
2.4. Ethical Issues
All participants gave their written informed consent to participate. The protocol for the first national health and nutrition survey (FNHANS) (1999-2000) was approved by both the Ministry of Health and the Al-Quds University Ethics Committees.
2.5. Statistical Analysis
All statistical analyses were carried out using SPSS version 13 (2004 edition, SPSS Inc., Chicago, IL, USA). The mean and standard deviation (SD) were calculated for weight, height, BMI, WC and HC, and WHR. As all measurements were normally distributed, independent t-tests and one-way analysis of variance (ANOVA) were used to test for significant differences in mean anthropometric measurements between gender and age groups. Significance was defined as P < 0.05 except where otherwise stated. Survey weights were applied to obtain population level estimates. When ANOVA tables identified significant differences between age groups and lifestyle factors, post hoc tests were employed to identify which groups were significantly different. Equality of variance was assessed using Levene's test and that determined which post hoc test to use. For groups of equal variance, significant differences between groups were tested using the Scheffe post hoc test (unless otherwise stated). Cross-tabulation identified the percentage of participants in each of the BMI categories and the percentage of participants in the defined risk categories for WC and WHR, which were expressed as percentages. Significant differences between age groups and gender were tested using Chi-square analysis. Multiple regression analysis was performed to estimate BMI variation as dependent variable, and several sociodemographic variables as independent variables. These included age, gender, education, marital status, smoking, physical activity, diabetes, and hypertension. Prevalence odds ratios (ORs) and their 95% confidence intervals (CIs) were calculated.
3. Results
Table 1 summarised the results of anthropometric measurement for both men and women within the five age groups. Of the final sample for the analysis of this paper (3378 participants), BMI was obtained for 100% and WHR 99.3%. For almost all of the anthropometric variables, for both males and females, significantly higher values (P < 0.05) were observed in both the 45–54- and 55–64-year-old age groups when compared with the other three age groups. Height was an exception given that there was a small but statistically significant (P < 0.05) decline across these age groups.
Table 1.
Mean anthropometric measurement and SD in Palestinian adults according to sex and age: findings of the first national health and nutrition survey (FNHANS) 1999-2000.
| Age Group | Male | Female | |||||||||||
|---|---|---|---|---|---|---|---|---|---|---|---|---|---|
| Weight (Kg) | height (m) | BMI (kg/m²) | WC (cm) | HC (cm) | WHR | Weight (Kg) | Height (m) | BMI (kg/m²) | WC (cm) | HC (cm) | WHR | ||
| 18−24 | Mean | 72.30 | 1.73cde | 24.13 | 81.10 | 93.70 | 0.87 | 61.40 | 1.60e | 24.08 | 78.30 | 96.40 | 0.82 |
| SD | 13.10 | 0.08 | 3.80 | 14.50 | 15.80 | 0.09 | 10.20 | 0.07 | 3.77 | 13.40 | 15.80 | 0.09 | |
| N | 268 | 268 | 268 | 268 | 268 | 268 | 284 | 284 | 284 | 284 | 284 | 284 | |
|
| |||||||||||||
| 25–34 | Mean | 75.60a | 1.72de | 25.53 | 87.60a | 98.60a | 0.89a | 68.00a | 1.59a | 26.81a | 87.10a | 105.20a | 0.83 |
| SD | 13.00 | 0.07 | 4.06 | 13.60 | 12.30 | 0.11 | 12.80 | 0.06 | 4.85 | 12.20 | 11.30 | 0.08 | |
| N | 580 | 580 | 580 | 580 | 580 | 580 | 539 | 539 | 539 | 539 | 539 | 539 | |
|
| |||||||||||||
| 35–44 | Mean | 78.5ab | 1.72e | 26.62ab | 92.0ab | 101.7ab | 0.91a | 73.10ab | 1.59 | 29.03ab | 93.20ab | 109.00ab | 0.86ab |
| SD | 13.50 | 0.07 | 4.16 | 13.80 | 12.00 | 0.10 | 14.70 | 0.08 | 5.39 | 13.30 | 13.80 | 0.13 | |
| N | 555 | 555 | 555 | 555 | 555 | 555 | 443 | 443 | 443 | 443 | 443 | 443 | |
|
| |||||||||||||
| 45– 54 | Mean | 81.40ab | 1.70 | 27.95abc | 96.30abc | 102.6ab | 0.94abc | 78.2abc | 1.59 | 31.08abc | 98.30abc | 112.60ab | 0.88ab |
| SD | 14.30 | 0.07 | 4.22 | 15.40 | 13.90 | 0.08 | 14.40 | 0.07 | 5.51 | 15.00 | 15.60 | 0.08 | |
| N | 216 | 216 | 216 | 216 | 216 | 216 | 239 | 239 | 239 | 239 | 239 | 239 | |
|
| |||||||||||||
| 55−64 | Mean | 78.70a | 1.67 | 27.97abc | 95.90ab | 102.80a | 0.93abc | 77.5abc | 1.58 | 31.15abc | 100.8abc | 113.5abc | 0.89abc |
| SD | 13.6 | 0.08 | 4.22 | 16.60 | 14.10 | 0.08 | 15.00 | 0.07 | 5.49 | 16.30 | 16.20 | 0.12 | |
| N | 106 | 106 | 106 | 106 | 106 | 106 | 148 | 148 | 148 | 148 | 148 | 148 | |
|
| |||||||||||||
| Total | Mean | 76.90* | 1.72* | 26.12 | 89.60 | 99.60 | 0.90* | 70.50 | 1.59 | 27.94* | 90.10* | 106.50* | 0.85 |
| SD | 13.60 | 0.07 | 4.25 | 15.00 | 13.40 | 0.10 | 14.50 | 0.07 | 5.53 | 15.30 | 14.90 | 0.10 | |
| N | 1725 | 1725 | 1725 | 1725 | 1725 | 1725 | 1653 | 1653 | 1653 | 1653 | 1653 | 1653 | |
*Denotes significant differences found between men and women for each of the mean anthropometric measurements at P < 0.001.
abcde: Different superscripts within a column denote significant differences between age groups at P < 0.05.
Men were generally about 13 cm taller than women, and the difference was constant across age ranges. In men, the majority of the anthropometric measurements did not significantly increase further in the 55–64-year-old age group, compared with the younger age groups, with the exception of the BMI ratio. These measurements were significantly greater (P < 0.05) in the 45–54-year-old men. A slight decrease in weight and height measurements occurred after 55 years of age in men, and these were the only measurements that were not significantly higher in the 55–64-year-old age group compared with the 25–34 and 35–44 age groups. In women, all of the anthropometric measurements, with the exception of height, were significantly greater (P < 0.05) in the 45–54 year old age group. For all age groups combined (18–64 years), weight and height values were significantly higher (P < 0.001) for men than for women while waist and hip values in females had significantly higher values (Table 1).
Table 2 presents pairwise partial correlation between weight, BMI, WC, and HC, and WHR was investigated, after controlling for age. These anthropometric measurements strongly correlated in both sexes (n = 3378), suggesting that measures of obesity based on these parameters will provide comparable information.
Table 2.
Age-adjusted partial correlation coefficient among anthropometric measures in Palestinian adults: findings of the first national health and nutrition survey (FNHANS) 1999-2000.
| Females (n = 1653) | Males (n = 1725) | ||||
|---|---|---|---|---|---|
| Weight | BMI | Waist | Hip | WHR | |
| Weight | — | .872** | .669** | .577** | .282** |
| Body Mass Index (BMI) | .908** | — | .654** | .548** | .292** |
| Waist Circumference (WC) | .734** | .729** | — | .795** | .502** |
| Hip Circumference (HC) | .719** | .715** | .800** | — | -.096-** |
| Waist/Hip ratio (WHR) | .195** | .194** | .461** | -.108-** | — |
All coefficients significantly different to zero (P < 0.05). **Correlation is significant at the 0.01 level (2-tailed). WC: waist circumference in cm, HC: hip circumference in cm, BMI: body mass index in kg/m2, and WHR (Waist-to- Hip Ratio).
The percentage of the population in the different BMI categories is given in Table 3. For the total population (n = 3378), 1.5% was underweight (BMI < 18.5 kg/m2), 36.1% were in the normal range (BMI = 18.5–24.9 kg/m2), 38.0% were overweight (BMI = 25.0–29.9 kg/m2), and 24.4% were obese (BMI ≥ 30 kg/m2). The majority of the obese participants (17.2%) were in class I obesity (BMI = 30.0–34.9 kg/m2) and 1.6% were morbidly obese (BMI ≥ 40 kg/m2). The data shows that 57.8% of men and almost 67% of women were either overweight or obese with 17.5% of men and 31.5% of women in the obese category. The difference in prevalence of obesity between men and women was particularly large in the older age groups (45–54 and 55–64 years), where the ratio of prevalence of obese women to obese men was approximately two (50.8% versus 29.2%). For all participants aged 25–64-years-old (n = 2826), men (n = 1457) had a higher prevalence in the normal and overweight BMI category (P < 0.05) while women (n = 1369) had a higher prevalence of obesity. The percentage of the total population in the normal category (BMI = 18.5–24.9 kg/m2) decreased significantly (P < 0.001) with increasing age. Conversely, in the overweight and obese categories, the percentage increased significantly with age (P < 0.05). Only in females in the overweight category did this decrease significantly in the 55–64-year-old age group. The prevalence of underweight (BMI < 18.5 kg/m2) demonstrated a very different pattern (Table 3) with the highest prevalence of underweight in the first two age groups (18–24 and 25–34 years) in both sexes. The prevalence of underweight was higher in males (1.7%) than females (1.4%).
Table 3.
Percentage of adults in each BMI category, increasing risk for CVD as defined by waist circumference and WHR according to sex and age group: findings of the first national health and nutrition survey (FNHANS) 1999-2000.
| BMI categories | Waist circumference | WHR increased Risk | ||||||||||||||
|---|---|---|---|---|---|---|---|---|---|---|---|---|---|---|---|---|
| Gender | Age groups | n | Underweight (<18.5) | Normal (18.5–24.9) | Overweight (25.0–29.9) | Obese† ≥ 30 | Class I (30.0–34.9) | Class II (35.0–39.9) | Class III ≥ 40 | n | Normal risk M: <94 cm F: <80 cm | Increased risk M: >94 cm F: >80 cm | High risk M: >102 cm F: >88 cm | n | Normal risk M: <0.95 F: <0.80 | Increased risk M: >0.95 F: >0.80 |
| Male | 18 –24 | 268 | 3.4 | 62.3 | 26.1bcde | 8.2cde | 6.7 | 1.5 | 0.0 | 265 | 83.4bcde | 9.8cd | 6.8cde | 265 | 87.9cde | 12.1cde |
| 25–34 | 580 | 2.4 | 46.0 | 38.4a | 13.1ade | 10.7 | 2.2 | 0.2 | 574 | 70.0acde | 16.4 | 13.6cde | 574 | 84.0cde | 16.0cde | |
| 35–44 | 555 | 1.1 | 35.1ab | 44.0a | 19.8ab | 16.4 | 2.9 | 0.5 | 550 | 53.5abd | 23.3a | 23.3abde | 549 | 70.1ab | 29.9ab | |
| 45–54 | 216 | 0.0 | 22.7ab | 48.1a*** | 29.2ab | 22.7 | 5.6 | 0.9 | 216 | 38.0abc | 25.9a | 36.1abc | 216 | 59.7ab | 40.3ab | |
| 55–64 | 106 | 0.0 | 19.8ab | 50.9a* | 29.2ab | 21.7 | 6.6 | 0.9 | 106 | 43.4ab | 17.9 | 38.7abc | 106 | 61.3ab | 38.7ab | |
| 18–64 | 1725 | 1.7 | 40.5* | 40.3*** | 17.5 | 14.1 | 3.0 | 0.4 | 1711 | 61.1 | 18.9 | 20.0 | 1710 | 75.7 | 24.3 | |
| Female | 18–24 | 284 | 2.5 | 63.7bcde | 26.1 | 7.7bcde | 6.7 | 1.1 | 0.0 | 283 | 53.4bcde | 23.0de | 23.7bcde | 283 | 46.3bcde | 53.7bcde |
| 25–34 | 539 | 2.2 | 38.4 | 35.4 | 23.9acde | 17.8 | 5.4 | 0.7 | 539 | 24.1acde | 29.5cde | 46.4acde | 537 | 35.4acde | 64.6acde | |
| 35–44 | 443 | 0.7 | 20.5ab | 39.5 | 39.3ab** | 26.2 | 8.8 | 4.3 | 438 | 13.0ab | 21.5be | 65.5abde | 438 | 23.7abd | 76.3abd | |
| 45–54 | 239 | 0.4 | 12.1ab | 37.2 | 50.2ab*** | 28.0 | 16.3 | 5.9 | 239 | 9.2ab | 11.7ab | 79.1abc | 239 | 14.2abd | 85.8abd | |
| 55–64 | 148 | 0.0 | 9.5ab | 39.2 | 51.4ab** | 26.4 | 18.2 | 6.8 | 148 | 8.8ab | 6.8abc | 84.5abc | 146 | 13.0ab | 87.0+ | |
| 18–64 | 1653 | 1.4 | 31.6 | 35.5 | 31.5*** | 20.4 | 8.3 | 2.8 | 1647 | 22.6 | 21.6 | 55.7 | 1643 | 29.1 | 70.9 | |
|
| ||||||||||||||||
| Total | 18–24 | 552 | 2.9cde | 63.0bcde | 26.1bcde | 8.0bcde | 6.7 | 1.3 | 0.0 | 548 | 67.9bcde | 16.6b | 15.5bcde | 548 | 66.4cde | 33.6cde |
| 25–34 | 1119 | 2.3 | 42.4acde | 37.0a | 18.3acde | 14.1 | 3.8 | 0.4 | 1113 | 47.8acde | 22.7ae | 29.5acde | 1111 | 60.5cde | 39.5cde | |
| 35–44 | 998 | 0.9a | 28.7abde | 42.0a | 28.5abde | 20.7 | 5.5 | 2.2 | 988 | 35.5abde | 22.5e | 42.0abde | 987 | 49.5abde | 50.5abde | |
| 45–54 | 455 | 0.2a | 17.1abc | 42.4a | 40.2abc | 25.5 | 11.2 | 3.5 | 455 | 22.9abc | 18.5 | 58.7abc | 455 | 35.8abd | 64.2abd | |
| 55–64 | 254 | 0.0 | 13.8abc | 44.1a | 42.1abc | 24.4 | 13.4 | 4.3 | 254 | 23.2abc | 11.4bc | 65.4abc | 252 | 33.3abc | 66.7abd | |
| 18–64 | 3378 | 1.5 | 36.1 | 38.0 | 24.4 | 17.2 | 5.6 | 1.6 | 3358 | 42.2 | 20.2 | 37.6 | 3353 | 52.8 | 47.2 | |
†Obese group consists of all three classes of obesity (i.e. BMI ≥ 30 kg/m2). M: male, F: female. *P < 0.05, **P < 0.010, ***P < 0.001: denotes significant difference between men and women of same age groups and BMI category. abcdeDifferent superscripts within a column denote significant differences between age groups at P < 0.05.
Figure 1 shows the distribution of obesity in the study population based on BMI, WC, and WHR. The three measurements appear to provide different prevalence of obesity across genders. In men, BMI and WC showed an increase with age. WHR provided the lowest prevalence estimate while WC provided the highest prevalence estimate in all age groups. In women, BMI, WC, and WHR prevalence estimates showed an increase with age. Overall, using WC provided the highest prevalence of obesity in men (20.0%) and WHR the lowest (8.8%), while WHR (46.8%) and WC (55.7%) yielded the highest prevalence of obesity in women and BMI (31.5%) the lowest.
Figure 1.
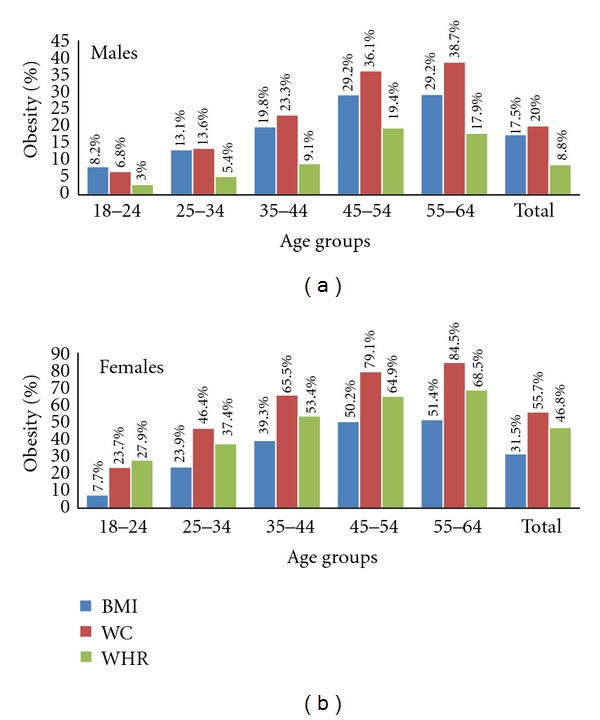
Prevalence of obesity as yielded by BMI, WC, and WHR, in Palestinian adults by gender: findings of the first national health and nutrition survey (FNHANS) 1999-2000. BMI (body mass index ≥30 kg/m2), WC (waist circumference ≥102 cm in men and ≥88 cm in women), and WHR (waist-to-hip ratio ≥1 in men and ≥ 0.85 in women).
WC and WHR are also presented in Table 3, where the data are expressed as a percentage of the population at varying levels of risk for cardiovascular disease as previously defined [22]. In both males and females, the percentage of participants in the risk categories increased with increasing age group for both WC and WHR. For the total population combined and for each gender, there was a significantly greater proportion as of age 25 years in the increased and high risk categories of WC, compared with 18–24-year-olds (P < 0.05). There was a particularly large increase between the 18–24-year-olds and 55–64-year-old age groups. Moving from the baseline age group category (18–24 years) to the last (55–64 years) increased the prevalence of obesity as estimated by WC and WHR by 5.7- and 3.2-fold, respectively, in men and by almost 3.6 and 1.6 times, respectively, in women. Similar to trends in BMI, significantly more men were in the normal risk category of WHR than women (P < 0.001), while significantly more women were in the increased risk category (P < 0.001). The percentage of both men and women in the increased risk category of WHR increased significantly with age up to 54-year age group (P < 0.05).
Figure 2 shows the prevalence of increased risk and greatly increased risk associated with high WC by gender and age group. Significant association (P < 0.001) was found between the prevalence of increased cardiovascular disease risk (and greatly increased cardiovascular disease risk) due to high WC and age interval groups.
Figure 2.
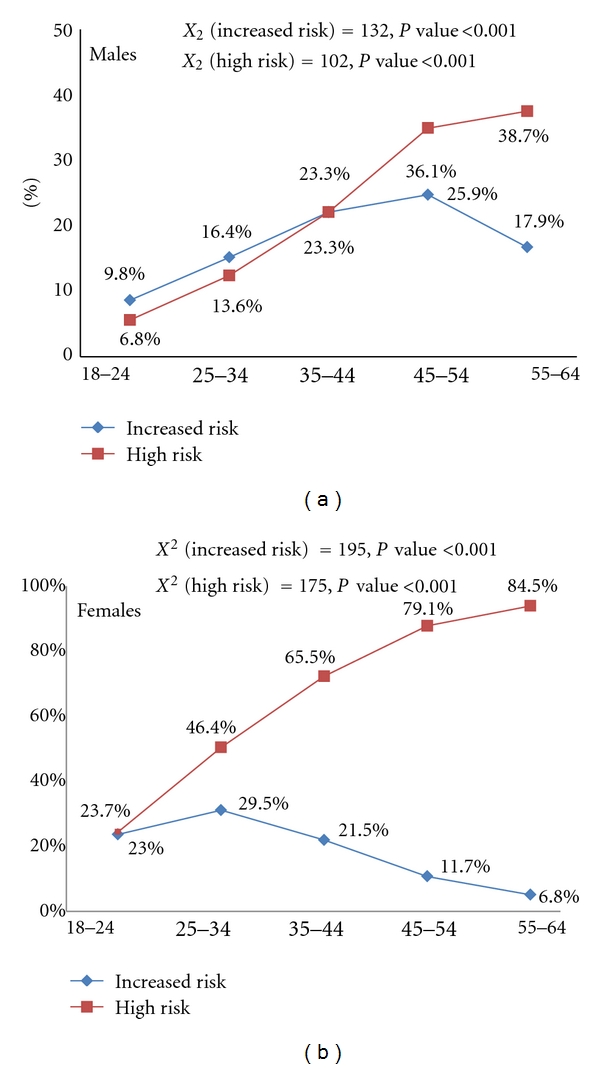
Prevalence of increased risk and greatly increased risk associated with high waist circumference by gender and age group: findings of the first national health and nutrition survey (FNHANS) 1999-2000.
Table 4 examines the association of anthropometric measures for overweight or obesity with demographic and lifestyle factors. Results from logistic regression analysis have shown that certain factors (marked in bold) remain strongly associated with overweight or obesity, namely: educational level, family income, marital status, smoking, and location of residence in the West Bank. Higher educational level was significantly associated with lower risk of overweight or obese among women for the two estimates, (BMI-OR (95% CI) = 0.66 (0.48–0.90); WHR-OR (95% CI) = 0.72 (0.54–0.95)) while the opposite is true among men WHR-OR (95% CI) = 1.34 (1.00–1.79). Married individuals were more likely to be overweight and obese (for men, OR (95% CI) = 1.54 (1.11–2.14), for women, OR (95% CI) = 1.92 (1.39–2.64) than single individuals. West Bank residents were at higher risk than Gaza with WHR-OR (95% CI) = 1.48 (1.11–1.98) for men and 0.76 (0.59–0.99) for women.
Table 4.
Age-adjusted odd ratios (95% confidence interval) for being overweight or obese based on body mass index, waist circumference, and waist-to-hip ratio, with demographic and lifestyle factors in Palestinian adults by gender.
| Male | Female | |||||
|---|---|---|---|---|---|---|
| BMI ≥25 | WC ≥0.9 | WHR ≥0.95 | BMI ≥25 | WC ≥0.8 | WHR ≥0.85 | |
| OR (95%CI) | OR (95%CI) | OR (95%CI) | OR (95%CI) | OR (95%CI) | OR (95%CI) | |
| Educational level | ||||||
| 0–8 Y | Reference | Reference | Reference | Reference | Reference | Reference |
| 9–11 Y | 1.33(0.98–1.80) | 1.41 (0.23–8.81) | 1.19 (0.84–1.68) | 0.84 (0.61–1.17) | 0.50 (0.02–10.22) | 0.84 (0.63–1.13) |
| ≥12 Y | 1.25 (0.97–1.62) | 1.06 (0.25–4.42) | 1.34 (1.00–1.79)* | 0.66 (0.48–0.90)* | 0.37 (0.03–5.39) | 0.72 (0.54–0.95)* |
|
| ||||||
| Region | ||||||
| Gaza | Reference | Reference | Reference | Reference | Reference | Reference |
| West Bank | 1.14 (0.89–1.47) | 2.94 (0.71–12.15) | 1.48 (1.11–1.98)* | 0.96 (0.71–1.28) | 5.88 (0.51–67.52) | 0.76 (0.59–0.99)* |
|
| ||||||
| Area of residency | ||||||
| Rural | Reference | Reference | Reference | Reference | Reference | Reference |
| Urban | 1.29 (1.01–1.63)* | 0.24 (0.03–2.05) | 1.09 (0.84–1.42) | 1.08 (0.82–1.44) | 0.78 (0.07–8.97) | 1.14 (0.89–1.46) |
|
| ||||||
| Marital status | ||||||
| Not married | Reference | Reference | Reference | Reference | Reference | Reference |
| Married | 1.54 (1.11–2.14)* | 1.19 (0.21–6.66) | 1.01 (0.68–1.51) | 1.92 (1.39–2.64)* | 3.05 (0.38–24.16) | 1.22 (0.90–1.64) |
|
| ||||||
| Family income | ||||||
| Average and below | Reference | Reference | Reference | Reference | Reference | Reference |
| Above average | 0.86 (0.69–1.08) | 5.49 (1.10–27.36)* | 0.98 (0.76–1.27) | 1.03 (0.79–1.33) | 11.50 (0.81–163.14) | 0.86 (0.68–1.08) |
|
| ||||||
| Physical activity | ||||||
| Not active | Reference | Reference | Reference | Reference | Reference | Reference |
| Active | 0.87 (0.60–1.26) | 1.04 (0.98–1.1) | 1.10 (0.72–1.69) | 1.55 (0.88–2.71) | 1.23 (1.13–1.35) | 0.80 (0.48–1.34) |
|
| ||||||
| Ever smoked | ||||||
| No | Reference | Reference | Reference | Reference | Reference | Reference |
| Yes | 0.76 (0.60–0.95)* | 1.37 (0.40–4.76) | 1.25 (0.97–1.62) | 0.63 (0.38–1.03) | 1.06 (0.97–1.15) | 0.77 (0.49–1.21) |
4. Discussion
Excess body fat is well documented as being a risk factor for numerous chronic conditions such as diabetes, hypertension, hyperlipidaemia, and cardiovascular diseases [35]. Studies of anthropometric measures among children within Middle Eastern countries have been conducted [22]; however studies of adult populations are limited, with weight and BMI being the most common indicators which have been used to assess overweight and obesity prevalence [19, 20].
This paper presents the results of the first national survey of its kind in Palestine which clearly shows that more than sixty percent of the Palestinian population between 18 and 64 years old are overweight (38.0%) or obese (24.4%). This highlights the emergence of noncommunicable diseases and their risk factors as major contributors to the burden of ill health in the Middle East, particularly among urban populations.
This study shows significant difference (P < 0.001) between the mean BMI for both males (26.12%) and females (27.94%). Females (n = 1653) within the study population showed a significantly higher prevalence of obesity than males (n = 1725) in all age groups except for those aged 18–24 years old. The results also showed that middle age was the period of life where the highest prevalence of overweight/obesity was found. This pattern was expected for the age range of 18 to 55 years old and was similar to other large-population-based studies [24, 29]. The female/male ratio for obesity (1.8) was also found to be similar with those in Saudi Arabia (1.7) and Israeli Arabs (1.8) but higher than several other Middle Eastern countries, such as Israel (1.2) and Lebanon (1.3). Furthermore, as previously reported this increase was found to be more dramatic in urban areas than rural [4, 29, 36, 37].
The steeper BMI-age gradient in the current study was due both to a steeper weight-age gradient as well as less variation in mean heights of comparable age groups. The increase in body weight with age has been attributed to increasing sedentary lifestyle, and the lower heights among older age groups is said to be due to younger cohorts achieving better growth potential because of better nutrition [38]. Furthermore, the larger increases in body weight with age could mean that the changes in physical activity, diet, and lifestyles that are associated with aging have greater negative impact on this group of women. Alternatively this could be due to limited exercising facilities or opportunities for practicing healthier lifestyles within this population group.
The correlation of indices of overall and central obesity is highly suggestive of an association between increased overall obesity (as measured by BMI) with increased visceral fat (WC in this case). We found that mean WC, more than WHR, increased with age in both genders. Similar results were reported in the urban adult population of Israel [37] and Saudi Arabia [4]. It is likely therefore that BMI and WHR provide different measures of almost the same phenomenon.
Visceral fat is more metabolically active than subcutaneous fat and hence may be more deleterious to health [39]. Studies have found a strong association between visceral fat and cardiovascular risk factors [40]. WC is a practical measure of intra-abdominal fat mass [41], and recommendations have been formulated to use it in the identification of people in need of intervention for cardiovascular risk reduction [33, 42, 43]. Many studies have considered WC to be the best anthropometric measurement to determine abdominal obesity-related risks contributing to future cardiovascular disease (CVD) [44, 45]. Another study identified a high correlation between WC and BMI and suggested this could imply that WC is not only an indicator of abdominal adiposity but also overall obesity [46]. While other studies have suggested WHR to be a superior predictor of CVD risk because it includes a measurement of hip circumference, which is inversely associated with dysglycaemia, dyslipidaemia, diabetes, hypertension, CVD, and death [47–49], much debate to determine which of the two (WC or WHR) is the better measurement tool to assess risks on CVD. But it was agreed that both WC and WHR as being stronger predictors of all-cause mortality than BMI [50, 51]. Since BMI is used to measure the general adiposity, it is unable to distinguish between fat mass and lean mass, particularly for men and the elderly [52]. Finally, these two indices on their own, or in combination with BMI, could better capture the health risks of increased adiposity [53].
In Table 3, based on WC, approximately half of the sample is at a greater risk (increased risk and high risk combined 57.8%) of having at least one major risk factor for cardiovascular disease. The high-risk category (37.6%) corresponds with the level at which symptoms of breathlessness [54] and arthritis [55] may begin to develop due to overweight. The group of participants in the increased risk category must be discouraged from further weight gain and an increase in WC towards the high-risk category. In this study, WHR cut-off points indicated that approximately half of the population 47.2% was at an increased risk for cardiovascular disease risk factors which corresponds with other research results [56, 57]. WC seems to identify a greater proportion of the population that is above normal risk compared with WHR.
In men and women adults of Palestine, WC was strongly correlated with BMI (r ≈ 0.7 in men and women, resp.) but showed moderate correlation with WHR (men r = 0.50; women r = 0.46), Table 2. These findings suggest that defining obesity on the base of WC may be an equally or more valid and useful method for use in epidemiological research and clinical practice than BMI or waist-to-hip ratio indices, though further research is needed to demonstrate this unequivocally.
Recently, there has been increasing emphasis, especially in Saudi Arabia, Bahrain, Egypt, Kuwait, Lebanon, and Tunisia, on determining the factors associated with obesity [42, 43, 58]. Food consumption patterns and dietary habits in Palestine and the surrounding Eastern Mediterranean Region have changed markedly during the past 4 decades [38, 59]. Data from the food balance sheet showed an increase in calories consumed during 1971–1997 in the countries of the Region, and a high percentage of these calories came from animal foods [60]. It is probable that the high consumption of foods rich in fats and calories and the sedentary lifestyle among most communities in this Region played an important role in the rise of obesity. This is particularly salient with regard to the shift from traditional foods to more westernized foods, which are characterized by high fat, high cholesterol, high sodium, and low fibre. Nevertheless, in-depth studies on this aspect are few, which mean there is a grave need for establishing a well-designed, community-based study in the Middle Eastern Region.
A review of the literature by Monteiro (2004) concluded that obesity in the developing world is not solely a disease of high SES groups. The risks of obesity within developing countries tend to shift towards the groups of lower SES as that country's GNP increases, and this occurs at an earlier stages of economic development among women over men [61]. As was found in this survey, the World Health Organization (WHO) MONICA (monitoring trends and determinants in cardiovascular disease) Project found that women with lower educational levels faced significantly higher risk of obesity [62] which is consistent with our results (Table 4). The higher levels of obesity among less educated Palestinian women could be attributed to the lower levels of awareness on the risks and health consequences associated with obesity, combined with the belief that fatness is considered culturally desirable in Arab countries.
Regular exercise, though not common practice in this study population, was much less reported by those women categorised as obese. This low physical activity could be attributed to the limited availability of exercising facilities for girls and women in Palestine. Similar findings were also noted in an Iranian study, where it was suggested that a less frequent engagement in leisure physical activity was due to social and religious reasons [63]. Overweight and obesity were found to be higher among married individuals compared with singles after adjusting for other confounding variables. It is hypothesised that marital status could place a heavy burden on those individuals to adjust their physiological rhythms for sleeping and eating, combined with having less time for physical activity along with exposure to other environmental factors [64, 65]. Furthermore, gender was treated as a stratifying variable for all analyses because of the different ways that men and women experience and are affected by marriage [66] and the different ways each gender perceives body weight [67]. More studies are required to examine the factors related to weight gain among married individuals.
Several study limitations must be considered. The cross-sectional design of this study limits any conclusions regarding causal relationships. It is also possible that there are other factors, such as home environment, body image, beliefs and attitudes, lack of health awareness, and cultural conditions, which may be linked with obesity but were not included within this investigation.
Despite these factors, the greatest strength of the current study is the use of a nationally representative sample rather than obese patients seeking medical care or weight loss treatment. In addition, the ability to examine within causal domains adds to the scant knowledge published in this area. Measured height and weight was also a strength that eliminated the chance of misclassification of respondents through self-report of body weight status. However, the data presented here are first-level analyses and require further investigation to formulate recommendations. It can be concluded from this national survey that obesity and overweight are enormous public health problems in Palestine. Within this population, the people at most risk of overweight and obesity are middle-aged (45–54 years old). This risk is especially alarming among Palestinian women.
Considering the global burden of this health problem, the Palestinian Ministry of Health should take the lead responsibility in creating a task force and provide an integrated and consistent proactive approach to addressing overweight and obesity. As well, it should be in charge of the implementation, monitoring, and evaluation of the National Strategy on Obesity in conjunction with all government departments, relevant bodies and agencies, and industry and consumer groups. In cooperation, all these departments and agencies should (1) target the young in the population with preventative strategies, to prevent them becoming the next obese generation, (2) define concrete actions for changing eating behaviours like the use of mass media to influence nutritional norms, practices, and personal choices, (3) provide culturally appropriate health education programs for promoting physical activity especially among Palestinian women, and (4) continuously monitor the numbers of overweight and obese individuals with a national register for obesity.
Acknowledgments
This study was supported by the Al-Quds University and the Belgium government. The authors thank the Palestinian Central Bureau of Statistics for providing the sampling frame and the Greek State Scholarship Foundation for their support to the second author C. Jildeh in her PhD study. H. Al Sabbah is postdoctoral researcher funded by the Fulbright Scholarship, Tufts University, Boston, USA.
References
- 1.Mathers CD, Loncar D. Projections of global mortality and burden of disease from 2002 to 2030. PLoS Medicine. 2006;3(11):2011–2030. doi: 10.1371/journal.pmed.0030442. [DOI] [PMC free article] [PubMed] [Google Scholar]
- 2.Popkin BM. The shift in stages of the nutrition transition in the developing world differs from past experiences! Public Health Nutrition. 2002;5(1):205–214. doi: 10.1079/PHN2001295. [DOI] [PubMed] [Google Scholar]
- 3.McLaren L. Socioeconomic status and obesity. Epidemiologic Reviews. 2007;29(1):29–48. doi: 10.1093/epirev/mxm001. [DOI] [PubMed] [Google Scholar]
- 4.Al-Riyami AA, Afifi MM. Prevalence and correlates of obesity and central obesity among Omani adults. Saudi Medical Journal. 2003;24(6):641–646. [PubMed] [Google Scholar]
- 5.Alsaif MA, Hakim IA, Harris RB, et al. Prevalence and risk factors of obesity and overweight in adult Saudi population. Nutrition Research. 2002;22(11):1243–1252. [Google Scholar]
- 6.Bahrami H, Sadatsafavi M, Pourshams A, et al. Obesity and hypertension in an Iranian cohort study; Iranian women experience higher rates of obesity and hypertension than American women. BMC Public Health. 2006;6, article 158 doi: 10.1186/1471-2458-6-158. [DOI] [PMC free article] [PubMed] [Google Scholar]
- 7.Musaiger AO. Overweight and obesity in the Eastern Mediterranean region: can we control it? Eastern Mediterranean Health Journal. 2004;10(6):789–793. [PubMed] [Google Scholar]
- 8.Kerkadadi A. Evaluation of nutritional status of United Arab Emirates University Female Students. Emirates Journal of Agricultural Sciences. 2003;15(2):42–50. [Google Scholar]
- 9.Hawkes C. Uneven dietary development: linking the policies and processes of globalization with the nutrition transition, obesity and diet-related chronic diseases. Globalization and Health. 2006;2, article 4 doi: 10.1186/1744-8603-2-4. [DOI] [PMC free article] [PubMed] [Google Scholar]
- 10.Hawkes C. The role of foreign direct investment in the nutrition transition. Public Health Nutrition. 2005;8(4):357–365. doi: 10.1079/phn2004706. [DOI] [PubMed] [Google Scholar]
- 11.Haddad LG, Al-Ma'Aitah RM, Umlauf MG. Health Promotion Behaviours among Jordanians. International Quarterly of Community Health Education. 1999:223–235. [Google Scholar]
- 12.Popkin BM, Lu B, Zhai F. Part G. Advances in methodological issues in the use of international food datasets. Understanding the nutrition transition: measuring rapid dietary changes in transitional countries. Public Health Nutrition. 2002;5(6):947–953. doi: 10.1079/PHN2002370. [DOI] [PubMed] [Google Scholar]
- 13.Monteiro CA, Moura EC, Conde WL, Popkin BM. Socioeconomic status and obesity in adult populations of developing countries: a review. Bulletin of the World Health Organization. 2004;82(12):940–946. [PMC free article] [PubMed] [Google Scholar]
- 14.Kalter-Leibovici O, Atamna A, Lubin F, et al. Obesity among Arabs and Jews in Israel: a population-based study. Israel Medical Association Journal. 2007;9(7):525–530. [PubMed] [Google Scholar]
- 15.ARIJ. An Atlas of Palestine. Jerusalem, Palestin: The Applied Research Institute; 2000. [Google Scholar]
- 16.CIA. The world factbook: Gaza Strip and West Bank. Central Intelligence Agency, 2009, https://www.cia.gov/library/publications/the-world-factbook/geos/we.html.
- 17.PCBS. Population in Palestinian Territories: 1997–2025. Ramallah, Palestine: Palestinian Central Bureau of Statistics; 1999. [Google Scholar]
- 18.FAO Corporate Document Repository. Report of the Food Security Assessment, West Bank and Gaza Strip. Agriculture and Consumer Protection Department; 2004. [Google Scholar]
- 19.Abdul-Rahim HF, Abu-Rmeileh NME, Husseini A, Holmboe-Ottesen G, Jervell J, Bjertness E. Obesity and selected co-morbidities in an urban Palestinian population. International Journal of Obesity. 2001;25(11):1736–1740. doi: 10.1038/sj.ijo.0801799. [DOI] [PubMed] [Google Scholar]
- 20.Al-Rifai A, Roudi-Fahimi F. A First Glimpse at the 2004 Palestinian Demographic and Health Survey. Population Reference Bureau; 2006. [Google Scholar]
- 21.Al Sabbah H, Vereecken C, Abdeen Z, Coats E, Maes L. Associations of overweight and of weight dissatisfaction among Palestinian adolescents: findings from the national study of Palestinian schoolchildren (HBSC-WBG2004) Journal of Human Nutrition and Dietetics. 2009;22(1):40–49. doi: 10.1111/j.1365-277X.2008.00901.x. [DOI] [PubMed] [Google Scholar]
- 22.Abdeen Z, Greenough G, Shaheen M, Tayback M. Nutritional Assessment of the West Bank and Gaza Strip. Jerusalem, Palestine: Al-Quds University Publication; 2003. [Google Scholar]
- 23.Al Sabbah H, Vereecken C, Kolsteren P, Abdeen Z, Maes L. Food habits and physical activity patterns among Palestinian adolescents: findings from the national study of Palestinian schoolchildren (HBSC-WBG2004) Public Health Nutrition. 2007;10(7):739–746. doi: 10.1017/S1368980007665501. [DOI] [PubMed] [Google Scholar]
- 24.MOH. Ramallah, Palestine: Palestinian Ministry of Health; 2000. The status of health in Palestine, annual report. Tech. Rep. [Google Scholar]
- 25.Beaglehole R, Ebrahim S, Reddy S, Voûte J, Leeder S. Prevention of chronic diseases: a call to action. Lancet. 2007;370(9605):2152–2157. doi: 10.1016/S0140-6736(07)61700-0. [DOI] [PubMed] [Google Scholar]
- 26.Giacaman R, Khatib R, Shabaneh L, et al. Health status and health services in the occupied Palestinian territory. The Lancet. 2009;373(9666):837–849. [Google Scholar]
- 27.Jubran J. Health and Segregation II: The Impact of Israeli Separation Wall on Access to Health Care Services, An Updated Research. Ramallah, Palestine: Health Development and Information Policy Institute; 2005. [Google Scholar]
- 28.B’tselem. Separation barrier. 2008, http://www.btselem.org/separation_barrier.
- 29.MOH. National Nutrition Strategy, Palestine. Ramallah, Palestine: Palestinian Ministry of Health; 2002. [Google Scholar]
- 30.PCBS. Population Projections, Projected Summary Statistics. Ramallah, Palestine: Palestinian Central Bureau of Statistics; 2002. [Google Scholar]
- 31.World WHO. Geneva, Switzerland: World Health Organization; 1995. Physical status: the use and interpretation of anthropometry: report of a WHO Expert Committee. Tech. Rep. [PubMed] [Google Scholar]
- 32.WHO. Geneva, Switzerland: World Health Organization; 2000. Obesity: preventing and managing the global epidemic. Report of a WHO consultation on obesity. Tech. Rep. [PubMed] [Google Scholar]
- 33.Han TS, van Leer EM, Seidell JC, Lean MEJ. Waist circumference action levels in the identification of cardiovascular risk factors: prevalence study in a random sample. British Medical Journal. 1995;311(7017):1401–1405. doi: 10.1136/bmj.311.7017.1401. [DOI] [PMC free article] [PubMed] [Google Scholar]
- 34.Croft JB, Keenan NL, Sheridan DP, Wheeler FC, Speers MA. Waist-to-hip ratio in a biracial population: measurement, implications, and cautions for using guidelines to define high risk for cardiovascular disease. Journal of the American Dietetic Association. 1995;95(1):60–64. doi: 10.1016/S0002-8223(95)00014-3. [DOI] [PubMed] [Google Scholar]
- 35.Han TS, Williams K, Sattar N, Hunt KJ, Lean MEJ, Haffner SM. Analysis of obesity and hyperinsulinemia in the development of metabolic syndrome: San Antonio Heart Study. Obesity Research. 2002;10(9):923–931. doi: 10.1038/oby.2002.126. [DOI] [PubMed] [Google Scholar]
- 36.Al-Nuaim AR, Al-Rubeaan K, Al-Mazrou Y, Al-Attas O, Al-Daghari N, Khoja T. High prevalence of overweight and obesity in Saudi Arabia. International Journal of Obesity. 1996;20(6):547–552. [PubMed] [Google Scholar]
- 37.MABAT. Tech. Rep. no. 225. Israel Centre for Disease Control; 2003. First Israeli National Health and Nutrition Survey 1999–2001; Part 1. Food & Nutrition Services. [Google Scholar]
- 38.Abdeen Z. The Al-Quds Nutrition and Health Research Institute. Al-Quds University Press; 2004. Palestinian Nutrition- Palestinian Health, results of the First National Palestinian Health and Nutrition Survey 1999-2000 (FNPHANS) [Google Scholar]
- 39.Montague CT, O’Rahilly S. The perils of portliness: causes and consequences of visceral adiposity. Diabetes. 2000;49(6):883–888. doi: 10.2337/diabetes.49.6.883. [DOI] [PubMed] [Google Scholar]
- 40.Sargeant LA, Bennett FI, Forrester TE, Cooper RS, Wilks RJ. Predicting incident diabetes in Jamaica: the role of anthropometry. Obesity Research. 2002;10(8):792–798. doi: 10.1038/oby.2002.107. [DOI] [PubMed] [Google Scholar]
- 41.Pouliot MC, Despres JP, Lemieux S, et al. Waist circumference and abdominal sagittal diameter: best simple anthropometric indexes of abdominal visceral adipose tissue accumulation and related cardiovascular risk in men and women. American Journal of Cardiology. 1994;73(7):460–468. doi: 10.1016/0002-9149(94)90676-9. [DOI] [PubMed] [Google Scholar]
- 42.Zhu S, Wang Z, Heshka S, Heo M, Faith MS, Heymsfield SB. Waist circumference and obesity-associated risk factors among whites in the third National Health and Nutrition Examination Survey: clinical action thresholds. American Journal of Clinical Nutrition. 2002;76(4):743–749. doi: 10.1093/ajcn/76.4.743. [DOI] [PubMed] [Google Scholar]
- 43.NIH. Clinical guidelines on the identification, evaluation, and treatment of overweight and obesity in adults: the evidence report. National Institutes of Health, Obesity Research. 1998;6(supplement 2):51S–209S. [PubMed] [Google Scholar]
- 44.Bjorntorp P. Abdominal fat distribution and the metabolic syndrome. Journal of Cardiovascular Pharmacology. 1992;20(8):S26–S28. [PubMed] [Google Scholar]
- 45.Despres JP, Moorjani S, Lupien PJ, Tremblay A, Nadeau A, Bouchard C. Regional distribution of body fat, plasma lipoproteins, and cardiovascular disease. Arteriosclerosis. 1990;10(4):497–511. doi: 10.1161/01.atv.10.4.497. [DOI] [PubMed] [Google Scholar]
- 46.Reis JP, MacEra CA, Araneta MR, Lindsay SP, Marshall SJ, Wingard DL. Comparison of overall obesity and body fat distribution in predicting risk of mortality. Obesity. 2009;17(6):1232–1239. doi: 10.1038/oby.2008.664. [DOI] [PubMed] [Google Scholar]
- 47.Okura T, Nakata Y, Yamabuki K, Tanaka K. Regional body composition changes exhibit opposing effects on coronary heart disease risk factors. Arteriosclerosis, Thrombosis, and Vascular Biology. 2004;24(5):923–929. doi: 10.1161/01.ATV.0000125702.26272.f6. [DOI] [PubMed] [Google Scholar]
- 48.Heitmann BL, Frederiksen P, Lissner L. Hip circumference and cardiovascular morbidity and mortality in men and women. Obesity Research. 2004;12(3):482–487. doi: 10.1038/oby.2004.54. [DOI] [PubMed] [Google Scholar]
- 49.Bigaard J, Frederiksen K, Tjønneland A, et al. Waist and hip circumferences and all-cause mortality: usefulness of the waist-to-hip ratio? International Journal of Obesity. 2004;28(6):741–747. doi: 10.1038/sj.ijo.0802635. [DOI] [PubMed] [Google Scholar]
- 50.Simpson JA, MacInnis RJ, Peeters A, Hopper JL, Giles GG, English DR. A comparison of adiposity measures as predictors of all-cause mortality: the Melbourne Collaborative Cohort Study. Obesity. 2007;15(4):994–1003. doi: 10.1038/oby.2007.622. [DOI] [PubMed] [Google Scholar]
- 51.Welborn TA, Dhaliwal SS. Preferred clinical measures of central obesity for predicting mortality. European Journal of Clinical Nutrition. 2007;61(12):1373–1379. doi: 10.1038/sj.ejcn.1602656. [DOI] [PubMed] [Google Scholar]
- 52.Romero-Corral A, Somers VK, Sierra-Johnson J, et al. Accuracy of body mass index in diagnosing obesity in the adult general population. International Journal of Obesity. 2008;32(6):959–966. doi: 10.1038/ijo.2008.11. [DOI] [PMC free article] [PubMed] [Google Scholar]
- 53.Pischon T, Boeing H, Hoffmann K, et al. General and abdominal adiposity and risk of death in Europe. New England Journal of Medicine. 2008;359(20):2105–2120. doi: 10.1056/NEJMoa0801891. [DOI] [PubMed] [Google Scholar]
- 54.Von Behren J, Lipsett M, Horn-Ross PL, et al. Obesity, waist size and prevalence of current asthma in the California Teachers Study cohort. Thorax. 2009;64(10):889–893. doi: 10.1136/thx.2009.114579. [DOI] [PMC free article] [PubMed] [Google Scholar]
- 55.Hagen KB, Byfuglien MG, Falzon L, Olsen SU, Smedslund G. Dietary interventions for rheumatoid arthritis. Cochrane Database of Systematic Reviews. 2009;21(1) doi: 10.1002/14651858.CD006400.pub2. Article ID CD006400. [DOI] [PubMed] [Google Scholar]
- 56.Cabrera MAS, Gebara OCE, Diament J, Nussbacher A, Rosano G, Wajngarten M. Metabolic syndrome, abdominal obesity, and cardiovascular risk in elderly women. International Journal of Cardiology. 2007;114(2):224–229. doi: 10.1016/j.ijcard.2006.01.019. [DOI] [PubMed] [Google Scholar]
- 57.Dalton M, Cameron AJ, Zimmet PZ, et al. Waist circumference, waist-hip ratio and body mass index and their correlation with cardiovascular disease risk factors in Australian adults. Journal of Internal Medicine. 2003;254(6):555–563. doi: 10.1111/j.1365-2796.2003.01229.x. [DOI] [PubMed] [Google Scholar]
- 58.Sibai AM, Hwalla N, Adra N, Rahal B. Prevalence and covariates of obesity in Lebanon: findings from the first epidemiological study. Obesity Research. 2003;11(11):1353–1361. doi: 10.1038/oby.2003.183. [DOI] [PubMed] [Google Scholar]
- 59.Musaiger AO. Diet and prevention of coronary heart disease in the Arab Middle East countries. Medical Principles and Practice. 2002;11(supplement 2):9–16. doi: 10.1159/000066415. [DOI] [PubMed] [Google Scholar]
- 60.FOA. Rome, Italy: Food and Agriculture Organization; Food balance sheet. 2000, ftp://ftp.fao.org/docrep/fao/008/J5513e/J5513e00.pdf, Tech. Rep. [Google Scholar]
- 61.Monteiro CA, Moura EC, Conde WL, Popkin BM. Socioeconomic status and obesity in adult populations of developing countries: a review. Bulletin of the World Health Organization. 2004;82(12):940–946. [PMC free article] [PubMed] [Google Scholar]
- 62.Molarius A, Seidell JC, Sans S, Tuomilehto J, Kuulasmaa K. Educational level, relative body weight, and changes in their association over 10 years: an international perspective from the WHO MONICA project. American Journal of Public Health. 2000;90(8):1260–1268. doi: 10.2105/ajph.90.8.1260. [DOI] [PMC free article] [PubMed] [Google Scholar]
- 63.Maddah M, Eshraghian MR, Djazayery A, Mirdamadi R. Association of body mass index with educational level in Iranian men and women. European Journal of Clinical Nutrition. 2003;57(7):819–823. doi: 10.1038/sj.ejcn.1601615. [DOI] [PubMed] [Google Scholar]
- 64.Khan MMH, Kraemer A. Factors associated with being underweight, overweight and obese among ever-married non-pregnant urban women in Bangladesh. Singapore Medical Journal. 2009;50(8):804–813. [PubMed] [Google Scholar]
- 65.Schoenborn CA. Marital status and health: United States, 1999–2002. Center for Disease Control (CDC), Advanced Data from Vital and Health Statistics. (Vol. 351) 2004, http://www.cdc.gov/nchs/data/ad/ad351.pdf. [PubMed]
- 66.Kiecoult-Glaser JK, Newton TL. Marriage and health: his and hers. Psychological Bulletin. 2004;127:472–503. doi: 10.1037/0033-2909.127.4.472. [DOI] [PubMed] [Google Scholar]
- 67.Rodin J, Silberstein LR, Streigel-Moore RH. Women and weight: a normative discontent. In: Sonderegger TB, editor. Nebraska Symposium on Motivation: Psychology and Gender. Lincoln, Neb, USA: University of Nebraska Press; 1985. pp. 267–307. [PubMed] [Google Scholar]