

Abstract
Microsomes are derived mostly from endoplasmic reticulum and are an ideal target to investigate compound metabolism, membrane-bound enzyme functions, lipid-protein interactions, and drug-drug interactions. To better understand the molecular mechanisms of the liver and its diseases, mouse liver microsomes were isolated and enriched with differential centrifugation and sucrose gradient centrifugation, and microsome membrane proteins were further extracted from isolated microsomal fractions by the carbonate method. The enriched microsome proteins were arrayed with two-dimensional gel electrophoresis (2DE) and carbonate-extracted microsome membrane proteins with one-dimensional gel electrophoresis (1DE). A total of 183 2DE-arrayed proteins and 99 1DE-separated proteins were identified with tandem mass spectrometry. A total of 259 nonredundant microsomal proteins were obtained and represent the proteomic profile of mouse liver microsomes, including 62 definite microsome membrane proteins. The comprehensive bioinformatics analyses revealed the functional categories of those microsome proteins and provided clues into biological functions of the liver. The systematic analyses of the proteomic profile of mouse liver microsomes not only reveal essential, valuable information about the biological function of the liver, but they also provide important reference data to analyze liver disease-related microsome proteins for biomarker discovery and mechanism clarification of liver disease.
1. Introduction
The liver, a vital organ, has a wide range of physiological functions and plays a major role in metabolism, biosynthesis, and chemical neutralizing. Liver diseases, such as viral hepatitis and liver cancer, pose a worldwide public health challenge. The Human Liver Proteome Project (HLPP) was launched in 2002 to better understand molecular liver functions and diseases, and liver proteome expression profile is one of the major parts of HLPP [1]. Because of the complexity, no single proteomic analysis strategy can sufficiently address all components of a proteome. Analysis of the subcellular proteome would provide insight into the functions of a given tissue or cell line. Subcellular proteomics reduces the complexity of a proteome [2, 3], detects some low-abundance proteins, and offers more detailed information that would contribute to the understanding of the function of the entire proteome.
Microsomes are composed primarily of closed sacs of membrane called vesicles that are derived mostly from endoplasmic reticulum (ER). As for liver, in addition to components of the protein secretary pathway, microsomes contain a multitude of proteins that are involved in lipid/lipoprotein biosynthesis and drug metabolism. The liver microsome is an ideal way to study the metabolism of compounds, the functional properties of membrane-bound enzymes, lipid-protein interactions, and drug-drug interactions [4, 5]. The proteomic profiling of the microsomes combined with bioinformatics analysis can reveal more essential information about the biological function of the liver. The main goal of this study was to systematically identify the protein components of the liver microsomes, to conduct the functional annotation with bioinformatics analysis, and to provide insight into the biological functions of the liver.
Two-dimensional gel electrophoresis (2DE) is one of the most widespread techniques for the proteomic profiling of soluble proteins and visualizes isoforms and posttranslational modifications in a proteome [6, 7]. Membrane proteins, however, are less amenable to solubilization in protein extraction buffers and are also susceptible to precipitation during isoelectric focusing (IEF) because of their hydrophobicity and alkaline pH value. One study showed that the analytical performance of one-dimensional gel electrophoresis (1DE) that separates endoplasmic reticulum membrane proteins is incomparably greater than that of 2DE [8]. Other studies [7, 9] demonstrated that the proteomic analysis of subcellular organelles, such as microsomes that contain a considerable number of highly hydrophobic membrane proteins, should be performed by combining 1DE and 2DE.
Although many of microsome proteins have been studied, many more remain to be isolated and characterized. With the improvement of current methodologies and experimental techniques, more proteomic data will be obtained. Also, biological interpretation of proteomic data and extracting biological knowledge are essential to further understanding liver function.
In our study, 2DE was first used to array the isolated microsome proteins of the liver. Because of the low performance of 2DE in separating membrane proteins [10] and the high efficiency of the carbonate procedure in separating membrane proteins [11, 12], the membrane proteins from Na2CO3-treated microsomes were separated by 1DE. Moreover, bioinformatics analysis of microsome proteomic data was performed to discover biological roles of the proteins. The results showed that the combination of 1DE and 2DE was more efficient for analyzing microsomes. Bioinformatics analysis can provide a valuable molecular basis to interpret the mechanisms underlying microsome biological functions and give insight into the biological function of the liver at the level of microsomes.
2. Material and Methods
2.1. Animals
Male C57 mice (9 weeks old) were purchased from the Experimental Animal Center of Central South University (Changsha, China). The mice were starved overnight for liver subcellular fractionation. All experiments were performed with the approval of the institutional ethics committee on animal research.
2.2. Preparation, Validation, and 2DE Analysis of Microsomes
2.2.1. Preparation of Microsomes
Microsome apparatus-rich fractions were prepared from mice livers with differential centrifugation and sucrose gradient centrifugation as described [13]. Mice livers (approximately 10 g each) were drained of blood, minced thoroughly with scalpels, and transferred to 50 mL of chilled homogenization medium (0.25 M sucrose, pH 7.4) for 5–10 min with occasional stirring. The liquid was decanted and replaced with 50 mL of fresh homogenization medium followed by homogenization (30–60 sec.) on a TAMATO homogenizer (1,000 rpm × 3 and 1,500 rpm × 3). The homogenate was squeezed through a single layer of microcloth and centrifuged (10 min, 1,000 g; HITACHI centrifuge). The supernatant was centrifuged (30 min, 3,000 g), and sequentially centrifuged (30 min, 8,000 g) after discarding the sediment. The remainder supernatant was centrifuged (30 min, 34,000 g), carefully decanted, and centrifuged again (130,000 g, 1 h; Beckman Instruments, Palo Alto, CA) to get the “light” microsomes. The pink sediment was gently resuspended with a glass homogenizer in ~7 mL of 52% sucrose-0.1 M H3PO4 buffer (pH 7.1), and the density of sucrose was adjusted to 43.7%. The fraction was placed in one type-70i rotor centrifuge tube; overlayered sequentially with 7 mL, 5 mL, 5 mL, and 6 mL of 38.7%, 36.0%, 33.0%, and 29.0% sucrose, respectively, and centrifuged (80,000 g, 1 h). The upper four layers of the sucrose gradient were discarded by aspiration, and the bottom layer (43.7%) was diluted with two volumes of cold distilled water and centrifuged (130,000 g, 1 h) in a type-70i rotor to get the “heavy” microsomes. The pellets, light and heavy microsomes, were suspended in 3 mL of 0.25 M sucrose (pH 7.0) and combined. The mixture was diluted to 14 mL with 0.25 M sucrose containing CsCl with its final concentration of 0.015 M. The suspension was layered into an equal volume of 1.3 M sucrose/0.015 M CsCl and then centrifuged (240,000 g, 1 h) in an SW 55Ti rotor. The rough microsomes were in the pink sediment, and the smooth microsomes were at the interface. The smooth microsomes were diluted with an equal volume of 0.25 M sucrose (pH 7.0) and centrifuged (140,000 g, 1 h) in an SW 55i rotor.
2.2.2. Detection and Validation of the Purity of Microsomes
Electron microscopy and Western blotting were used to detect and validate the purity of prepared microsomes. For electron microscope analysis, the prepared microsomes were fixed with 2.5% glutaraldehyde for 24 h and 2% OsO4 for 2 h, dehydrated with alcohol (50%, 70%, 90%, and 100% in turn), and processed into epoxy resin. Thin sections (500 Å) were prepared and stained with uranyl acetate and lead citrate then examined with a transmission electron microscope (H-600-1, Hitachi, Japan). For Western blotting analysis, the microsome fractions were lysed (4°C; 30 min) in lysis buffer (50 mM Tris-Hcl, 150 mM NaCl, 1 mM EDTA, 1% Triton-X100, and 0.1% SDS). The protein samples (50 μg) were subjected to electrophoresis on SDS-PAGE with 12% gel and transferred to PVDF membrane (Millipore). The PVDF membranes with proteins were immunoblotted with antibodies to endoplasmin (ER marker), OxPhos complex IV subunit I (mitochondrial marker), catalase (peroxisomal marker), and cadherin (cytoplasmic marker), respectively.
2.2.3. Separation of Microsome Proteins by 2DE
2DE was performed as described by the manufacturer (Amersham Biosciences). Protein samples (400 μg) were diluted to 450 μL with rehydration solution (7 mol/L urea, 2 mol/L thiourea, 0.2% DTT, 0.5% (v/v) pH3–10 NL IPG buffer, and trace bromophenol blue) and applied to IPG strips (pH 3–10 NL; 24 cm) for rehydration (14 h; 30 V). Proteins were focused successively (1 h at 500 V, 1 h at 1,000 V, and 8.5 h at 8,000 V) to give a total of 68 kVh on an IPGphor. After equilibration, SDS-PAGE was performed with 12% gel on Ettan DALT II system. Then, the blue silver staining method was used to visualize the protein spots on the 2DE gels [14].
2.3. Na2CO3 Extraction and 1DE Analysis of Microsome Membrane Proteins
Microsome membrane proteins were further extracted by the carbonate method from isolated microsomal fractions [12]. Microsomal fractions were diluted 50- to 1,000-fold with 100 mM sodium carbonate (pH 11.5; final protein concentration to 0.02 to 1 mg/mL), and incubated (0°C; 30 min) with slow stirring and accompanying sonication for 15 sec at 3-4 W at 0 min, 15 min, and 30 min. The suspensions were centrifuged and decanted, and the membrane pellets were gently rinsed three times with ice-cold distilled water. These pellets were diluted with denaturing sample buffer (5% mercaptoethanol, 2% SDS, 0.06 M Tris-HCl, pH 6.8, and 10% glycerol), heated (95°C; 5 min), and then subjected to 1D SDS-PAGE with a 12% gel. Electrophoresis was performed at 80 V for 20 min, followed by 100 V for 2 h. Gels were visualized with Coomassie Brilliant Blue G [14].
2.4. Tandem Mass Spectrometry (MS/MS) Identification of Proteins
2.4.1. In-Gel Digestion
The proteins contained in the 2D gel spots and 1D gel bands were subjected to in-gel digestion with trypsin. Gel spots or bands were excised and destained with 100 mM NH4HCO3 in 50% acetonitrile (ACN) at room temperature. The proteins were reduced with 10 mM dithiothreitol (DDT) (56°C; 30 min) and alkylated with 50 mM iodoacetamide in 100 mM NH4HCO3 (dark, room temperature, 30 min). The gel pieces that contained proteins were dried and then incubated in the digestion solution (40 mM NH4HCO3, 9% ACN, and 20 μg/mL trypsin; 18 h, 37°C). The tryptic peptides were extracted with 50% ACN/2.5% TFA and then dried using a Speed-Vac.
2.4.2. Nanoliquid Chromatography (LC) MS/MS and Protein Identification
The tryptic peptide mixture was fractionated with reverse-phase (RP) high-performance liquid chromatography (HPLC) by using an Ultimate nano-HPLC system (Dionex). Peptide samples were purified and concentrated with a C18-PepMap precolumn and then separated on an analytical C18-PepMap column (75 μm ID × 150 mm, 100 Å pore size, 3 mm particle size) at a column flow rate of 300 nL/min. The ACN gradient (solution A: 0.1% formic acid, 2% ACN; solution B: 0.1% formic acid, 80% ACN) started at 5% B and ended at 70% B in 45 min. Mass spectrometry (MS) and MS/MS data were acquired using a Micromass quadrupole time of flight Micromass spectrometer (Waters). Database searches were carried out with the MASCOT server by using a decoy database (concatenated forward-reverse mouse IPI database, version 3.07; release date June 20, 2005). A mass tolerance of 0.3 Da for both parent (MS) and fragmented (MS/MS) ions, allowance for up to one trypsin miscleavage, variable amino acid modifications consisting of methionine oxidation and cysteine carbamidomethylation were used. MS/MS ion score threshold was determined to produce a false-positive rate less than 5% for a significant hit (P < 0.05). The false-positive rate was calculated with 2* reverse/(reverse + forward)/100. In the current study, the MS/MS ion score threshold was 23 and a false-positive rate was approximately 3.1%. For all the proteins that were identified with only one peptide, each MS/MS spectrum was checked manually.
2.5. Bioinformatics Analysis of Identified Proteins
Protein annotations were obtained primarily from UniProt 7.0 including accession, entry name, comments such as function, catalytic activity, subcellular location, and similarity. The Cytoscape plugin, Biological Networks Gene Ontology (BinGO), was used to find statistically overrepresented GO categories of the protein dataset. An online tool, WebGestalt (http://bioinfo.vanderbilt.edu/webgestalt/), was used to map target proteins to Kyoto Encyclopedia of Genes and Genomes (KEGG) pathways. The pathway visualization was based on the pathway mapping service provided in KEGG.
3. Results
3.1. Characterization and Detection of Liver Microsomes
It was essential to obtain a highly pure fraction to conduct proteomic characterization of microsomes. The purity of prepared microsomes was monitored with electron microscope and Western blotting analysis. A large number of nearly spherical membrane vesicles were visualized with electron microscope without other contaminated organelle compositions (see Supplemental Figure 1(a) in Supplementary Material available online at doi:10.1155/2012/832569). Western blotting analyses showed that, with the standard immunoblotting protocol, the ER marker endoplasmin was enriched in the isolated microsome fractions without the contamination marker (mitochondrial marker OxPhos Complex IV subunit I, peroxisomal marker catalase, and cytoplasmic marker cadherin) being detected (Supplemental Figure 1(b)). The results demonstrated an optimized preparation of microsomes.
3.2. Fractionation and Identification of Microsome Proteins Identified by 2DE and MS/MS
The 2DE reference maps display 514 ± 83 protein spots (n = 10 gels). A representative 2DE map of microsome proteins was shown (Figure 1). A total of 183 proteins were identified with ESI-Q-TOF MS/MS from 204 excised gel spots. Those proteins are summarized (Table 1 and Supplemental Table 1), including 2D gel-spot number, IPI number, protein name, predicted TMD, and subcellular location. The microsomal marker proteins such as endoplasmin (Spot 2) and UDP glucuronosyltransferase (Spots 6 and 7) were identified. Those proteins were located in different subcellular locations (Table 1) including ER, mitochondrial membrane, cytoplasmic, ribosome, microbody, microsome membrane, nuclear, vesicular membrane, sarcolemma, extracellular space, cilium, ER-Golgi intermediate compartment, and secreted proteins. Supplemental Figure 2 shows the percentage of each group of proteins, according to their subcellular locations, derived from the annotations in the Swiss-Prot database and Gene Ontology: 22% of proteins (n = 41) from ER and Golgi, 11% of proteins (n = 20) from mitochondria and other membranes, 50% of proteins (n = 91) from cytosolic and other soluble proteins, 8% of secreted proteins (n = 15), and 9% of proteins without unambiguous location (n = 16).
Figure 1.
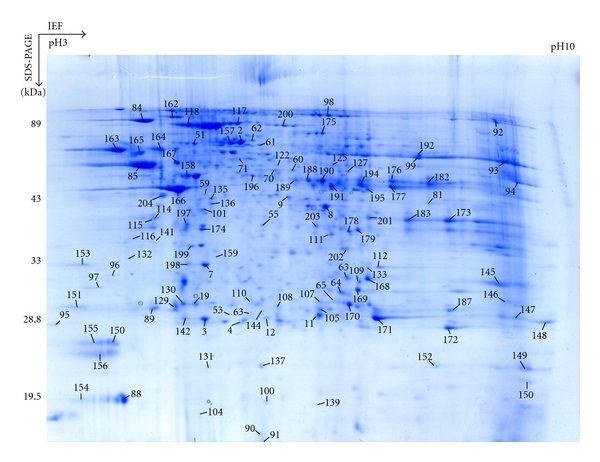
2DE pattern of mouse liver microsome. Microsomal proteins (400 μg) were arrayed by 2DE with IPG strip (pH 3–10 NL; 24 cm) and SDS-PAGE with 12% gel and visualized with blue silver staining method. A total of 204 spots denoted by circles were MS-analyzed.
Table 1.
Proteins identified from mouse liver microsomal preparations with 2DE-based strategy.
| Spot no. | IPIa | Protein name | Predicted TMD | Location |
|---|---|---|---|---|
| 90,91 | IPI00108939 | glyceraldehyde-3-phosphate dehydrogenase, spermatogenic | 0 | ER |
| 6 | IPI00111936 | UDP-glucuronosyltransferase 1-2 precursor, microsomal | 1 | ER |
| 145 | IPI00121833 | Acetyl-coenzyme A acyltransferase 1 | 0 | ER |
| 102 | IPI00622235 | Transitional endoplasmic reticulum ATPase | 0 | ER |
| 6,61,194 | IPI00122815 | Prolyl 4-hydroxylase, beta polypeptide | 0 | ER |
| 17 | IPI00123176 | Similar to glyceraldehyde-3-phosphate dehydrogenase, 37 kDa protein | 0 | ER |
| 134,135 | IPI00123342 | Hypoxia upregulated 1 | 1 | ER |
| 2 | IPI00129526 | Endoplasmin | 0 | ER |
| 139 | IPI00131459 | Nucleoside diphosphate kinase A | 0 | ER |
| 179 | IPI00132874 | Splice isoform 1 of monoglyceride lipase | 0 | ER |
| 163 | IPI00133522 | Protein disulfide-isomerase precursor | 0 | ER |
| 49 | IPI00134058 | Thioredoxin domain containing protein 4 precursor | 0 | ER |
| 108,145,65 | IPI00135284 | Similar to glyceraldehyde-3-phosphate dehydrogenase (GAPDH) ISOFORM 1 | 0 | ER |
| 147,148,149 | IPI00135686 | Mus musculus adult male kidney cDNA, RIKEN full-length enriched library, clone: 0610008 | 1 | ER |
| 174,178,179,183 | IPI00135726 | Similar to glyceraldehyde-3-phosphate dehydrogenase (GAPDH) | 0 | ER |
| 49,50 | IPI00163011 | Thioredoxin domain containing protein 5 precursor | 0 | ER |
| 137 | IPI00226993 | Thioredoxin | 0 | ER |
| 148 | IPI00229551 | ADAM4 | 1 | ER |
| 62,157,158,162 | IPI00230108 | Glucose-regulated protein, full insert sequence | 0 | ER |
| 148 | IPI00271869 | Similar to glyceraldehyde-3-phosphate dehydrogenase (GAPDH) | 0 | ER |
| 146,147,149,150,153 | IPI00273646 | Glyceraldehyde-3-phosphate dehydrogenase | 0 | ER |
| 187 | IPI00555023 | Glutathione S-transferase P 1 | 0 | ER |
| 144 | IPI00319652 | Glutathione peroxidase | 0 | ER |
| 84 | IPI00319992 | 78 kDa glucose-regulated protein precursor | 0 | ER |
| 153 | IPI00320208 | Elongation factor 1-beta | 0 | ER |
| 118 | IPI00323357 | Heat shock cognate 71 kDa protein | 0 | ER |
| 173 | IPI00323661 | Similar to glyceraldehyde-3-phosphate dehydrogenase (GAPDH) | 0 | ER |
| 145,201 | IPI00462605 | Similar to glyceraldehyde-3-phosphate dehydrogenase (GAPDH) | 0 | ER |
| 127 | IPI00469307 | Alpha-2-macroglobulin receptor-associated protein precursor | 0 | ER |
| 143,152,203 | IPI00480343 | 2700050F09Rik protein | 0 | ER |
| 162 | IPI00831714 | Leucine-rich repeat-containing protein 7 | 0 | ER (integral to membrane) |
| 149,150 | IPI00352124 | Flavin containing monooxygenase 5 | 1 | ER (integral to membrane) |
| 131 | IPI00132397 | GTP-binding protein SAR1b | 0 | ER (peripheral membrane protein) |
| 107 | IPI00227657 | Stromal cell-derived factor 2-like protein 1 precursor | 0 | ER lumen |
| 145 | IPI00123281 | Expressed sequence AA959742 | 1 | ER membrane |
| 7 | IPI00222496 | Protein disulfide isomerase-associated 6 | 1 | ER, membrane proteinb |
| 7 | IPI00112322 | UDP-glucuronosyltransferase 2B5 precursor | 1 | ER, membrane proteinsb |
| 156 | IPI00331322 | Microsomal glutathione S-transferase 1 | 3 | ER, outer membrane |
| 151 | IPI00319973 | Membrane-associated progesterone receptor component 1 | 1 | ER, membrane-bound |
| 152 | IPI00170316 | Multiple coagulation factor deficiency protein 2 homolog precursor | 0 | ER-Golgi intermediate compartment |
| 170 | IPI00408892 | RAS-related protein RAB-7 | 0 | Golgi, endosomes, lysosomes |
| 153 | IPI00123316 | Splice isoform 1 of tropomyosin 1 alpha chain | 0 | Cytoplasm |
| 116 | IPI00133456 | Senescence marker protein-30 | 0 | Cytoplasm |
| 89,129,130,151,152 | IPI00135085 | Heme-binding protein | 0 | Cytoplasm |
| 165 | IPI00109061 | Tubulin beta-4 chain homolog | 0 | Cytoplasmic |
| 88 | IPI00109073 | Tubulin beta-4 chain | 0 | Cytoplasmic |
| 105,138 | IPI00110753 | Tubulin alpha-1 chain | 0 | Cytoplasmic |
| 113,166,167,197,204 | IPI00110827 | Actin, alpha skeletal muscle | 0 | Cytoplasmic |
| 9,129,130,151.153,166, 167,197,198 |
IPI00110850 | Actin, cytoplasmic 1 | 0 | Cytoplasmic |
| 90 | IPI00114162 | Fatty acid-binding protein, epidermal | 0 | Cytoplasmic |
| 145 | IPI00116277 | T-complex protein 1, delta subunit | 0 | Cytoplasmic |
| 144 | IPI00117264 | DJ-1 protein | 0 | Cytoplasmic |
| 191,164,165 | IPI00117348 | Tubulin alpha-2 chain | 0 | Cytoplasmic |
| 137,138,164 | IPI00117350 | Tubulin alpha-4 chain | 0 | Cytoplasmic |
| 141,153,165,132 | IPI00117352 | Tubulin beta-5 chain | 0 | Cytoplasmic |
| 126 | IPI00117914 | Arginase 1 | 0 | Cytoplasmic |
| 152 | IPI00120532 | 21 kDa protein | 0 | Cytoplasmic |
| 107,108,139,143,182 | IPI00125489 | 44 KD protein (Argininosuccinate synthase) | 0 | Cytoplasmic |
| 191 | IPI00626790 | Glutamine synthetase | 0 | Cytoplasmic |
| 176,182,194 | IPI00130950 | Betaine-homocysteine S-methyltransferase | 0 | Cytoplasmic |
| 99 | IPI00131204 | UDP-glucose pyrophosphorylase 2 | 0 | Cytoplasmic |
| 204 | IPI00136929 | Gamma actin-like protein | 0 | Cytoplasmic |
| 101,132 | IPI00169463 | Tubulin beta-2C Chain | 0 | Cytoplasmic |
| 202,133 | IPI00221400 | Alcohol dehydrogenase A chain | 0 | Cytoplasmic |
| 89 | IPI00221528 | Actin, cytoplasmic type 5 homolog | 0 | Cytoplasmic |
| 168 | IPI00221890 | Carbonic anhydrase III | 0 | Cytoplasmic |
| 202,133 | IPI00317740 | Guanine nucleotide-binding protein beta subunit 2-like 1 | 0 | Cytoplasmic |
| 159 | IPI00331174 | T-complex protein 1, eta subunit | 0 | Cytoplasmic |
| 154 | IPI00338039 | Tubulin, beta 2 | 0 | Cytoplasmic |
| 141 | IPI00348094 | Predicted: similar to tubulin M beta 1 | 0 | Cytoplasmic |
| 136 | IPI00404011 | Microtubule-associated protein | 0 | Cytoplasmic |
| 153 | IPI00421223 | Tropomyosin alpha 4 chain | 0 | Cytoplasmic |
| 194,195 | IPI00457825 | Similar to argininosuccinate synthase (Citrulline-aspartate ligase) | 0 | Cytoplasmic |
| 60 | IPI00462072 | Similar to alpha enolase (2-phospho-D-glycerate hydro-lyase) | 0 | Cytoplasmic |
| 178 | IPI00467066 | Glycine N-methyltransferase | 0 | Cytoplasmic |
| 63,109 | IPI00467833 | Triosephosphate isomerase | 0 | Cytoplasmic |
| 153 | IPI00605380 | Similar to tubulin alpha-2 chain (Alpha-tubulin 2) | 0 | Cytoplasmic |
| 162 | IPI00123313 | Ubiquitin-activating enzyme E1 1 | 0 | Cytoplasmic and nuclear |
| 64 | IPI00420745 | Proteasome subunit, alpha type 2, full insert sequence | 0 | Cytoplasmic and nuclear |
| 145 | IPI00320165 | Oxidoreductase HTATIP2 | 0 | Cytoplasmic and nuclear |
| 153 | IPI00117978 | Cytochrome c oxidase subunit IV isoform 1, mitochondrial precursor | 1 | Mitochondrial inner membrane |
| 19 | IPI00109167 | NADH-ubiquinone oxidoreductase 24 kDa subunit | 0 | Mitochondrial inner membrane |
| 158 | IPI00111885 | Ubiquinol-cytochrome-c reductase complex core protein I, mitochondrial precursor | 0 | Mitchondrial inner membrane |
| 175 | IPI00121322 | Electron transfer flavoprotein-ubiquinone oxidoreductase, mitochondrial precursor | 0 | Mitchondrial inner membrane |
| 196 | IPI00128023 | NADH-ubiquinone oxidoreductase 49 kDa subunit, mitochondrial precursor | 0 | Mitchondrial inner membrane |
| 134 | IPI00111908 | Predicted: carbamoyl-phosphate synthetase 1 | 0 | Mitochondrial |
| 145 | IPI00114840 | Endonuclease G, mitochondrial precursor | 0 | Mitochondrial |
| 70 | IPI00331555 | 2-oxoisovalerate dehydrogenase alpha subunit, mitochondrial precursor | 0 | Mitochondrial |
| 94,95 | IPI00115607 | Trifunctional enzyme beta subunit, mitochondrial precursor | 0 | Mitochondrial |
| 145 | IPI00115824 | NipSnap1 protein | 0 | Mitochondrial |
| 22 | IPI00116154 | Cytochrome c oxidase, subunit vb, full insert sequence | 0 | Mitochondrial |
| 15,146,147,148,149,100 | IPI00118986 | ATP synthase oligomycin sensitivity conferral protein, mitochondrial precursor | 0 | Mitochondrial |
| 127 | IPI00119138 | Ubiquinol-cytochrome-c reductase complex core protein 2, mitochondrial precursor | 0 | Mitochondrial |
| 147,148 | IPI00120984 | NADH-ubiquinone oxidoreductase 19 kDa subunit | 0 | Mitochondrial |
| 137 | IPI00129516 | Ubiquinol-cytochrome c reductase complex 11 kDa protein, mitochondrial precursor | 0 | Mitochondrial |
| 93,99,100,192,203 | IPI00130280 | ATP synthase alpha chain, mitochondrial precursor | 0 | Mitochondrial |
| 149,150 | IPI00132217 | Tetratricopeptide repeat protein 11 | 1 | Mitochondrial |
| 150,151 | IPI00132390 | NADH-ubiquinone oxidoreductase B15 subunit | 1 | Mitochondrial |
| 101,132,137,141,153 | IPI00170093 | NADH-ubiquinone oxidoreductase 23 kDa subunit, mitochondrial precursor | 0 | Mitochondrial |
| 92,93,94,95,96 | IPI00223092 | Hydroxyacyl-coenzyme A dehydrogenase/3-ketoacyl-coenzyme A | 0 | Mitochondrial |
| 142,143,152 | IPI00230507 | ATP synthase D chain, mitochondrial | 0 | Mitochondrial |
| 162 | IPI00308882 | NADH-ubiquinone oxidoreductase 75 kDa subunit, mitochondrial precursor | 0 | Mitochondrial |
| 149 | IPI00344004 | 13 KDa differentiation-associated protein | 0 | Mitochondrial |
| 145,146 | IPI00420718 | Hydroxymethylglutaryl-CoA synthase, mitochondrial precursor | 0 | Mitochondrial |
| 51 | IPI00308885 | 60 kDa heat shock protein, mitochondrial | 0 | Mitochondrial |
| 153 | IPI00462250 | Similar to adenine nucleotide translocase | 3 | Mitochondrial |
| 85,165,167,203 | IPI00468481 | ATP synthase beta chain, mitochondrial precursor | 0 | Mitochondrial |
| 147 | IPI00117281 | Phospholipid hydroperoxide glutathione peroxidase, mitochondrial precursor | 0 | Mitochondrial and cytoplasmic |
| 169 | IPI00133240 | Ubiquinol-cytochrome c reductase iron-sulfur subunit, mitochondrial precursor | 0 | Mitochondrial inner membrane |
| 200,201 | IPI00230351 | Succinate dehydrogenase [ubiquinone] flavoprotein subunit, mitochondrial precursor | 0 | Mitochondrial inner membrane |
| 174 | IPI00132042 | Pyruvate dehydrogenase E1 component beta subunit, mitochondrial precursor | 0 | Mitochondrial matrix |
| 156 | IPI00315794 | Cytochrome b5 outer mitochondrial membrane isoform precursor | 1 | Mitochondrial outer membrane |
| 65,109,144,170,176,100 | IPI00134746 | Argininosuccinate synthase | 0 | mitochondrion |
| 145,146 | IPI00338536 | Succinate dehydrogenase [ubiquinone] iron-sulfur protein, mitochondrial precursor | 0 | Mitochondrion |
| 112 | IPI00122547 | Voltage-dependent anion-selective channel protein 2 | 0 | Mitochondrion outer membrane |
| 147 | IPI00131186 | Splice isoform 2 of transcription factor BTF3 | 0 | Nuclear |
| 149 | IPI00317794 | Nucleolin | 0 | Nuclear |
| 53 | IPI00331146 | UMP-CMP kinase | 0 | Nuclear |
| 150 | IPI00458856 | Similar to ZNF91L isoform 1 | 0 | Nuclear |
| 6 | IPI00461822 | E1A binding protein p300 | 0 | Nuclear |
| 55 | IPI00126172 | RIKEN cDNA 4931406C07, PTD012 homolog | 0 | Nuclear |
| 150,151 | IPI00113241 | 40S ribosomal protein S19 | 0 | Ribosome |
| 104 | IPI00116908 | Similar to 40 s ribosomal protein S12 | 0 | Ribosome |
| 147 | IPI00849793 | 60S ribosomal protein L12 | 0 | Ribosome |
| 81,127,145 | IPI00125971 | 26S protease regulatory subunit S10B | 0 | Ribosome |
| 199 | IPI00123604 | 40S ribosomal protein SA | 0 | Ribosome |
| 125 | IPI00135640 | 26S protease regulatory subunit 8 | 0 | Ribosome |
| 149,150,151 | IPI00139780 | 60S ribosomal protein L23 | 0 | Ribosome |
| 149,150 | IPI00222546 | 60S ribosomal protein L22 | 0 | Ribosome |
| 145 | IPI00314950 | 60S acidic ribosomal protein P0 | 0 | Ribosome |
| 149 | IPI00322562 | 40S ribosomal protein S14 | 0 | Ribosome |
| 146 | IPI00331092 | 40S ribosomal protein S4, X isoform | 0 | Ribosome |
| 149,150 | IPI00331461 | 60S ribosomal protein L11 | 0 | Ribosome |
| 188 | IPI00351894 | Similar to ribosomal protein | 0 | Ribosome |
| 148 | IPI00849793 | 60S ribosomal protein L12 | 0 | Ribosome |
| 149 | IPI00465880 | 40S ribosomal protein S17 | 0 | Ribosome |
| 199 | IPI00123604 | 40S ribosomal protein SA | 0 | Ribosome |
| 4,11 | IPI00121209 | Apolipoprotein A-I precursor | 0 | Secreted |
| 149 | IPI00121837 | Ribonuclease 4 precursor | 1 | Secreted |
| 12 | IPI00122429 | Plasma retinol-binding protein precursor | 0 | Secreted |
| 163 | IPI00123920 | Alpha-1-antitrypsin 1–3 precursor | 0 | Secreted |
| 163 | IPI00123924 | Alpha-1-antitrypsin 1–4 precursor | 0 | Secreted |
| 163 | IPI00123927 | Alpha-1-antitrypsin 1–5 precursor | 0 | Secreted |
| 162 | IPI00128484 | Hemopexin precursor | 1 | Secreted |
| 3,117,118 | IPI00131695 | Serum albumin precursor | 0 | Secreted |
| 98 | IPI00139788 | Serotransferrin precursor | 0 | Secreted |
| 199 | IPI00323571 | Apolipoprotein E precursor | 0 | Secreted |
| 135,136 | IPI00377351 | Apolipoprotein A-IV precursor | 0 | Secreted |
| 163 | IPI00406302 | Alpha-1-antitrypsin 1-1 precursor | 0 | Secreted |
| 100,155,156 | IPI00466399 | 21 kDa protein | 0 | Secreted |
| 156 | IPI00480401 | Major urinary protein 1 precursor | 0 | Secreted |
| 122 | IPI00130661 | Tripeptidyl-peptidase I precursor | 0 | Secreted (lysosomal) |
| 101 | IPI00115302 | Branched chain ketoacid dehydrogenase E1, beta polypeptide | 0 | Membrane |
| 197 | IPI00120716 | Guanine nucleotide-binding protein G(I)/G(S)/G(T) beta subunit 1 | 0 | Membrane |
| 21,137 | IPI00120719 | Cytochrome c oxidase, subunit va, full insert sequence | 0 | Membrane |
| 125 | IPI00124790 | Polyposis locus protein 1-like 1 | 3 | Membrane |
| 129 | IPI00132076 | Catechol O-methyltransferase | 1 | Membrane |
| 130,142 | IPI00138406 | Ras-related protein Rap-1A | 0 | Membrane |
| 174 | IPI00162780 | Guanine nucleotide-binding protein G(I)/G(S)/G(T) beta subunit 2 | 0 | Membrane |
| 88,154 | IPI00230113 | Cytochrome b5 | 1 | Membrane |
| 199,200 | IPI00353727 | Annexin A4 | 0 | Membrane |
| 110 | IPI00117416 | Neighbor of COX4 | 0 | Unknown |
| 143 | IPI00121271 | Hypothetical S-adenosyl-L-methionine-dependent methyltransferases structure containing protein | 0 | Unknown |
| 144,108 | IPI00267667 | RIKEN cDNA 6330409N04, CLLL6 protein homolog | 0 | Unknown |
| 101 | IPI00269613 | Eukaryotic translation initiation factor 3 subunit 2 | 0 | Unknown |
| 149,150 | IPI00307837 | 51 kDa protein | 0 | Unknown |
| 203 | IPI00318204 | Sid6061p | 0 | Unknown |
| 105 | IPI00273646 | Similar to glyceraldehyde-3-phosphate dehydrogenase | 0 | Unknown |
| 189,190,194 | IPI00626790 | Glutamine synthetase | 0 | Unknown |
| 50 | IPI00345842 | 86 KDa PROTEIN | 0 | Unknown |
| 51 | IPI00350780 | 45 kDa protein | 0 | Unknown |
| 133 | IPI00381231 | 77 KDa protein | 0 | Unknown |
| 144 | IPI00923085 | Probable ubiquitin-conjugating enzyme E2 FLJ25076 homolog | 0 | Unknown |
| 146,147,150,173 | IPI00460295 | 44 KDa protein | 0 | Unknown |
| 156 | IPI00330913 | Major urinary protein 26 | 0 | Unknown |
| 59 | IPI00467988 | 169 kDa protein | 0 | Unknown |
| 100,155,156 | IPI00469517 | 21 kDa protein | 0 | Unknown |
| 149 | IPI00130554 | Splice isoform 1 of SNARE-associated protein Snapin | 0 | Vesicular membrane |
| 101,127,134 | IPI00131366 | Keratin, type II cytoskeletal 6B | 0 | Sarcolemma |
| 83,106,107 | IPI00121788 | Peroxiredoxin 1 | 0 | Microbody |
| 101,139 | IPI00348328 | Keratin Kb40 | 0 | Intermediate filament |
| 156 | IPI00137414 | Left-right dynein | 0 | Cilium |
aESI-Q-TOF identification, subcellular location are given for each ID number.
bThis protein is nonmembrane associated according to the annotation in the Swiss-Prot database but has one predicted TMD.
3.3. Fractionation and Identification of Microsomal Membrane Proteins Identified by 1DE and MS/MS
The Na2CO3-treated microsome membrane proteins were separated on SDS-PAGE gels and visualized with Coomassie brilliant blue staining (Figure 2(a)). A total of 99 proteins (Table 2 and Supplemental Table 2) was identified with electrospray ionization- (ESI-) Q-TOF MS/MS from 17 gel bands (Figure 2(a)). Those proteins were derived from the ER, type I/II membrane proteins, integral membrane proteins, major histocompatibility complex class I protein, ER-Golgi intermediate compartment, mitochondrial membrane, nuclear, cytoplasm, microbody, sarcolemma, and secreted and unknown proteins (Table 2). Those membrane proteins were classified into three categories (Figure 2(b)): (a) proteins with known membrane associations (55%; n = 54), (b) putative membrane proteins (5%; n = 5), and (c) other proteins (40%; n = 40). Those identified proteins were categorized according to the reported annotation in the UniProt database (http://www.uniprot.org/) and predictions for transmembrane regions (http://www.cbs.dtu.dk/services/TMHMM/). Of the 99 proteins, 59 (60%) were described as “membrane-associated” proteins (category (a) and (b)), including ER-characteristic proteins (cytochromes P-450 and b5, calnexin, integral membrane enzymes such as NADPH-cytochrome c reductase, and microsomal glutathione S-transferase 1).
Figure 2.
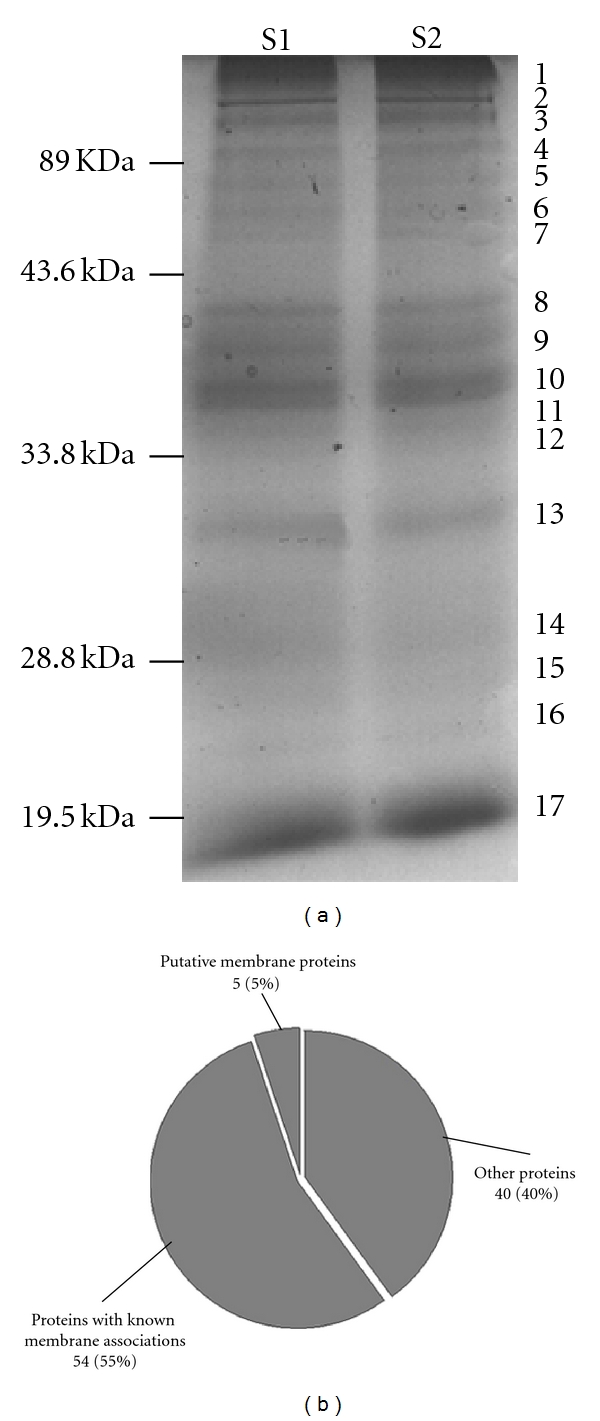
1DE pattern and membrane-associated characteristic classification of Na2CO3-extracted microsomal membrane proteins. (a) 1DE pattern. Molecular weight markers are shown on the left and bands excised for MS analysis are indicated on the right. Lanes S1 and S2 were loaded with the same protein samples (50 μg per lane). (b) Classification via membrane-associated characteristic. The criteria used for this classification were published reports, annotations in the genome database (http://www.uniprot.org/), and predictions for transmembrane regions (http://www.cbs.dtu.dk/services/TMHMM/).
Table 2.
Proteins identified from Na2CO3-extracted mouse liver microsomal membrane preparations with 1DE-based strategy.
| Bands no. | Accession no. | Protein name | Predicted TMD | GRAVY score | PI value | Subcellular location |
|---|---|---|---|---|---|---|
| 9 | IPI00112322 | UDP-glucuronosyltransferase 2B5 precursor | 1 | −0.031 | 7.94 | ER |
| 9 | IPI00127223 | UDP glucuronosyltransferase 2 family, polypeptide B36 | 1 | −0.036 | 8.47 | ER |
| 9 | IPI00222496 | Protein disulfide-isomerase A6 | 1 | −0.292 | 5.05 | ER |
| 8 | IPI00417182 | UDP-glycosyltransferase 1 family polypeptide A5 | 1 | 0.044 | 8.33 | ER |
| 9 | IPI00116572 | Cytochrome P450, family 2, subfamily d, polypeptide 9 | 2 | −0.043 | 6.37 | ER |
| 15 | IPI00113655 | 40S ribosomal protein S6 | 0 | −0.918 | 10.68 | ER |
| 5 | IPI00129526 | Endoplasmin precursor (ER protein 99,94 kDa glucose-regulated protein) | 0 | −0.72 | 4.74 | ER |
| 13 | IPI00130985 | Short-chain dehydrogenase CRAD2 | 0 | 0.026 | 8.35 | ER |
| 6 | IPI00222809 | Similar to GDH/6PGL endoplasmic bifunctional protein | 0 | −0.18 | 6.61 | ER |
| 8 | IPI00230108 | Glucose-regulated protein, full insert sequence | 0 | −0.479 | 5.78 | ER |
| 10,11 | IPI00317356 | Paraoxonase 1 | 0 | −0.01 | 5.02 | ER |
| 7 | IPI00319992 | 78 kDa glucose-regulated protein precursor | 0 | −0.481 | 5.07 | ER |
| 13 | IPI00121079 | NADH-cytochrome b5 reductase 3 | 0 | −0.203 | 8.56 | ER, membrane bound |
| 9 | IPI00123964 | Cytochrome P450 2A5 | 1 | −0.203 | 9.23 | ER, membrane bound |
| 9 | IPI00114779 | Cytochrome P450 2C38 | 0 | −0.147 | 8.69 | ER, membrane bound |
| 17 | IPI00331322 | Microsomal glutathione S-transferase 1 | 3 | 0.14 | 9.67 | ER and mitochondrial outer membrane |
| 17 | IPI00119766 | Cis-retinol androgen dehydrogenase 1 | 0 | 0.005 | 9.25 | ER lumen |
| 8 | IPI00134691 | UDP-glucuronosyltransferase 1-1 precursor, microsomal | 2 | 0.087 | 8.87 | ER, integral to plasma membrane |
| 8 | IPI00128287 | Cytochrome P450 1A2 | 1 | −0.203 | 8.92 | ER, membrane bound |
| 10 | IPI00136910 | Cytochrome P450 2D11 | 2 | −0.009 | 6.15 | ER, membrane bound |
| 9 | IPI00308328 | Cytochrome P450 2F2 | 1 | −0.135 | 7.74 | ER, membrane bound |
| 9,10 | IPI00323908 | Cytochrome P450 2D10 | 2 | −0.073 | 6.16 | ER, membrane bound |
| 7 | IPI00112549 | Long-chain-fatty-acid-CoA ligase 1 | 1 | −0.045 | 6.81 | ER, type III membrane protein |
| 8 | IPI00133522 | Protein disulfide-isomerase precursor | 0 | −0.386 | 4.79 | ER |
| 9 | IPI00116572 | Cytochrome P450 2D9 | 0 | −0.063 | 5.93 | ER, membrane bound |
| 5,6 | IPI00119618 | Calnexin precursor | 1 | −0.875 | 4.5 | ER, type I membrane protein |
| 1,10,12,14,15 | IPI00319973 | Membrane-associated progesterone receptor component 1 | 1 | −0.616 | 4.57 | ER, membrane bound |
| 8 | IPI00132475 | Protein ERGIC-53 | 1 | −0.545 | 5.92 | ER-Golgi intermediate compartment (ERGIC), type I membrane protein |
| 8,17 | IPI00109061 | Tubulin beta-4 chain homolog | 0 | −0.406 | 4.78 | Cytoplasmic |
| 10 | IPI00110827 | Actin, alpha skeletal muscle | 0 | −0.232 | 5.23 | Cytoplasmic |
| 10,12,14 | IPI00110850 | Actin, cytoplasmic 1 | 0 | −0.2 | 5.29 | Cytoplasmic |
| 1,2,3 | IPI00111908 | Carbamoyl-phosphate synthase | 0 | −0.12 | 6.42 | Cytoplasmic |
| 1,8,9,13 | IPI00117348 | Tubulin alpha-2 chain | 0 | −0.23 | 4.94 | Cytoplasmic |
| 9,10,11,12,13 | IPI00117914 | Arginase 1 | 0 | −0.187 | 6.52 | Cytoplasmic |
| 17 | IPI00120451 | Fatty acid-binding protein, liver | 0 | −0.409 | 8.59 | Cytoplasmic |
| 9 | IPI00129028 | Similar to tubulin, alpha 3C isoform 1 | 0 | −0.204 | 4.98 | Cytoplasmic |
| 1–11,13,17 | IPI00130950 | Betaine-homocysteine S-methyltransferase | 0 | −0.36 | 8.01 | Cytoplasmic |
| 1,4,6,10,11,14,15 | IPI00134746 | Argininosuccinate synthase | 0 | −0.361 | 8.36 | Cytoplasmic |
| 3,4 | IPI00114710 | Pyruvate carboxylase, mitochondrial precursor | 0 | −0.173 | 6.25 | Mitochondrial |
| 17 | IPI00553333 | Hemoglobin subunit beta-1 | 0 | 0.092 | 7.13 | Mitochondrial |
| 9 | IPI00134809 | Dihydrolipoyllysine-residue succinyltransferase component of 2-oxoglutarate dehydrogenase complex | 0 | −0.171 | 9.1 | Mitochondrial |
| 17 | IPI00117978 | Cytochrome c oxidase subunit IV isoform 1, mitochondrial precursor | 1 | −0.412 | 9.25 | Mitochondrial inner membrane |
| 15,16 | IPI00315794 | Cytochrome b5 outer mitochondrial membrane isoform precursor | 1 | −0.602 | 4.79 | Mitochondrial outer membrane |
| 13 | IPI00321718 | Prohibitin-2 | 0 | −2.58 | 9.83 | Mitochondrial, cytoplasmic, nuclear |
| 13 | IPI00122547 | Voltage-dependent anion-selective channel protein 2 | 0 | −0.223 | 7.44 | Outer mitochondrial Membrane |
| 17 | IPI00114559 | Histone H2A type 1 | 0 | −0.572 | 11.22 | Nuclear |
| 16,17 | IPI00114642 | Histone H2B F | 0 | −0.762 | 10.32 | Nuclear |
| 8 | IPI00387318 | Cell cycle control protein 50A | 2 | −0.331 | 8.58 | Membrane |
| 15 | IPI00113849 | Splice isoform 2 of cell division control protein 42 homolog | 0 | −0.157 | 6.16 | Membrane |
| 13 | IPI00122549 | Splice isoform Pl-VDAC1 of voltage-dependent anion-selective channel protein 1 | 0 | −0.334 | 8.55 | Membrane |
| 15 | IPI00127408 | Ras-related C3 botulinum substrate 1 | 0 | −0.101 | 8.77 | Membrane |
| 15 | IPI00138406 | Ras-related protein Rap-1A | 0 | −0.375 | 6.39 | Membrane |
| 6 | IPI00116921 | Scavenger receptor class B member 1 | 2 | 0.073 | 8.29 | Integral membrane protein |
| 1 | IPI00121985 | Splice Isoform 1 of solute carrier organic anion transporter family, member 1B2 | 12 | 0.172 | 8.95 | Integral membrane protein |
| 9 | IPI00124830 | Integrin-associated protein precursor | 5 | 0.563 | 8.58 | Integral membrane protein |
| 14,15 | IPI00131176 | Cytochrome c oxidase subunit 2 | 2 | 0.27 | 4.6 | Integral membrane protein |
| 1 | IPI00132604 | Secretedretory carrier-associated membrane protein 3 | 4 | 0.028 | 7.55 | Integral membrane protein |
| 1 | IPI00135701 | Solute carrier organic anion transporter family, member 1A1 | 11 | 0.244 | 8.58 | Integral membrane protein |
| 1 | IPI00311682 | Sodium/potassium-transporting ATPase alpha-1 chain precursor | 10 | 0.002 | 5.3 | Integral membrane protein |
| 6 | IPI00331214 | Platelet glycoprotein IV | 2 | −0.053 | 8.61 | Integral membrane protein |
| 2 | IPI00119063 | Prolow-density lipoprotein receptor-related protein 1 | 1 | −0.502 | 5.17 | Integral to membrane |
| 1,12,16,17 | IPI00124790 | Polyposis locus protein 1-like 1 | 3 | 0.375 | 6.82 | Integral to membrane |
| 10 | IPI00129677 | Asialoglycoprotein receptor major subunit | 1 | −0.66 | 5.99 | Integral to membrane |
| 17 | IPI00467119 | Camello-like protein 1 | 1 | 0.302 | 9.61 | Integral to membrane |
| 5,8 | IPI00316329 | Keratin, type II cytoskeletal 1 | 0 | −0.588 | 8.2 | Intermediate filament |
| 10,11,12 | IPI00108844 | Cation-dependent mannose-6-phosphate receptor precursor | 1 | −0.168 | 5.24 | Type I membrane protein |
| 9 | IPI00109998 | H-2 class I histocompatibility antigen, D-B alpha chain precursor | 1 | −0.508 | 6.28 | Type I membrane protein |
| 4 | IPI00120245 | Integrin alpha-V precursor | 1 | −0.246 | 5.46 | Type I membrane protein |
| 3,4 | IPI00121190 | Epidermal growth factor receptor precursor | 2 | −0.316 | 6.46 | Type I membrane protein |
| 2 | IPI00126186 | Macrophage mannose receptor 1 precursor | 1 | −0.5 | 6.47 | Type I membrane protein |
| 5 | IPI00134549 | Splice isoform LAMP-2A of lysosome-associated membrane glycoprotein 2 precursor | 1 | −0.036 | 7.05 | Type I membrane protein |
| 13 | IPI00312018 | Malectin | 1 | −0.203 | 5.73 | Type I membrane protein |
| 3 | IPI00312063 | Low-density lipoprotein receptor precursor | 1 | −0.391 | 4.88 | Type I membrane protein |
| 16 | IPI00466570 | Transmembrane emp24 domain-containing protein 10 | 2 | −0.169 | 6.25 | Type I membrane protein |
| 4 | IPI00108535 | Carcinoembryonic antigen-related cell adhesion molecule 1 | 1 | −0.302 | 5.35 | Type I membrane protein |
| 5 | IPI00310059 | Polymeric-immunoglobulin receptor precursor | 1 | −0.499 | 5.26 | Type I membrane protein also secreted |
| 9 | IPI00121550 | Sodium/potassium-transporting ATPase beta-1 chain | 1 | −0.55 | 8.83 | Type II membrane protein |
| 2,3 | IPI00134585 | Glutamyl aminopeptidase | 1 | −0.344 | 5.28 | Type II membrane protein |
| 10 | IPI00307966 | ADP-ribosyl cyclase 1 | 1 | −0.106 | 8.64 | Type II membrane protein |
| 3 | IPI00319509 | Aminopeptidase N | 1 | −0.277 | 5.62 | Type II membrane protein |
| 3 | IPI00458003 | Ectonucleotide pyrophosphatase/phosphodiesterase 3 | 1 | −0.346 | 6.13 | Unknown |
| 9 | IPI00409409 | CD1D1 protein | 1 | −0.178 | 9.22 | Unknown |
| 7 | IPI00621548 | NADPH-cytochrome P450 reductase | 1 | −0.463 | 5.37 | Unknown |
| 9 | IPI00321644 | Cytochrome P450 2D26 | 2 | −0.105 | 6.16 | Unknown |
| 1 | IPI00127016 | Hydroxysteroid 17-beta dehydrogenase 6 | 0 | −0.075 | 8.63 | Unknown |
| 16 | IPI00221721 | Hypothetical krab box containing protein, full insert sequence | 0 | −0.142 | 9.84 | Unknown |
| 8 | IPI00224073 | Hypothetical peptidase family M20/M25/M40 containing protein, full insert sequence | 0 | −0.01 | 5.99 | Unknown |
| 16 | IPI00228379 | Ferritin light chain 2 | 0 | −0.479 | 6.37 | Unknown |
| 17 | IPI00266842 | 17 kDa protein | 0 | −0.668 | 10.48 | Unknown |
| 15 | IPI00379258 | Similar to ferritin light chain 2 | 0 | −0.454 | 8.51 | Unknown |
| 3 | IPI00405742 | Plexin B2 | 0 | −0.3 | 5.67 | Unknown |
| 2 | IPI00408258 | Structure-specific endonuclease subunit SLX4 | 0 | −0.714 | 5.33 | Unknown |
| 11 | IPI00462251 | Hypothetical protein LOC72792 isoform 1 | 0 | −0.429 | 5.82 | Unknown |
| 15 | IPI00605814 | Similar to Ferritin light chain 1 | 0 | −0.358 | 6.42 | Unknown |
| 10 | IPI00131366 | Keratin, type II cytoskeletal 6B | 0 | −0.488 | 8.32 | Sarcolemma |
| 10 | IPI00322209 | Keratin, type II cytoskeletal 8 | 0 | −0.602 | 5.7 | Sarcolemma |
| 8 | IPI00853991 | Similar to VH coding region | 0 | −0.102 | 5.31 | Secreted |
| 10 | IPI00126458 | MRNA | 1 | −0.55 | 5.66 | MHC class I protein complex |
| 15 | IPI00121788 | Peroxiredoxin 1 | 0 | −0.221 | 8.26 | Microbody |
Hydrophobicity is an important characteristic of a membrane protein. The grand average of hydropathy (GRAVY) scores (>−0.4) (http://us.expasy.org/tools/protparam.html) is an index to evaluate the hydrophobic status of a protein, indicates a hydrophobic protein, and suggests a membrane association. In the current study, 69 (70%) of the 99 proteins identified from 1DE had a GRAVY > −0.4 (Supplemental Figure 3), a score indicating the probability for membrane association. Moreover, some alkaline proteins with PI values close to or greater than 10 were separated by 1DE (Supplemental Figure 4), but they could not be detected in a conventional 2DE map.
3.4. Comparison of 2DE and 1DE Datasets
Among the 2DE dataset (n = 183 proteins; Table 1) and 1DE dataset (n = 99 proteins; Table 2), only 23 proteins (Table 3) were consistent between 2DE and 1DE datasets (23% of 1DE dataset, and 13% of 2DE dataset). A total of 259 nonredundant proteins (n = 183 + 99 − 23) were identified in the microsome fraction through the strategy of combining 2DE with 1DE protein-separation technologies followed by ESI-Q-TOF MS/MS. The microsome consisted of a complex network of continuous membranes including ER, ER-Golgi intermediate complex—also referred to as the vesiculotubular clusters or pre-Golgi intermediates—and the Golgi apparatus [5]. Among those identified proteins, 62 located in ER and Golgi were definitely classified as microsome proteins by annotation in the Swiss-Prot database and the Gene Ontology (GO).
Table 3.
Proteins that are consistently present in both 2DE dataset of microsomal proteins (Table 1) and 1DE dataset of Na2CO3-extracted microsomal proteins (Table 2).
| Accession number | Protein name | Predicted TMD | GRAVY scores | PI value | Location |
|---|---|---|---|---|---|
| IPI00108454 | Similar to 40S ribosomal protein S6 | 0 | −0.918 | 10.68 | ER |
| IPI00112322a | UDP-glucuronosyltransferase 2B5 precursor | 1 | −0.031 | 7.94 | ER |
| IPI00129526 | Endoplasmin precursor (ER protein 99, 94 kDa glucose-regulated protein) | 0 | −0.72 | 4.74 | ER |
| IPI00133522 | Protein disulfide-isomerase precursor | 0 | −0.386 | 4.79 | ER |
| IPI00222496a | Protein disulfide isomerase-associated 6 | 1 | −0.292 | 5.05 | ER |
| IPI00230108 | Glucose-regulated protein, full insert sequence | 0 | −0.479 | 5.78 | ER |
| IPI00319992 | 78 kDa glucose-regulated protein precursor | 0 | −0.481 | 5.07 | ER |
| IPI00331322a | Microsomal glutathione S-transferase 1 | 3 | 0.14 | 9.67 | ER and mitochondrial outer membrane |
| IPI00319973a | Membrane-associated progesterone receptor component 1 | 1 | −0.616 | 4.57 | ER, membrane bound |
| IPI00109061 | Tubulin beta-4 chain homolog | 0 | −0.406 | 4.78 | Cytoplasmic |
| IPI00110827 | Actin, alpha skeletal muscle | 0 | −0.232 | 5.23 | Cytoplasmic |
| IPI00110850 | Actin, cytoplasmic 1 | 0 | −0.2 | 5.29 | Cytoplasmic |
| IPI00111908 | Predicted: carbamoyl-phosphate synthetase 1 | 0 | −0.12 | 6.42 | Cytoplasmic |
| IPI00117348 | Tubulin alpha-2 chain | 0 | −0.23 | 4.94 | Cytoplasmic |
| IPI00117914 | Arginase 1 | 0 | −0.187 | 6.52 | Cytoplasmic |
| IPI00134746 | Argininosuccinate synthase | 0 | −0.361 | 8.36 | Cytoplasmic |
| IPI00117978a | Cytochrome c oxidase subunit IV isoform 1, mitochondrial precursor | 1 | −0.412 | 9.25 | Mitochondrial inner membrane |
| IPI00315794a | Cytochrome b5 outer mitochondrial membrane isoform precursor | 1 | −0.602 | 4.79 | Mitochondrial outer membrane |
| IPI00122547a | Voltage-dependent anion-selective channel protein 2 | 0 | −0.223 | 7.44 | Outer mitochondrial membrane |
| IPI00124790a | Polyposis locus protein 1-like 1 | 3 | 0.375 | 6.82 | Integral to membrane |
| IPI00138406a | Ras-related protein Rap-1A | 0 | −0.375 | 6.39 | Membrane |
| IPI00121788 | Peroxiredoxin 1 | 0 | −0.221 | 8.26 | Microbody |
| IPI00131366 | Keratin, type II cytoskeletal 6B | 0 | −0.488 | 8.32 | Sarcolemma |
aMembrane proteins with one or more predicted trans-membrane origins or validated by references.
3.5. Significantly Enriched GO Terms for Mouse Liver Microsome Proteins
Biological Networks Gene Ontology [15] and Cytoscape [16] plugins to find statistically overrepresented GO categories were used for the enrichment analysis of our protein dataset. The microsome protein dataset (n = 259, from 1DE and 2DE datasets) was compared to a reference set of complete mouse proteome (IPI mouse) that was provided by Biological Networks Gene Ontology. The analysis was done with a hypergeometric test, and all significant (P < 0.01) GO terms were selected after correcting for a multiple term testing with a Benjamini and Hochberg false discovery rate. The analysis was performed separately for molecular function, cellular component, and biological process categories, and x-fold enrichment for every overrepresented term in three GO categories was calculated (Supplemental Figure 5). The results showed that the terms were related to mostly catalytic activity in terms of molecular function, including metabolism-related oxidoreductase, hydrolase, and dehydrogenase. Similarly, terms belonging to the cellular component namespace include mitochondrion, ER, and ribosome. Finally, terms from the biological process namespace included metabolic process, localization, transport, and translation. All of the information suggested the main functions and compositions of microsome.
3.6. Significant Enrichment of KEGG Pathway for Mouse Liver Microsome Proteins
Biological pathways analysis based on KEGG pathway database was performed with an analysis toolkit—WebGestalt (http://bioinfo.vanderbilt.edu/webgestalt/) [17]. This toolkit allowed the functional annotation of gene/protein sets into well-characterized functional signaling pathways (KEGG: http://www.genome.jp/kegg/). In addition, an enrichment score was obtained of the frequency of occurrence of a specific protein (or gene) within any given experimental subset with respect to a species-specific background set. Thus, an enrichment factor (the observed frequency in input set/the expected frequency in background set) was created with a statistical value that indicated that the protein (or gene) was specifically overrepresented in the input dataset. In this current study, all the proteins except 81 (n = 259 − 81 = 178) were linked to a total of 99 biological pathways in the KEGG, including metabolic pathway, glycolysis/gluconeogenesis, metabolism of xenobiotics by cytochrome P450, and PPAR signaling pathway. Among those pathways, 34 significantly (P < 0.01) enriched biological processes analyzed by WebGestalt were obtained (Figure 3). Those biological processes were involved in cell metabolism, benzoate degradation, metabolism of xenobiotics, ribosome, biosynthesis, signaling pathway, and oxidative stress. Those results are known to be related to microsome.
Figure 3.
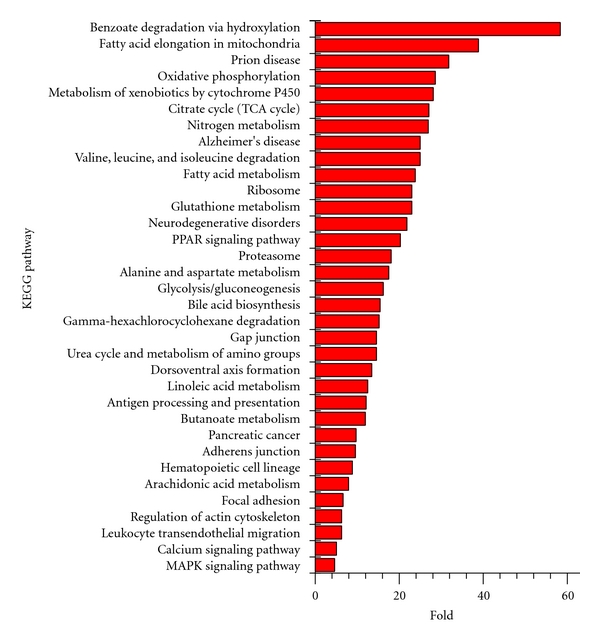
Significantly enriched KEGG pathways for mouse liver microsome proteins (n = 259) that were derived from 1DE and 2DE strategies. KEGG pathway enrichment analysis was performed using WebGestalt. The pathways having enrichment (P < 0.01) are presented. For each KEGG pathway, the bar shows the x-fold enrichment of the pathway in our dataset.
To ascertain the coverage of our dataset with the enriched pathways or biological processes, the KEGG search service was used to map our dataset on KEGG pathways. Two of the aforementioned enriched KEGG pathways (metabolism of xenobiotics and ribosome) were related to the well-known function and composition of the microsome (Figure 4). Enzyme Commission numbers (EC no., e.g, 1.14.14.1) are used to represent enzymes in metabolism. Highlighted in green background are known mouse enzymes annotated in the KEGG database and the red boxed are enzymes in our dataset (Figure 4(a)). All enzymes (n = 9) that played a key role in every pathway of metabolism of xenobiotics were included in our dataset (Table 4). Thirteen proteins from large and small subunits of ribosome were also found in our dataset (Table 4) and are indicated with a red box (Figure 4(b)). These proteins interact physically with each other and form a large protein complex—the ribosome. All the identified proteins that are involved in those two pathways are summarized in Table 4, including their KEGG pathway, protein ID, and protein name.
Figure 4.
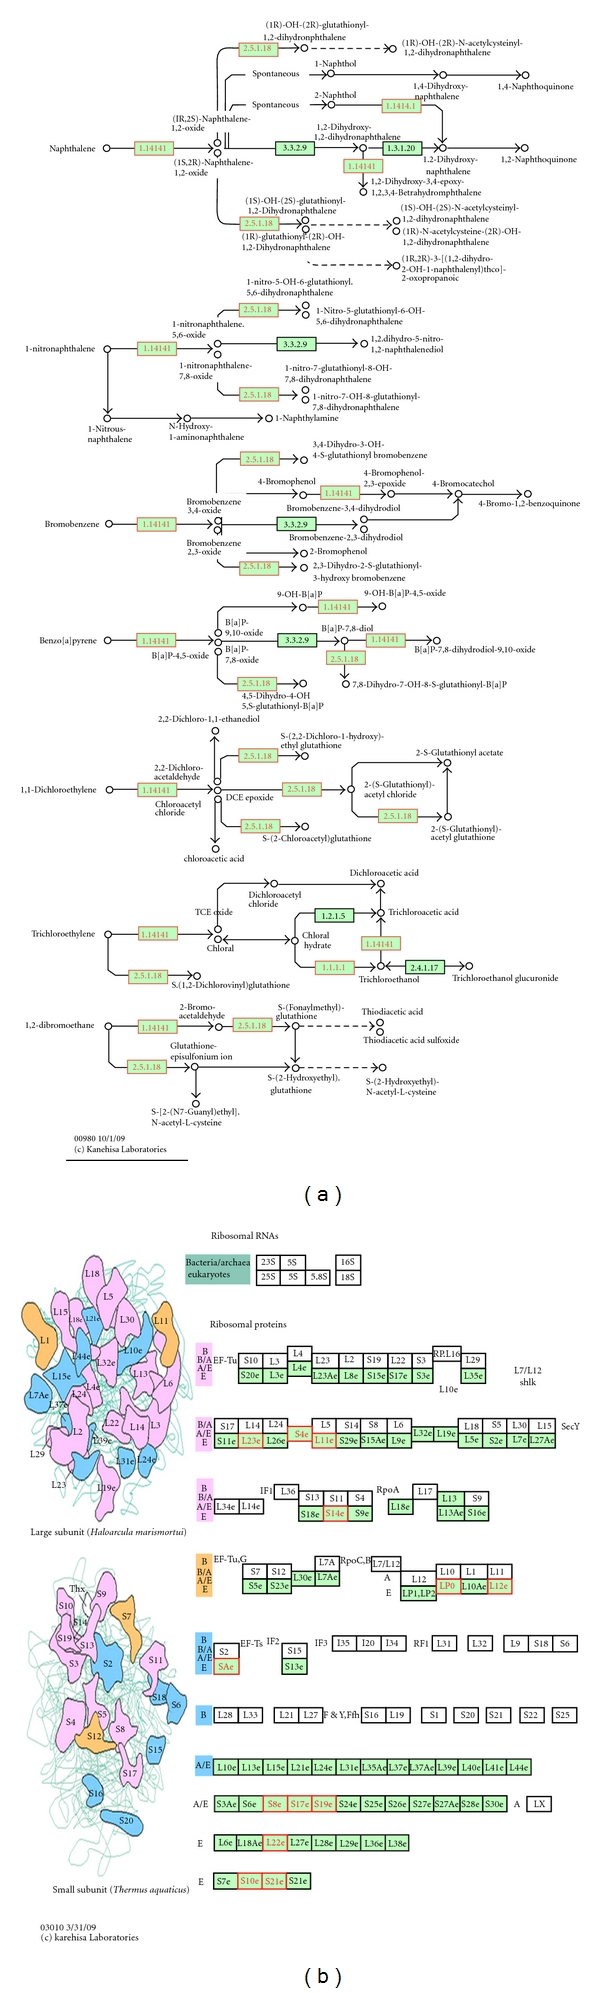
Metabolism of xenobiotics by cytochrome P450 pathway, and ribosome map views of identified proteins. The two enriched metabolic pathway maps were generated by KEGG, which incorporated the proteomic data into the KEGG pathway maps. All of the genes in mouse are colored; the genes contained in the protein dataset are red.
Table 4.
Proteins involved in KEGG pathways. (a) Metabolism of xenobiotics. (b) Ribosome.
| KEGG pathway | Protein ID | Protein name | MS-identified proteins | |
|---|---|---|---|---|
| A. Metabolism of exnobiotics | EC:1.14.14.1 | IPI00128287 | Cytochrome P450 1A2 | + |
| IPI00123964 | Cytochrome P450 2A5 | + | ||
| IPI00116572 | Cytochrome P450 2D9 | + | ||
| IPI00323908 | Cytochrome P450 2D10 | + | ||
| IPI00321644 | Cytochrome P450 2D26 | + | ||
| IPI00114779 | Cytochrome P450 2C38 | + | ||
| IPI00308328 | Cytochrome P450 2F2 | + | ||
| EC:2.5.1.18 | IPI00331322 | Microsomal glutathione S-transferase 1 | + | |
| EC:1.1.1.1 | IPI00221400 | Alcohol dehydrogenase A chain | + | |
| B. Ribosome | Small subunit | IPI00135640 | 26S protease regulatory subunit 8 | + |
| IPI00125971 | 26S protease regulatory subunit S10B | + | ||
| IPI00331092 | 40S ribosomal protein S4, X isoform | + | ||
| IPI00116908 | Similar to 40s ribosomal protein S12 | + | ||
| IPI00322562 | 40S ribosomal protein S14 | + | ||
| IPI00465880 | 40S ribosomal protein S17 | + | ||
| IPI00113241 | 40S ribosomal protein S19 | + | ||
| IPI00123604 | 40S ribosomal protein SA | + | ||
| IPI00314950 | 60S acidic ribosomal protein P0 | + | ||
| Large subunit | IPI00331461 | 60S ribosomal protein L11 | + | |
| IPI00849793 | 60S ribosomal protein L12 | + | ||
| IPI00222546 | 60S ribosomal protein L22 | + | ||
| IPI00139780 | 60S ribosomal protein L23 | + | ||
4. Discussion
Proteome analysis of the cell membrane-bound organelles is a daunting task mainly because of (a) isolation of membrane that is free from nonconstituents and (b) solubilization of membrane proteins in a manner amenable to isoelectric focusing [10]. 2DE is an effective tool to survey biological complexity at the molecular level and provides a systematic and comprehensive study of the proteins. However, because of the PI value range limited by the IPG strip and the high dependence on sample preparation, some problems exist for the available 2DE protocols to resolve membrane-associated proteins [10, 22]. Therefore, in the current study, the whole microsome lysate was arrayed with 2DE, and the membrane fraction of microsomes purified by the carbonate procedure was separated with 1DE. The complementary 2DE and 1DE approaches provided a much wider coverage of microsome proteome.
Hydrophobicity and relatively low abundance causes a challenge for proteomic technology to separate and identify membrane proteins. The hydrophobicity of proteins is frequently expressed as GRAVY scores (http://us.expasy.org/tools/protparam.html). A calculated GRAVY score of up to –0.4 indicates a hydrophobic protein, suggesting a membrane association [21]. In the current study, 69 (70%) of the 99 proteins identified from 1DE had a GRAVY > −0.4 (Supplemental Figure 3), indicating the probability for membrane association [21]. As shown in Supplemental Figure 4, some alkaline proteins with PI values close to or greater than 10 were separated by 1DE; they could not be detected in conventional 2DE map. Only 23 proteins were found to be consistent between 2DE and 1DE datasets with 6 proteins classified as membrane proteins (Table 3). All these results indicate that 1DE is a potent supplement to 2DE, and the combination of the two approaches is necessary in protein profiling of microsomes.
Microsome-sealed vesicles could be converted into flat membrane sheets with cisternal contents that were released effectively with the treatment solution (100 mM Na2CO3; 0°C). It appears to be as effective as the low detergent procedure in selectively releasing microsomal content. In the current study, some proteins that were identified from Na2CO3-extracted fraction were classified as membrane associated mainly based on published reports, even though their predicted transmembrane domains (TMDs) did not suggest a membrane origin. The observations point out the fact that structure alone may not be the deciding factor, as far as the association of proteins with cell membrane is concerned. First, the proteins may be bound to the membrane simply to perform their functional obligations. Consequently, they could become part of complexes involving membrane proteins and may not depart from them easily under the conditions of sample preparation. For example, many enzymes were identified in the extracted membrane fraction, such as Cis-retinol androgen dehydrogenase 1 (short-chain dehydrogenase family). It is anchored to the ER membrane facing the cytoplasm by an N-terminal signaling sequence of 22 residues and takes part in the membrane-associated retinoid metabolism [23], so is fatty acid-binding protein, which participates in the palmitic acid or retinylester metabolism that is incorporated in microsomal membranes [24] and the free fatty acid transferation to the membrane. Second, some truly cytosolic proteins may simply integrate with membrane vesicles during the sonication process and become difficult to remove by the extraction methods [25]. Studies [5] have demonstrated that hepatic microsomes are derived from the ER and other cell organelles. The ER represents a membrane tubular network that crosses the cytoplasm from the nucleus membrane to the plasma membrane. Moreover, some proteins perform their functions between cytoplasm and ER, such as fatty-acid-binding proteins [26]. From this point of view, taking all of the portions into account, 60%–70% of the proteins identified can be regarded as microsome proteins in this research. A part (~15%) of identified proteins did not have unambiguous locations in published reports or annotations in the genome database. This current study provides information relevant to subcellular locations of these proteins for subsequent studies.
Two datasets from 1DE and 2DE are part of the complete protein composition of microsomes. A bioinformatics analysis of the two datasets combined offers more information. For an overview of the proteomic data and comprehending their biological importance, biological networks GO (BinGO) (http://www.psb.ugent.be/cbd/papers/BiNGO/index.html) was used to identify GO-category significant enrichment with all the identified proteins. BiNGO is a plugin for Cytoscape, which is an open source bioinformatics software platform to visualize and integrate molecular interaction networks. BinGO maps the predominant functional themes of a given gene set on the GO hierarchy. Of the 259 target proteins and direct partners analyzed, 182 target proteins linked to one or more GO terms. GO-term enrichment analysis revealed that the most highly represented GO terms in the cellular GO category component were organelles such as ER, mitochondrial, and organelle membrane. An analysis of the proteins that were identified according to their potential roles in biological processes indicated that the proteins were mainly involved in metabolic process, localization, transport, and translation. All the results were highly statistically significant.
The KEGG pathway database integrates current knowledge on molecular interaction networks in biological processes. To gain a broad understanding of our dataset, WebGestalt (a web-based gene set analysis toolkit) was used to map the identified proteins to KEGG pathways. The results showed that 112 of the total proteins were associated with one or more KEGG pathways. Meanwhile, 97 of 112 target proteins (87%) fell into 34 KEGG pathways; they were specifically enriched (P < 0.01) compared to statistical expectations. Pathways that are involved in benzoate degradation, metabolism of xenobiotic, glutamate metabolism, and cysteine metabolism were among the most enriched biologically. This finding was consistent with the fact that microsomes were used to investigate the metabolism of compounds and to examine drug-drug interaction by in vitro studies.
Collectively, the bioinformatics analysis via enrichment analysis of GO annotation and KEGG pathways derived meaning from the proteomic data and assisted in the understanding of the function of liver at the subcellular level.
Novelty and Limitation —
Mammalian liver microsome proteomes have been studied by several groups [18–20]. Comparison of the current study with the literature data [18–20] was shown in Tables 5 and 6. Zgoda et al. [18] studied differential ultracentrifugation-separated mouse liver microsome proteome; 2DE and silver stain yielded 1,100 protein spots, and 138 proteins contained in 2D gel spots were identified with peptide mass fingerprint (PMF). Zgoda et al. [19] also studied differential ultracentrifugation-separated mouse liver microsome proteome with 1DE and MS/MS; 519 proteins were identified including 138 (138/519 = 27%) predicted membrane proteins. Gilchrist et al. [20] used 1DE and MS/MS to analyze rat ER and Golgi that were separated with differential ultracentrifugation and density gradient centrifugation; 832 ER proteins were identified including 183 (183/832 = 22%) membrane proteins. This current study combined differential ultracentrifugation and sucrose gradient centrifugation to prepare mouse liver microsomes; 2DE and Coomassie brilliant blue stain yielded 514 protein spots, and 183 proteins were identified with MS/MS from 204 excised gel spots, including 41 (41/183 = 22%) membrane proteins. Na2CO3 was used to further extract membrane proteins from isolated microsomes; 1DE and Coomassie brilliant blue stain yield 17 protein bands, and 99 proteins were identified with MS/MS from those 17 protein bands, including 54 (54/99 = 55%) membrane proteins. A total of 259 nonredundant proteins were identified including 62 (62/259 = 24%) membrane proteins. Compared to the documented data [18–20], the novelty of this current study is that the carbonate method significantly increased the identification rate of microsomal membrane proteins, that some proteins and functional annotations from this current study have not been identified in other literature, which expanded and enriched the documented data, and that the established analysis system and data will benefit the discovery of liver disease-related microsomal membrane proteins. Meanwhile, we also noted that the current study had a relatively low coverage (n = 259 proteins) of mouse liver microsome proteome relative to the documented data (n = 519 proteins [19] and 832 proteins [20]), which might be derived from several factors: (i) inconsistent protein-extracted procedures and protein-stained methods were used, (ii) only part of 2D gel spots were excised to identify proteins, (iii) only visualized 1D gel bands (not the entire 1D gel lane) were used for protein identification, (iv) MS/MS (not PMF) was used to identify 2D gel proteins, (v) different sensitivity mass spectrometers were used, (vi) different parameters were used to search protein database. The use of 2D/3D LC-MS/MS [19] and carbonate extraction of isolated microsomes would significantly improve the coverage of microsomal membrane proteome.
Table 5.
| Current study | Ref. [19] | Ref. [18] | Ref. [20] | |
|---|---|---|---|---|
| Species | Mouse | Mouse | Mouse | Rat |
| Sample | Liver microsome | Liver microsome | Liver microsome | ER, Golgi |
| Pretreatment | None | Phenobarbital | Phenobarbital or 3-methylcholanthrene | None |
| Sample preparation | Subfractionated by differential ultra-centrifugation + sucrose gradient centrifugation + Na2CO3 | Subfractionated by differential ultra-centrifugation | Differential ultracentrifugation | Subfractionated by differential ultra-centrifugation + density gradient centrifugation |
| Protein separation | 2DE, 1DE | 1DE | 2DE | 1DE |
| 1D/2D-Gel Stain | Coomassie brilliant blue (2DE; 1DE) | — | Silver stain | — |
| Protein identification | MS/MS | MS/MS | PMF | MS/MS |
| Protein spots on 2D-Gel | 514 | — | 1100 | — |
| Proteins identified in 2D-Gel | 183 | — | 139 | — |
| Proteins identified in 1DE | 99 | 519 | — | 832 (ER) |
| Proteins identified in 2-D LC | — | 1410 | — | — |
| Proteins identified in 3-D LC | — | 3703 | — | — |
| Total identified proteins | 259 | 4142 | Unspecified | 832 (ER) |
| Membrane proteins | 2DE: 41 (41/183 = 22%) 1DE: 54 (54/99 = 55%) Total: 62 (62/259 = 24%) |
1DE: 138 (138/519 = 27%) 2-D LC: 259 (259/1410 = 21%) 3-D LC: 659 (659/3703 = 18%) |
Unspecified | 183 (183/832 = 22%) |
| Protein superfamily | ||||
| P450 family members | 10 | 29 | 2 | 11 |
| Ribosomal proteins | 13 | 16 | Unspecified | 45 |
| UDP glycosyltransferases, UGTs | 6 | 8 | Unspecified | 3 |
| Tubulins | 11 | 5 | Unspecified | 2 |
| Short-chain dehydrogenase/reductase | 32 | 9 | Unspecified | 56 |
| Protein disulfide isomerase | 2 | 4 | Unspecified | 1 |
Table 6.
| Protein | Current study | Ref. [19] | Ref. [18] | Ref. [20] |
|---|---|---|---|---|
| P450 family members | 2D9, 2A5, 2C38, 1A2, 2D11, 2F2, 2D10, 2D26 | 2C37 | 17A1, 20A1, 2B2, 2J3, 4A1, 4A8, 4F1, 4F4, 4V3, 8B1, NA2 | |
| GRP-170 | Hypoxia upregulated protein 1 | 170 kDa glucose regulated protein | — | |
| Endoplasmin | Endoplasmin | Tumor rejection antigen gp96 | ||
| Serotransferrin | Serotransferrin | Transferrin | — | |
| 78 kDa glucose-regulated protein | 78 kDa glucose-regulated protein | 78 kDa glucose-regulated protein | — | |
| Stress-induced phosphoprotein 1 | — | Stress-induced phosphoprotein 1 | — | |
| Calreticulin family | Calnexin | Calreticulin | — | |
| Protein disulfide-isomerase | Protein disulfide-isomerase precursor (PDI) | Protein disulfide-isomerase precursor (PDI) | Similar to disulfide isomerase | |
| Glucose-regulated protein similar to ER-60 protease | — | Glucose-regulated protein similar to ER-60 protease | — | |
| Erp58 | — | Erp58 | — | |
| Vitamin D-binding protein | — | Vitamin D-binding protein | — | |
| Tubulins | Tubulin beta-4, alpha-1, alpha-2, alpha-4, beta-5, beta-2C, beta 2 | Tubulin alpha | Tubulin alpha 6 | |
| Fibrinogen | — | Fibrinogen, gamma polypeptide | — | |
| Serine protease inhibitor | — | Similar to serine protease inhibitor 1–4 | — | |
| Argininosuccinate synthetase 1 | Argininosuccinate synthetase 1 | Argininosuccinate synthetase 1 | — | |
| Interferon-inducible GTPase | — | Interferon-inducible GTPase | ||
| Progesterone receptor membrane component | Progesterone receptor membrane component | Progesterone receptor membrane component | — | |
| Major urinary protein 2 | Major urinary protein 2 | Major urinary protein 2 | — | |
| Superoxide dismutase I | — | Superoxide dismutase I | — | |
| Ribosomal proteins | 26S protease regulatory subunit 8, S10B; 40S ribosomal protein S17, SA, S6, S19, S12, SA, S14, S4 X isoform; 60S ribosomal protein L11, L12, L23, L22, P0 |
Unspecified | 40S Ribosomal Protein S10, S12, S18, S20, S21, S23, S24, S25, S26, S27, S29, S30, S6, S9 60S Ribosomal Protein L12, L15, L18A, L19, L21, L22, L23, L23A, L24, L26, L27, L27A, L28, L3, L32, L34, L35, L35A, L36, L37, L37A, L39, L4, L40, L44, L6, L7A |
|
| UDP glycosyltransferases, UGTs | UDP-glucuronosyltransferase 2B5, 2B36, 1A5 | Unspecified | UDP-Glucuronosyltransferase 1A7 | |
| UDP-glucuronosyltransferase 1-1 precursor | UDP-Glucuronosyltransferase GTNA2 | |||
| UDP-glucuronosyltransferase 1-2 precursor | ||||
| Short-chain dehydrogenase/reductase | Glyceraldehyde-3-phosphate dehydrogenase Alcohol dehydrogenase A Short-chain dehydrogenase CRAD2 Cis-retinol androgen dehydrogenase 1 Hydroxysteroid 17-beta dehydrogenase 6 |
Unspecified | Glyceraldehyde 3-phosphate dehydrogenase Alcohol dehydrogenase [NADP+] Similar to retinal short-chain Dehydrogenase/reductase Retinol dehydrogenase 10 Hydroxysteroid (17-Beta) dehydrogenase 8 |
|
| Oxidoreductase HTATIP2 NADH-ubiquinone oxidoreductase 24 kDa subunit NADH-cytochrome b5 reductase 3 NADPH-cytochrome P450 reductase |
Unspecified | Oxidoreductase ero1-L endoplasmic oxidoreductase 1 Beta |
No protein list was obtained from [19].—means “not included.”
5. Conclusions
The preparation of liver microsomes was optimized. The data presented here demonstrated that 1DE and 2DE are complementary approaches to analyze the intracellular microsomes that contain considerable numbers of highly hydrophobic membrane proteins. An integrated bioinformatics analysis of all of the microsome proteins identified with 1DE and 2DE can provide a relatively complete understanding of the protein composition and cellular function of the target microsome organelles. The information presented here will be useful for successful analysis of other membranous organelles. Our data will assist in understanding the function of liver and are an important reference for subsequent analysis of liver disease-related microsome proteins for biomarker discovery and mechanism clarification of a liver disease.
Supplementary Material
Supplemental figure 1: is detection and validation of the purity of isolated microsomes.
Supplemental figure 2: is distribution of subcellular locations of 2DE-derived proteins.
Supplemental figure 3: is distribution of 1DE-derived proteins over the GRAVY scores.
Supplemental figure 4: is distribution of 1DE-derived proteins over the pI values.
Supplemental figure 5: is significant enrichment of GO terms for mouse liver microsome proteins (n = 259) that were derived from 1DE and 2DE strategies.
Supplemental Table 1: MS/MS identification of 2DE-arrayed proteins from mouse liver microsomal preparations.
Supplemental Table 2: MS/MS identification of 1DE-separated proteins from Na2CO3-extracted mouse liver microsomal membrane preparations
Acknowledgments
This work was supported by China National Haman Liver Proteome Project (Grant no. 2004 BA711A18) and The National Basic Research Program of China (Grant No. 2011CB910704).
Abbreviations
- ACN:
Acetonitrile
- BinGO:
Biological Networks Gene Ontology
- DTT:
Dithiothreitol
- 1DE:
One-dimensional gel electrophoresis
- 2DE:
Two-dimensional gel electrophoresis
- ER:
Endoplasmic reticulum
- GO:
Gene ontology
- GRAVY:
Grand average of hydropathy
- HLPP:
Human Liver Proteome Project
- IEF:
Isoelectric focusing
- KEGG:
Kyoto Encyclopedia of Genes and Genomes
- LC:
Liquid chromatography
- MS:
Mass spectrometry
- MS/MS:
Tandem mass spectrometry
- Q-TOF:
Quadrupole-time of flight
- RP:
Reverse phase
- TMD:
Transmembrane domains.
References
- 1.He F. Human liver proteome project: plan, progress, and perspectives. Molecular and Cellular Proteomics. 2005;4(12):1841–1848. doi: 10.1074/mcp.R500013-MCP200. [DOI] [PubMed] [Google Scholar]
- 2.Jung E, Heller M, Sanchez JC, Hochstrasser DF. Proteomics meets cell biology: the establishment of subcellular proteomes. Electrophoresis. 2000;21(16):3369–3377. doi: 10.1002/1522-2683(20001001)21:16<3369::AID-ELPS3369>3.0.CO;2-7. [DOI] [PubMed] [Google Scholar]
- 3.Taylor SW, Fahy E, Ghosh SS. Global organellar proteomics. Trends in Biotechnology. 2003;21(2):82–88. doi: 10.1016/S0167-7799(02)00037-9. [DOI] [PubMed] [Google Scholar]
- 4.Heinemann FS, Ozols J. Isolation and structural analysis of microsomal membrane proteins. Frontiers in Bioscience. 1998;3:483–493. doi: 10.2741/a295. [DOI] [PubMed] [Google Scholar]
- 5.Wong DM, Adeli K. Microsomal proteomics. Methods in Molecular Biology. 2009;519:273–289. doi: 10.1007/978-1-59745-281-6_17. [DOI] [PubMed] [Google Scholar]
- 6.Okuzawa K, Franzen B, Lindholm J, et al. Characterization of gene expression in clinical lung cancer materials by two-dimensional polyacrylamide gel electrophoresis. Electrophoresis. 1994;15(3-4):382–390. doi: 10.1002/elps.1150150157. [DOI] [PubMed] [Google Scholar]
- 7.Chen P, Zhang L, Li X, et al. Evaluation of strategy for analyzing mouse liver plasma membrane proteome. Science in China Series C. 2007;50(6):731–738. doi: 10.1007/s11427-007-0103-4. [DOI] [PubMed] [Google Scholar]
- 8.Galeva N, Altermann M. Comparison of one-dimensional and two-dimensional gel electrophoresis as a separation tool for proteomic analysis of rat liver microsomes: cytochromes P450 and other membrane proteins. Proteomics. 2002;2(6):713–722. doi: 10.1002/1615-9861(200206)2:6<713::AID-PROT713>3.0.CO;2-M. [DOI] [PubMed] [Google Scholar]
- 9.Kanaeva IP, Petushkova NA, Lisitsa AV, et al. Proteomic and biochemical analysis of the mouse liver microsomes. Toxicology In Vitro. 2005;19(6):805–812. doi: 10.1016/j.tiv.2005.03.016. [DOI] [PubMed] [Google Scholar]
- 10.Santoni V, Molloy M, Rabilloud T. Membrane proteins and proteomics: un amour impossible? Electrophoresis. 2000;21(6):1054–1070. doi: 10.1002/(SICI)1522-2683(20000401)21:6<1054::AID-ELPS1054>3.0.CO;2-8. [DOI] [PubMed] [Google Scholar]
- 11.Friso G, Giacomelli L, Ytterberg AJ, et al. In-depth analysis of the thylakoid membrane proteome of Arabidopsis thaliana chloroplasts: new proteins, new functions, and a plastid proteome database. Plant Cell. 2004;16(2):478–499. doi: 10.1105/tpc.017814. [DOI] [PMC free article] [PubMed] [Google Scholar]
- 12.Fujiki Y, Hubbard AL, Fowler S, Lazarow PB. Isolation of intracellular membranes by means of sodium carbonate treatment: application to endoplasmic reticulum. Journal of Cell Biology. 1982;93(1):97–102. doi: 10.1083/jcb.93.1.97. [DOI] [PMC free article] [PubMed] [Google Scholar]
- 13.Fleischer S, Kervina M. Subcellular fractionation of rat liver. Methods in Enzymology. 1974;31:6–41. doi: 10.1016/0076-6879(74)31005-1. [DOI] [PubMed] [Google Scholar]
- 14.Candiano G, Bruschi M, Musante L, et al. Blue silver: a very sensitive colloidal Coomassie G-250 staining for proteome analysis. Electrophoresis. 2004;25(9):1327–1333. doi: 10.1002/elps.200305844. [DOI] [PubMed] [Google Scholar]
- 15.Maere S, Heymans K, Kuiper M. BiNGO: a cytoscape plugin to assess overrepresentation of Gene Ontology categories in Biological Networks. Bioinformatics. 2005;21(16):3448–3449. doi: 10.1093/bioinformatics/bti551. [DOI] [PubMed] [Google Scholar]
- 16.Shannon P, Markiel A, Ozier O, et al. Cytoscape: a software environment for integrated models of biomolecular interaction networks. Genome Research. 2003;13(11):2498–2504. doi: 10.1101/gr.1239303. [DOI] [PMC free article] [PubMed] [Google Scholar]
- 17.Zhang B, Kirov S, Snoddy J. WebGestalt: an integrated system for exploring gene sets in various biological contexts. Nucleic Acids Research. 2005;33(2):W741–W748. doi: 10.1093/nar/gki475. [DOI] [PMC free article] [PubMed] [Google Scholar]
- 18.Zgoda V, Tikhonova O, Viglinskaya A, Serebriakova M, Lisitsa A, Archakov A. Proteomic profiles of induced hepatotoxicity at the subcellular level. Proteomics. 2006;6(16):4662–4670. doi: 10.1002/pmic.200600342. [DOI] [PubMed] [Google Scholar]
- 19.Zgoda VG, Moshkovskii SA, Ponomarenko EA, et al. Proteomics of mouse liver microsomes: performance of different protein separation workflows for LC-MS/MS. Proteomics. 2009;9(16):4102–4105. doi: 10.1002/pmic.200900050. [DOI] [PubMed] [Google Scholar]
- 20.Gilchrist A, Au CE, Hiding J, et al. Quantitative proteomics analysis of the secretory pathway. Cell. 2006;127(6):1265–1281. doi: 10.1016/j.cell.2006.10.036. [DOI] [PubMed] [Google Scholar]
- 21.Kyte J, Doolittle RF. A simple method for displaying the hydropathic character of a protein. Journal of Molecular Biology. 1982;157(1):105–132. doi: 10.1016/0022-2836(82)90515-0. [DOI] [PubMed] [Google Scholar]
- 22.Adessi C, Miege C, Albrieux C, Rabilloud T. Two-dimensional electrophoresis of membrane proteins: a current challenge for immobilized pH gradients. Electrophoresis. 1997;18(1):127–135. doi: 10.1002/elps.1150180124. [DOI] [PubMed] [Google Scholar]
- 23.Zhang M, Hu P, Napoli JL. Elements in the N-terminal signaling sequence that determine cytosolic topology of short-chain dehydrogenases/reductases: studies with retinol dehydrogenase type 1 and cis-retinol/androgen dehydrogenase type 1. Journal of Biological Chemistry. 2004;279(49):51482–51489. doi: 10.1074/jbc.M409051200. [DOI] [PubMed] [Google Scholar]
- 24.Zanetti R, Catala A. Interaction of fatty acid binding protein with microsomes: removal of palmitic acid and retinyl esters. Archives Internationales de Physiologie et de Biochimie. 1990;98(4):173–177. doi: 10.3109/13813459009113975. [DOI] [PubMed] [Google Scholar]
- 25.Friso G, Wikström L. Analysis of proteins from membrane-enriched cerebellar preparations by two-dimensional gel electrophoresis and mass spectrometry. Electrophoresis. 1999;20(4-5):917–927. doi: 10.1002/(SICI)1522-2683(19990101)20:4/5<917::AID-ELPS917>3.0.CO;2-6. [DOI] [PubMed] [Google Scholar]
- 26.Stan S, Lambert M, Delvin E, et al. Intestinal fatty acid binding protein and microsomal triglyceride transfer protein polymorphisms in French-Canadian youth. Journal of Lipid Research. 2005;46(2):320–327. doi: 10.1194/jlr.M400346-JLR200. [DOI] [PubMed] [Google Scholar]
Associated Data
This section collects any data citations, data availability statements, or supplementary materials included in this article.
Supplementary Materials
Supplemental figure 1: is detection and validation of the purity of isolated microsomes.
Supplemental figure 2: is distribution of subcellular locations of 2DE-derived proteins.
Supplemental figure 3: is distribution of 1DE-derived proteins over the GRAVY scores.
Supplemental figure 4: is distribution of 1DE-derived proteins over the pI values.
Supplemental figure 5: is significant enrichment of GO terms for mouse liver microsome proteins (n = 259) that were derived from 1DE and 2DE strategies.
Supplemental Table 1: MS/MS identification of 2DE-arrayed proteins from mouse liver microsomal preparations.
Supplemental Table 2: MS/MS identification of 1DE-separated proteins from Na2CO3-extracted mouse liver microsomal membrane preparations