Abstract
Treating viral illnesses or noninfective causes of inflammation with antibiotics is ineffective and contributes to the development of antibiotic resistance, toxicity, and allergic reactions, leading to increasing medical costs. A major factor behind unnecessary use of antibiotics is, of course, incorrect diagnosis. For this reason, timely and accurate information on whether the infection is bacterial in origin would be highly beneficial. In this paper we will present our recent studies on the expression of opsonin receptors on phagocytes. The analysis of the expression levels of FcγRI, CR1, and CR3, along with CRP and ESR data, provides a novel application to the diagnosis of infectious and inflammatory diseases. The best clinical benefit will be obtained when the individual variables are combined to generate the CIS point method for a bacterial infection marker, DNAVS point for differentiating between DNA and RNA virus infections, and CRP/CD11b ratio for a marker of Gram-positive sepsis.
1. Introduction
There are two basic molecular mechanisms of recognition of microorganisms by phagocytic cells: opsonin-dependent, and opsonin-independent. The former mechanism requires serum components, opsonins, which act by binding to the surface of the microorganisms at one end and to specific receptors on the phagocyte surface at the other. The best-known opsonins are Immunoglobulin G (IgG) which binds via its Fc domain to the Fc receptor (FcR) on the phagocytes, and the C3b and iC3b fragments of the C3 component of complement, which bind to the complement receptors CR1 and CR3, respectively, on the phagocyte surface. Many different types of bacteria interact with phagocytic cells in serum-free media in vitro in the absence of opsonins, Certain integrins (CR3 among others) serve as receptors for microbial surface ligands in nonopsonic phagocytosis [1].
IgG is the most abundant Ig class in serum, constituting over 75% of circulating immunoglobulin. It mediates key effector functions through interaction with Fcγ receptors. Fcγ receptors are divided generally into three main classes, FcγRI(CD64), FcγRII (CD32), and FcγRIII (CD16), each with distinct structural and functional properties. FcγRI is a high-affinity receptor for monomeric IgG (K a: 109–1010/M) with three extracellular Ig-like domains expressed constitutively by monocytes and macrophages, as well as by many myeloid progenitor cells. In contrast to FcγRI, the other two classes of Fcγ receptor, FcγRII and FcγRIII, display low affinity for monomeric IgG. They are capable of binding to aggregated IgG through multimeric low-affinity, high-avidity interactions, which are particularly important in the recognition and binding of antibody-antigen complexes during an immune response. IgG binding to low-affinity FcγR can trigger a range of effector and immunoregulatory functions, including degranulation, phagocytosis, and regulation of antibody production. FcγRII is expressed by diverse cell types: FcγRIIa isoform by myeloid cells, including polymorphonuclear leucocytes, monocytes, macrophages, platelets, and certain types of endothelial cells and, FcγRIIb by B cells, monocytes, and macrophages, while FcγRIIc expression is restricted solely to natural killer (NK) cells. The other low-affinity Fcγ receptor, FcγRIII, is in two isoforms. Although FcγRIIIa and FcγRIIIb share high levels of sequence homology, they exhibit distinct structural differences. FcγRIIIa is a transmembrane protein that associates with the FcγR chain, whereas FcγRIIIb is processed posttranslationally as a glycosylphosphatidylinositol- (GPI-) anchored protein, lacking transmembrane and intracellular domains. The FcγRIIIa isoform is expressed widely by several leucocyte cell types, including macrophages, NK cells, and subsets of T cells and monocytes, while FcγRIIIb is expressed constitutively only by neutrophils [2].
The receptors for complement molecules, designated complement receptors 1 (CD35) and 3 (CD11b), present on all phagocytic cells, are only weakly expressed on the surface of resting neutrophils and are mostly stored in intracellular granules (CD35 in secretory vesicles and CD11b in both specific and gelatinase granules and secretory vesicles). Secretory vesicles (SV) are the most likely to release contents via degranulation, followed by gelatinase, specific, and azurophil granules. In addition to exposure to proinflammatory cytokines, even relatively simple physical stress, different anticoagulant types, temperature changes, and isolation of leukocytes can trigger rapid degranulation of neutrophil SVs. Fusion of SVs with the plasma membrane leads to increased CD35 and CD11b levels at the cell surface [3].
Do the infectious and other inflammatory diseases induce alterations in the expression of the opsonin receptors of phagocytes?
2. Receptor Expression Measurements
Erythrocytes were lysed in anticoagulated blood by adding 10 volumes of 0.83% NH4Cl followed by 15 min of incubation at room temperature. Leukocytes were separated by centrifugation. Before the measurements of receptor expression, leukocytes (3 × 10⁵) were incubated in 50 μL of gHBSS with monoclonal antibodies (0.4 μg) in polystyrene flow cytometer vials for 30 min at +4°C. After incubation, the cells were washed once with cold gHBSS and resuspended in cold gHBSS. Leukocytes incubated with mouse unspecific immunoglobulins served as controls for correction of leukocyte autofluorescence. A relative measure of receptor expression was obtained by determining the mean fluorescence intensity of 5000 leukocytes. In the case of neutrophil FcγRI, the percentage of fluorescence positive cells (%) was also determined. In neutrophils, which express only few FcγRI (MFI < 4.0) on the cell membrane, the %-value varied between 5 and 70 which described the changes in expression levels better than the MFI. At a high expression levels (MFI value >4.0), the %-value was 95–100. When %-value was 100 regardless of the activation state of leukocyte (i.e., in the case of CR1, CR3, and FcγRII in neutrophils, monocytes, and eosinophils, FcγRI in monocytes, and FcγRIII in neutrophils), only MFI was presented. Measurement of leukocyte receptor expression was performed using fluorescently (FITC or PE) labelled receptor-specific monoclonal antibodies. The receptor panel studied for two-colour immunofluorescence analysis and the mAbs are presented in Table 1.
Table 1.
Monoclonal antibodies used in receptor expression studies.
| Clone | Conjugate | Specificity | CD group | Isotype |
|---|---|---|---|---|
| FcγRs | ||||
| 22 | FITC | FcγRI | CD64 | IgG mouse |
| 2E1 | PE | FcγRII | CD32 | IgG2a mouse |
| 3G8 | FITC | FcγRIII | CD16 | IgG1 mouse |
|
| ||||
| CRs | ||||
| J3D3 | FITC | CR1 | CD35 | IgG1 mouse |
| Bear1 | PE | CR3 | CD11b | IgG1 mouse |
|
| ||||
| Isotype controls | ||||
| 679.1Mc7 | FITC/PE | Irrelevant | — | IgG1 mouse |
| U7.27 | PE | Irrelevant | — | IgG2a mouse |
3. Receptor Expression in Health and Diseases
Earlier, we have performed few studies where we have measured the receptor expression in various rather small patient groups [4–7]. The summary of the results from these studies is presented in Table 2. In monocytes, all the receptors were upregulated in bacterial and viral infections. In neutrophils, CR1, CR3, FcγRI, and FcγRII were upregulated, while FcγRIII was downregulated in bacterial infections. CR1 and FcγRII were downregulated, while CR3 and FcγRI were upregulated in viral infections. These results led us to conclude that the receptor expression could be used as a basis for the differential diagnosis of bacterial and viral infections.
Table 2.
Receptor expression changes in various diseases compared to healthy controls.
| Receptor | Bacterial infection | Viral infection | Kidney cancer | Atopic dermatitis |
|---|---|---|---|---|
| Neutrophils | ||||
| CR1/CD35 | +++ | (−) | no change | + |
| CR3/CD11b | +++ | + | ++ | (+) |
| FcγRI/CD64 | +++ | +++ | (+) | no change |
| FcγRII/CD32 | + | (−) | no change | (+) |
| FcγRIII/CD16 | (−) | no change | no change | (−) |
|
| ||||
| Monocytes | ||||
| CR1/CD35 | +++ | ++ | + | (+) |
| CR3/CD11b | +++ | ++ | +++ | (+) |
| FcγRI/CD64 | +++ | +++ | + | (−) |
| FcγRII/CD32 | (+) | no change | ++ | (+) |
The +/− without parentheses indicates a significant increase/decrease in the expression of receptor in question compared to healthy control.
The +/− in parentheses represents an insignificant increase/decrease in the expression of receptor in question compared to healthy control.
+ or − = 0%–50% increase or decrease compared to healthy control, ++ = 50%–100% increase compared to healthy control, and +++ = more than 100% increase compared to healthy control.
4. Prospective Study
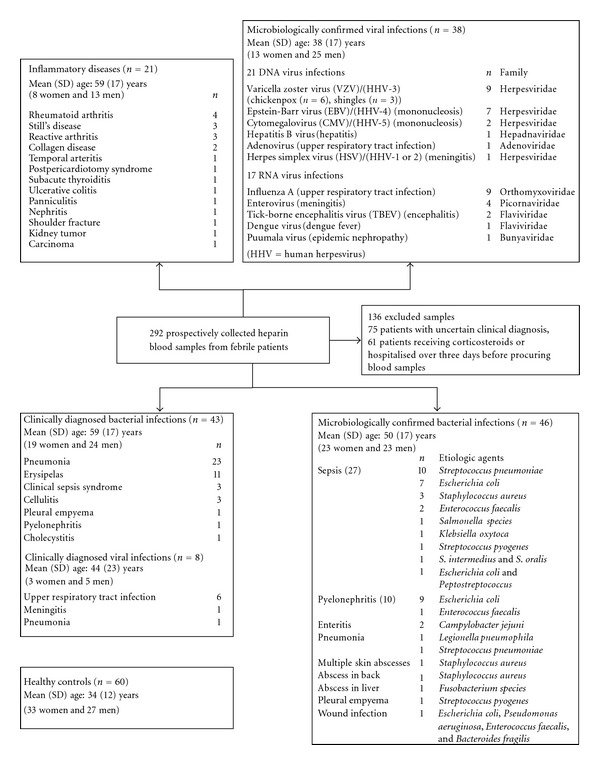
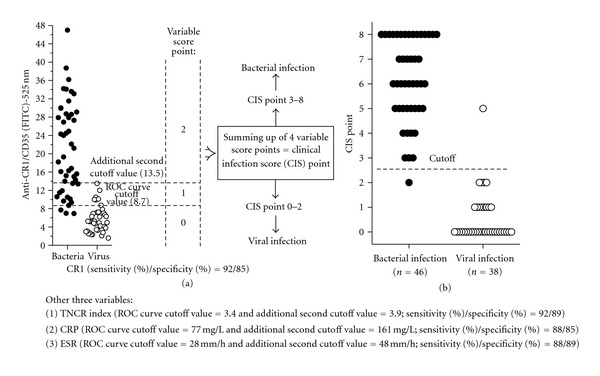
In this study, standard clinical laboratory data (neutrophil count, serum C reactive protein level (CRP), and erythrocyte sedimentation rate (ESR)) and quantitative flow cytometric analysis of neutrophil complement receptors, CR1 and CR3, as well as FcγRI (CD64) were obtained from 292 hospitalized febrile patients. After microbiological confirmation or clinical diagnosis, 135 patients were found to have either bacterial (n = 89) or viral (n = 46) infection. The patient data was compared to 60 healthy controls. The grouping of the patients into subgroups is presented in Figure 1. The mean of parameters measured in the patient samples are presented in Table 3. The average expression levels of CR1 and CR3 on neutrophils in bacterial infections were over threefold and twofold higher, respectively, compared with viral infections and controls. According to receiver operating characteristic (ROC) curve analysis, neutrophil CR1 displayed 92% sensitivity and 85% specificity in distinguishing between bacterial and viral infections (Figure 2(a)). Compared with other measured variables, such as neutrophil CR3, neutrophil count, CRP, and ESR, neutrophil CR1 had the most effective differential capacity. The lower diagnostic accuracy of CR3 compared with CR1 may be explained by the phenomenon that CR3 is expressed not only from rapidly releasing secretory vesicles like CR1, but also from specific and gelatinase granules [8]. The differential capacity of CR1 and CR3 was lost when EDTA, instead of heparin, was used as an anticoagulant (Table 3) due to defaults in extracellular calcium in blood samples. The behaviour of CRP and ESR was similar to the expression of neutrophil CR1 in that they were significantly higher in bacterial than in viral infections. In addition to the measured variables, we defined a computational variable by multiplying the neutrophil count, mean fluorescence intensity (MFI) of FITC-conjugated CR1-specific monoclonal antibodies on neutrophils and MFI of PE-conjugated CR3-specific monoclonal antibodies on neutrophils (= neutrophil count × relative number of CR1 on neutrophils × relative number of CR3 on neutrophils). The index obtained by taking the base-10 logarithm of this factorial represents the total number of neutrophil complement receptors per blood sample volume (TNCR index, Table 3.) The TNCR index has somewhat higher specificity (89% versus 85%) than neutrophil CR1 in distinguishing between bacterial and viral infections [9].
Figure 1.

Subgroups of patients. Subgroup classification was based on medical and microbiological examination, including bacterial cultures, serological assays, and identification of microbial antigens or nucleic acids from nasopharyngeal, urine, cerebrospinal fluid, or blister specimens. The healthy volunteer control group is also defined. Parentheses include the number of presented cases.
Table 3.
Parameters measured in the patient material expressed as mean (S.D.). Receptor expression data from both heparin and EDTA anticoagulated blood samples are presented.
| Variables | Microbiologically confirmed | Healthy Control | Clinically diagnosed | ||
|---|---|---|---|---|---|
| Bacterial infection | Viral infection | (n = 60) | Bacterial infection | Viral infection | |
| (n = 46) | (n = 38) | (n = 43) | (n = 8) | ||
| CRP (mg/L) | 232 (135) | 40 (41) | — | 217 (103) | 43 (49) |
| ESR (mm/h) | 65 (28) | 19 (19) | — | 69 (27) | 22 (15) |
| WBC (×109/L) | 11 (4.9) | 7.7 (4.1) | 4.8 (1.3) | 9.8 (4.8) | 5.9 (1.4) |
| PMNL (%) | 71 (14) | 51 (22) | 51 (9.8) | 74 (13) | 49 (20) |
| PMNL (×109/L) | 8.2 (3.6) | 3.5 (2.0) | 2.6 (0.9) | 7.5 (3.9) | 2.6 (1.0) |
|
| |||||
| Heparin sample | |||||
| Neutrophil CR1 | 21 (9.9) | 5.7 (2.9) | 6.3 (2.2) | 20 (7.5) | 6.4 (3.3) |
| Neutrophil CR3 | 100 (51) | 54 (23) | 49 (18) | 104 (45) | 59 (35) |
| TNCR index | 4.1 (0.5) | 2.9 (0.5) | 2.8 (0.3) | 4.0 (0.5) | 2.9 (0.5) |
| CIS point | 6.2 (1.7) | 0.6 (1.0) | — | 6.3 (1.9) | 0.6 (1.2) |
|
| |||||
| EDTA sample | (n = 15) | (n = 6) | (n = 18) | ||
| Neutrophil CR1 | 8.3 (2.4) | 6.2 (2.8) | 4.8 (1.3) | — | — |
| Neutrophil CR3 | 34 (12) | 36 (11) | 28 (6.0) | — | — |
Figure 2.

Formation of clinical infection score (CIS) point.
5. Distinguishing between Bacterial and Viral Infections with the Clinical Infection Score (CIS) Point [9, 10]
To determine whether the diagnostic yield of measured individual variables increases upon combination, we estimated the clinical infection score (CIS) point consisting of four variables, including CRP (ROC curve cutoff point = 77 mg/L), ESR (28 mm/h), mean amount of CR1 on neutrophil (MFI of 8.7) and TNCR index (3.4). For every variable measured, a result less than the cutoff point was converted to a variable score point of 0, that between the cutoff point and an additional second cutoff value (161 mg/L for CRP, 42 mm/h for ESR, MFI of 13.5 for CR1 and 3.9 for TNCR index), was converted to a variable score point of 1, and that greater than the additional second cutoff point value was converted to a variable score point of 2 (Figure 2(a)). An additional second cutoff value of a variable was the maximum value detected in patients with viral infection. The maximum virus value of higher than the average value of bacterial infection (epidemic nephropathy, ESR of 112 mm/h) was ignored when additional second cutoff values were put in their places. We obtained CIS points that varied between 0 and 8 by combining variable scores (Figure 2(b)). At a cutoff point of >2, the CIS points differentiated between microbiologically confirmed bacterial infection (n = 46) and viral infection (n = 38) with 98% sensitivity and 97% specificity [9].
6. Distinguishing between dsDNA and ssRNA Virus Infections with the DNA Virus Score (DNAVS) Point [11]
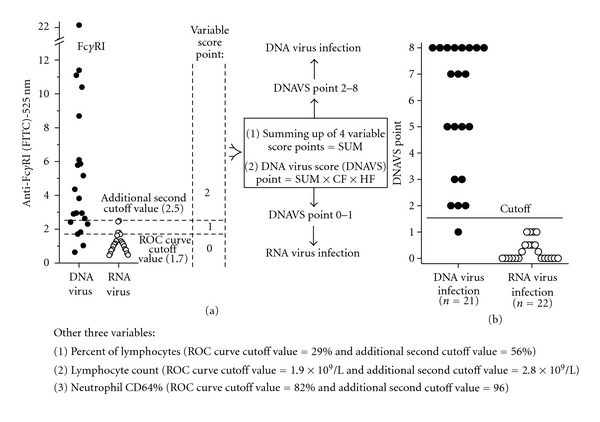
Similarly to CIS point, we estimated the DNA virus score (DNAVS) point consisting of four variables, including mean amount of CD64 on neutrophil (ROC curve cutoff point = MFI of 1.7), neutrophil CD64% (82%), percent of lymphocytes (29%), and lymphocyte count (1.9 × 10⁹/L). For every variable measured, a result less than the cutoff point was converted to a variable score point of 0, that between the cutoff point and an additional second cutoff value (MFI of 2.5 for CD64, 96% for neutrophil CD64%, 56% for percent of lymphocytes, and 2.8 × 10⁹/L for lymphocyte count) was converted to a variable score point of 1, and that greater than the additional second cutoff point value was converted to a variable score point of 2. An additional second cutoff value of a variable was the maximum value detected in patients with ssRNA virus infection (Figure 3). After data conversion, we obtained SUM that varied between 0 and 8 by adding four variable score points together. Next, we defined a DNAVS point by multiplying the SUM, CD64 factor (CF), and haematopoietic factor (HF) (DNAVS point = SUM × CF × HF). CF of 0.25 was used when variable score point of both receptor variables was 0. If variable score point of both haematopoietic variables was 0, then HF of 0.5 was used. In all the other cases, CF and HF were 1. At a cutoff point of higher than or equal to 1.5, the DNAVS points differentiated between dsDNA and ssRNA virus infections with 95% sensitivity and 100% specificity [11].
Figure 3.

Formation of DNA virus score (DNAVS) point.
7. Distinguishing between Bacterial Infections, Viral Infections and Inflammatory Diseases with the Analysis of FcγRI Expression [12–14]
The average number of FcγRI on the surfaces of both neutrophils and monocytes was significantly increased in patients with febrile viral and bacterial infections, compared to healthy controls. Furthermore, we describe a novel marker of febrile infection, designated “CD64 score point”, which incorporates the quantitative analysis of FcγRI expressed on both neutrophils and monocytes, with 94% sensitivity and 98% specificity in distinguishing between febrile infections and healthy controls. By contrast, analysis of FcγRI expression on neutrophils and monocytes displayed poor sensitivity (73% and 52%) and specificity (65% and 52%) in distinguishing between bacterial and viral infections, and the levels did not differ significantly between systemic (sepsis), local, and clinically diagnosed bacterial infections. Thus, the increased number of FcγRI on neutrophils and monocytes is a useful marker of febrile infection but cannot be applied for differential diagnosis between bacterial and viral infections or between systemic and local bacterial infections [12].
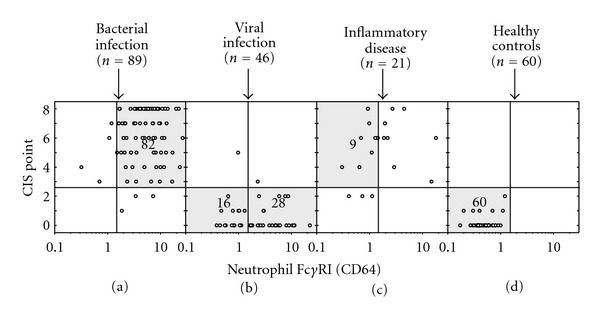
As noticed above, the expression of neutrophil CD35 is higher in bacterial than in viral infections. Neutrophil CD35-based differentiation between bacterial and viral infections can be improved by generating the CIS point. We further developed CD64/CIS point bivariate dot-plot graph (Figures 4(a)–4(d)), where the vertical and horizontal lines are set to represent the optimal cutoff point, MFI value of 1.5 for neutrophil FcγRI and 2.5 for CIS point value, respectively. The bivariate dot-plot graph can be divided into four quadrants: upper left quadrant (ULQ), upper right quadrant (URQ), lower left quadrant (LLQ), and lower right quadrant (LRQ). Now, 92% of bacterial infections are located in URQ whereas viral infections are located in LLQ (35%) or in LRQ (61%). Inflammatory diseases distributed to LLQ (14%), ULQ (43%), and URQ (43%) [13].
Figure 4.

FcγRI/CIS point bivariate dot-plot graph.
8. Detecting Gram-Positive Sepsis [15]
In Gram-negative bacterial infection (n = 21), the average amount of CD11b on neutrophils was significantly higher than in gram-positive bacterial infection (n = 22). On the contrary, CRP level was significantly higher in Gram-positive than in gram-negative bacterial infection. By dividing the serum CRP value by the amount of CD11b on neutrophils, we derived a novel marker of Gram-positive sepsis, CRP/CD11b ratio, which displayed 76% sensitivity and 80% specificity for the detection of Gram-positive sepsis (n = 17) among febrile patients with microbiologically confirmed or clinically diagnosed bacterial infection.
9. Conclusion
Treating viral illnesses or noninfective causes of inflammation with antibiotics is ineffective and contributes to the development of antibiotic resistance, toxicity and allergic reactions, leading to increasing medical costs. A major factor behind unnecessary use of antibiotics is, of course, incorrect diagnosis. For this reason, timely and accurate information on whether the infection is bacterial in origin would be highly beneficial in the fight against antibiotic resistance. The analysis of the expression levels of FcγRI, CR1, and CR3, along with CRP and ESR data, provides a novel application to the diagnosis of infectious and inflammatory diseases. The best clinical benefit from the quantitative analysis of these markers will be obtained when the individual variables are combined to generate the CIS point method for a reliable bacterial infection marker, DNAVS point for differentiating between DNA and RNA virus infections, CD64 score point for a marker of febrile infection and CRP/CD11b ratio for a marker of gram-positive sepsis.
References
- 1.Ofek I, Goldhar J, Keisari Y, Sharon N. Nonopsonic phagocytosis of microorganisms. Annual Review of Microbiology. 1995;49:239–276. doi: 10.1146/annurev.mi.49.100195.001323. [DOI] [PubMed] [Google Scholar]
- 2.Bournazos S, Woof JM, Hart SP, Dransfield I. Functional and clinical consequences of Fc receptor polymorphic and copy number variants. Clinical and Experimental Immunology. 2009;157(2):244–254. doi: 10.1111/j.1365-2249.2009.03980.x. [DOI] [PMC free article] [PubMed] [Google Scholar]
- 3.Nuutila J, Jalava-Karvinen P, Hohenthal U, et al. Comparison of degranulation of easily mobilizable intracellular granules by human phagocytes in healthy subjects and patients with infectious diseases. Human Immunology. 2009;70(10):813–819. doi: 10.1016/j.humimm.2009.06.017. [DOI] [PubMed] [Google Scholar]
- 4.Leino L, Sorvajärvi K, Katajisto J, et al. Febrile infection changes the expression of IgG Fc receptors and complement receptors in human neutrophils in vivo. Clinical and Experimental Immunology. 1997;107(1):37–43. doi: 10.1046/j.1365-2249.1997.d01-899.x. [DOI] [PMC free article] [PubMed] [Google Scholar]
- 5.Isolauri E, Pelto L, Nuutila J, Majamaa H, Lilius EM, Salminen S. Altered expression of IgG and complement receptors indicates a significant role of phagocytes in atopic dermatitis. Journal of Allergy and Clinical Immunology. 1997;99(5):707–713. doi: 10.1016/s0091-6749(97)70034-4. [DOI] [PubMed] [Google Scholar]
- 6.Salminen E, Kankuri M, Nuutila J, Lilius EM, Pellimiemi TT. Modulation of IgG and complement receptor expression of phagocytes in kidney cancer patients during treatment with interferon-α . Anticancer Research. 2001;21(3):2049–2055. [PubMed] [Google Scholar]
- 7.Hohenthal U, Nuutila J, Lilius EM, Laitinen I, Nikoskelainen J, Kotilainen P. Measurement of complement receptor 1 on neutrophils in bacterial and viral pneumonia. BMC Infectious Diseases. 2006;6, article 11 doi: 10.1186/1471-2334-6-11. [DOI] [PMC free article] [PubMed] [Google Scholar]
- 8.Faurschou M, Borregaard N. Neutrophil granules and secretory vesicles in inflammation. Microbes and Infection. 2003;5(14):1317–1327. doi: 10.1016/j.micinf.2003.09.008. [DOI] [PubMed] [Google Scholar]
- 9.Nuutila J, Hohenthal U, Laitinen I, et al. Quantitative analysis of complement receptors, CR1 (CD35) and CR3 (CD11b), on neutrophils improves distinction between bacterial and viral infections in febrile patients: comparison with standard clinical laboratory data. Journal of Immunological Methods. 2006;315(1-2):191–201. doi: 10.1016/j.jim.2006.07.021. [DOI] [PubMed] [Google Scholar]
- 10.Nuutila J, Lilius EM. Distinction between bacterial and viral infections. Current Opinion in Infectious Diseases. 2007;20(3):304–310. doi: 10.1097/QCO.0b013e3280964db4. [DOI] [PubMed] [Google Scholar]
- 11.Nuutila J, Hohenthal U, Laitinen I, et al. A novel method for distinguishing between dsDNA and ssRNA virus infections. Journal of Clinical Virology. 2008;43(1):49–55. doi: 10.1016/j.jcv.2008.04.004. [DOI] [PubMed] [Google Scholar]
- 12.Nuutila J, Hohenthal U, Laitinen I, et al. Simultaneous quantitative analysis of FcγRI (CD64) expression on neutrophils and monocytes: a new, improved way to detect infections. Journal of Immunological Methods. 2007;328(1-2):189–200. doi: 10.1016/j.jim.2007.09.002. [DOI] [PubMed] [Google Scholar]
- 13.Jalava-Karvinen P, Hohenthal U, Laitinen I, et al. Simultaneous quantitative analysis of FcγRI (CD64) and CR1 (CD35) on neutrophils in distinguishing between bacterial infections, viral infections, and inflammatory diseases. Clinical Immunology. 2009;133(3):314–323. doi: 10.1016/j.clim.2009.08.003. [DOI] [PubMed] [Google Scholar]
- 14.Nuutila J. The novel applications of the quantitative analysis of neutrophil cell surface FcγRI (CD64) to the diagnosis of infectious and inflammatory diseases. Current Opinion in Infectious Diseases. 2010;23(3):268–274. doi: 10.1097/QCO.0b013e32833939b0. [DOI] [PubMed] [Google Scholar]
- 15.Nuutila J, Jalava-Karvinen P, Hohenthal U, et al. CRP/CD11b ratio: a novel parameter for detecting gram-positive sepsis. Human Immunology. 2009;70(4):237–243. doi: 10.1016/j.humimm.2009.01.009. [DOI] [PubMed] [Google Scholar]


