

Abstract
Background
Hyperglycaemia is associated with retinopathy, and this cross-sectional relation has been used to define thresholds for defining diabetes. We evaluate the predictive values of HbA1c and fasting plasma glucose (FPG) for retinopathy, ten years after the baseline examination.
Methods
700 men and women from the D.E.S.I.R. study were evaluated for retinopathy using a non-mydriatic digital camera. Over the preceding nine years: 235 had diabetes (treated or FPG>7.0 mmol/l at least once), 227 had an impaired fasting glucose (IFG:6.1–6.9 mmol/l) at least once, 238 always had normal glucose levels (<6.1 mmol/l).
Results
The 44 participants with retinopathy at ten years had higher baseline mean (SD) for FPG and HbA1c, than those without retinopathy, 7.24mmol/l (2.72) vs 5.90mmol/l (1.22) and 6.4% (1.6) vs 5.7% (0.7) (both P<0.0001). The frequency of retinopathy at ten years, standardized according to the distribution of glycaemia across the entire D.E.S.I.R. population was 3.6%. In our population, FPGs of 6.0mmol/l and 6.5mmol/l had positive predictive values of 8.2% and 15.4% respectively for retinopathy at ten years, and HbA1cs of 6.0% and 6.5%: 6.0% and 14.8%. After ten years of follow-up, retinopathy was equally frequent in IFG and in those who became diabetic during the study: 8.6% and 6.7% respectively, lower than in those diabetic at baseline 13.9%.
Conclusion
As the positive predictive values for retinopathy increased sharply from 6.0 mmol/l for FPG, and from 6.0% for HbA1c, these thresholds are proposed to identify those at risk of retinopathy ten years later.
Keywords: epidemiology, diabetes, fasting plasma glucose, HbA1c, retinopathy, longitudinal
It is well accepted that the hyperglycaemia accompanying diabetes is associated with microvascular complications, in particular retinopathy, and indeed one of the reasons for choosing the thresholds in the current definition of diabetes was that the frequency of retinopathy and nephropathy started to increase, in cross-sectional studies, above these levels of glucose and HbA1c.1,2 The determination of thresholds has been done by eye, and in some studies a change point model3,4 has been used to identify the glycaemic level where the prevalence of retinopathy changes from a constant to an increasing rate.
However, there is some controversy concerning the actual value of this glycaemic threshold for identifying retinopathy. Wong et al. re-examined the relation between fasting plasma glucose (FPG) and retinopathy in three contemporary studies, and found that while the prevalence of retinopathy increased with FPG concentrations, there was no clear diagnostic cutoff.4 More recently, in Malay adults from Singapore, HbA1c thresholds of 6.6% and 7.0% were identified in relation with mild and moderate retinopathy, respectively, using ‘optimal values’ from receiver operating characteristic (ROC) curves.5 It is now well established that the non-diabetic population also suffers from retinopathy,6–14 albeit at a lower frequency than diabetic patients, and in a milder form, indicating that there may be factors other than glucose which increase the risk of retinopathy.
There have been many more cross-sectional than prospective studies of retinopathy.4 There are few studies of incident diabetes in general populations and most of these studies have focused on either FPG or HbA1C as risk factors for retinopathy, rarely both. Some other risk factors for incident retinopathy have been identified.15–18 The Bedford Study in the UK was one of the earliest to study the presence of retinopathy at seven years, in individuals with “borderline diabetes” at baseline: 2 hour glucose between 6.7 and 11.1 mmol/l, after a 50g oral glucose tolerance test.6 One of most complete studies was from the Pima Indians,19 and included almost 1000 individuals, followed over 5 years. Dividing the FPG and 2 hour glucose concentrations and HbA1c levels into deciles, they showed a sharp increase in incident retinopathy in the two highest decile groups.
The aim of this report was to study the frequency of retinopathy in individuals 10 years after baseline, according to baseline levels of FPG and HbA1c, and to evaluate positive predictive values for retinopathy at various levels of these two glycaemic parameters. The secondary objective was to evaluate potential risk factors associated with retinopathy, at baseline, and over the nine years preceding the evaluation of retinopathy.
METHODS
PARTICIPANTS
The men and women in this study participated in the D.E.S.I.R. cohort (Data from an Epidemiological Study on the Insulin Resistance Syndrome), and they were recruited in 1994–1996 from consultants in ten French Social Security health examination centres in the central western part of France.20 At entry into the study, participants were aged 30 to 65 years, and they were re-invited to health examinations three, six and nine years after inclusion. After the year-nine examination, the 321 individuals who had been treated for diabetes or who had a FPG ≥ 7.0 mmol/l at some time during the study, were invited to attend a special examination on microvascular complications of diabetes, in particular an examination of the retina: 237 (74%) participated, 17 had died. For comparison, two other groups, matched by age, sex and examination centre with those in the diabetes group, were also invited to the retinal examination: group 1, impaired fasting glucose (IFG: FPG 6.1–6.9 mmol/l) at any time during the study; group 2, normal glucose levels (FPG < 6.1 mmol/l) during the entire study. There were 246 individuals in the IFG group (68% participation, 9 had died) and 249 (56% participation, 3 had died) in the normal FPG group. In comparison to the 237 diabetic individuals who participated in the study, the 94 who did not participate had higher glucose (but not HbA1c) levels and higher systolic blood pressure at inclusion, but did not differ according to age, or sex; no differences were seen between those who did or did not participate in the IFG or the normal FPG groups. At the year-10 examination, eight of the participants selected as IFG were treated for diabetes, so they were analysed in the diabetes group.
We excluded from this analysis, the 18 individuals for whom the photographs were not interpretable for either eye, and we excluded a further 15 participants for whom only one eye was interpretable; they had similar baseline characteristics to those included in the analysis, excepting those excluded were older (P < 0.001); 10 were in the diabetes group, 11 in the IFG group, and 12 in the normal FPG group.
Our analysis thus included 700 participants: 235 with diabetes (145 treated for diabetes of whom 36 were treated for diabetes at baseline, 90 had at least one FPG > 7.0 mmol/l); 227 with IFG at some time during the study; 238 with normal glucose levels during the entire study.
The D.E.S.I.R. study was approved by the Kremlin Bicêtre Hospital ethics committee, and participants signed an informed consent.
METHODS OF MEASUREMENTS AT BASELINE
Blood pressure was taken in a supine position after 5 minutes of rest and waist circumference (the smallest circumference between the lower rib and the iliac crests), weight and height were measured in lightly clad participants, and the BMI calculated.
All biochemical measurements were from one of four health centre laboratories at La Riche, Blois, Chartres or Orleans. FPG was measured by the glucose-oxidase method, using a Technicon RA100 (Bayer Diagnostics, Puteaux, France) or a Specific or a Delta (Konelab, Evry, France). HbA1c was measured using an automated HPLC ion-exchange analyser from Hitachi/Merck-VWR or a DCA 2000 automated immunoassay system from Bayer Diagnostics, Puteaux, France. To adjust for differences between laboratories, both glucose and HbA1c data were standardized in age and sex strata, with respect to reference data assayed in the La Riche laboratory. Serum insulin was quantified centrally, by Micro particle Enzyme Immunoassay with an IMX automated analyser from Abbott (Rungis, France). Total cholesterol, HDL-cholesterol and triglycerides were assayed by a DAX 24 (Bayer Diagnostics, Puteaux, France) or a KONE (Evry, France); LDL-cholesterol was determined by the Friedwald equation. C reactive protein (CRP) levels were assessed by immunonephelemetric method (Dade Behring Marburg), and were only available on 206 participants at baseline and at the three year follow-up, but on all participants at the six and nine year follow-up examinations. The inter-laboratory variability was assessed monthly on normal and pathological values for each biologic variable, the coefficients of variation for laboratories were lower than 6% over the inclusion period.
Albuminuria was determined from a single-void sample by nephelometry (BNA Behring, Rueil-Malmaison, France) in participants without dip-stick positive hematuria. Micro- or macro-albuminuria was defined as albuminuria above 20 mg/l or dip-stick positive proteinuria.
Participants completed a self-administered questionnaire on whether they had a family history of diabetes, and drug treatment for diabetes, hypertension or lipids. The presence of clinical retinopathy was not recorded at baseline.
RETINAL PHOTOGRAPHY
The Topcon TRC-NW6 camera (Topcon, Rotterdam, The Netherlands) is a non-mydriatic digital retinal camera which allows color photographs to be taken without papillary dilation, using semiautomatic guidance for peripheral fixation. Images were captured in true colour (24 bits) at a resolution of 1490 x 960 pixels. Retinal photographs were taken by a qualified orthoptist who was specifically trained for this study. The room was well-darkened and three photographs taken: one centered on the macula, one on the optic disc and the third one temporal to the macula. The right eye was always photographed first, after 5 minutes of adaptation to the dark. Participants were asked to close their eyes for a few seconds between each photograph. After an interval of 2–3 minutes, the left eye was photographed. The orthoptist, who was blinded to the glycaemic status of the participant, viewed each digital image immediately, and repeated the image acquisition process if the original image was unsatisfactory.
EVALUATION OF RETINAL PHOTOGRAPHS
Images were displayed on a 21-inch monitor (resolution 1280 × 1024 × 24 bits). All photographs were graded for quality and retinal characteristics. Image processing with IMAGEnet 2000 software (Topcon, Rotterdam, The Netherlands) was used to enhance grading accuracy.
All photographs were graded by a trained observer, according to a simplified version of the Wisconsin protocol,21 and a sample of 60 photographs was chosen and graded a second time by the same observer and also by a second observer, for intra- and inter-observer reproducibility. Retinal characteristics are shown for the worst eye; individuals with microaneurysms, hemorrhages, exudates, cotton-wool spots, intra microvascular abnormalities (IRMAs), venous bleedings or new vessels were classified as having retinopathy.
The intra- and inter-observer reproducibility for retinopathy grading was 97% and 95%. As stated above, 33 participants (4.7%) had ungradeable photographs in at least one eye and were excluded from the analysis
STATISTICAL METHODS
All analyses used SAS (version 9.1.3, SAS Institute, Cary, NC). For statistical analysis, the logarithms were taken of variables which were skewed: glucose, HbA1c, triglycerides, insulin, CRP. Men and women were analysed together.
Baseline characteristics were compared by t- and χ2 -tests, according to whether or not participants had any retinopathy ten years after baseline. Further, the areas under the curve over the 9 years of the study, were calculated for putative risk factors, and compared between those with and without retinopathy, by t-tests; when there was missing data, it was imputed by the average of neighbouring observations, or if data was missing at the nine-year follow-up, the six-year values were used.
As this study population was selected to provide three groups, matched by age, sex and examination centre with those in the diabetic group, it is not representative of the entire D.E.S.I.R. cohort. Thus, we standardized the frequencies of ten-year retinopathy according to the selection criteria for this study, glycaemic status, using the baseline distributions of fasting plasma glucose and HbA1c in these three glycaemic groups. The 10 year prevalence of retinopathy is given according to six classes of 0.5 mmol/l for FPG, and six classes of 0.5% for HbA1c; positive predictive values are shown by units of 0.1 mmol/l and 0.1% respectively. Confidence intervals were calculated for frequencies, and they were compared between groups by χ2 -tests. The receiver operating characteristic (ROC) curve was drawn and the c-statistic which is equivalent to the area under the ROC curve (AROC) was calculated.
The presence of retinopathy ten years after baseline was modelled by logistic regression, with the logarithms of FPG and HbA1c as independent variables. These relations were linear, as the addition of a squared term did not improve the model; these models were additionally adjusted on age, sex, BMI, systolic blood pressure, and hypertensive treatment. Pearson correlation coefficients were determined between FPG and HbA1c.
RESULTS
Over 70% of the participants with diabetes at nine years were men, thus in this study, 70% were men due to gender-matching (Table 1). The average age at baseline was 52 years. A total of 44 participants were classified as having retinopathy: 19 with diabetes (5 treated at baseline, 15 treated at the examination, 4 with fasting plasma glucose ≥7.0 mmol/l during the study), 19 with IFG and 6 with normal glucose levels throughout the 9 years of the study. In most participants, retinopathy was mild, limited to microaneurysms and/or haemorrhages. Those with retinopathy were more often treated for diabetes at baseline than those without retinopathy (11% vs 5%, P = 0.06) (Table 1), and they had a higher baseline mean FPG and HbA1c (P < 0.0001), with a trend for a higher systolic blood pressure, 142 vs 137 mmHg (P = 0.06), and a higher percentage were treated for hypertension, 36% vs 20% (P < 0.008). Of the six participants who were always normoglycaemic but who had signs of retinopathy, five were women; they had similar age, BMI, blood pressures, and lipid parameters, as the other 38 participants with retinopathy. None of these six had cardiovascular disease, nor microalbuminuria; five had a few microaneurysms and/or retinal haemorrhages, and one cotton wool spots.
Table 1.
Characteristics at baseline (mean (SD), n (%)) associated with the absence or presence of retinopathy at ten years. The D.E.S.I.R. Study
| No retinopathy n=656 |
Retinopathy n=44 |
P - value* | |
|---|---|---|---|
| Age | 52 (8) | 53 (8) | 0.5 |
| Men | 476 (73%) | 28 (64%) | 0.2 |
| Family history of diabetes | 140 (21%) | 11 (25%) | 0.6 |
| Treated for diabetes at baseline | 31 (5%) | 5 (11%) | 0.06 |
| Treated for diabetes at 10 years | 130 (20%) | 15 (34%) | 0.03 |
| BMI (kg/m2) | 26.3 (3.9) | 27.2 (4.0) | 0.1 |
| Waist circumference (cm) | 90 (11) | 92 (11) | 0.2 |
| Fasting plasma glucose* (mmol/l) | 5.90 (1.22) | 7.24 (2.72) | 0.0001 |
| HbA1c* (%) | 5.7 (0.7) | 6.4 (1.6) | 0.0001 |
| Fasting serum insulin* (pmol/l) | 56.2 (39.4) | 62.2 (31.6) | 0.1 |
| Systolic Blood Pressure (mmHg) | 137 (16) | 142 (17) | 0.06 |
| Diastolic Blood Pressure (mmHg) | 83 (10) | 84 (10) | 0.6 |
| Hypertensive treatment | 128 (20%) | 16 (36%) | 0.008 |
| Triglycerides* (mmol/l) | 1.44 (1.67) | 1.61 (1.23) | 0.2 |
| HDL-cholesterol (mmol/l) | 1.53 (0.40) | 1.49 (0.41) | 0.5 |
| LDL-cholesterol (mmol/l) | 3.75 (0.91) | 3.90 (0.77) | 0.3 |
| Lipid treatment | 88 (13%) | 4 (9%) | 0.4 |
| CRP* (mg/l) n=206 | 2.71 (4.10) (n=193) | 2.66 (2.50) (n=13) | 0.9 |
| Micro or Macro albuminuria | 86 (15%) | 9 (23%) | 0.2 |
logarithms used for statistical analyses
Over the nine year follow-up, the area under the curve analysis showed that FPG and HbA1c were the factors most associated with retinopathy at 10 years (P < 0.0001), but triglyceride levels was higher in those with retinopathy (1.68 vs 1.42 mmol/l, P < 0.04, Table 2). CRP was analysed on only 206 of the participants, and showed a marginal relation with retinopathy; the average areas under the curve for years six and nine, when data was available for all participants, were 3.4 vs 2.7 mg/l (P < 0.01) for those with and without retinopathy.
Table 2.
Average (SD) of area under the curve per year over the 9 years of follow-up for various characteristics associated with the absence or presence of retinopathy at ten years. The D.E.S.I.R. Study
| No retinopathy n=656 |
Retinopathy n=44 |
P - value* | |
|---|---|---|---|
| BMI (kg/m2) | 26.8 (4.1) | 27.8 (3.6) | 0.1 |
| Waist circumference (cm) | 92 (11) | 94 (10) | 0.1 |
| Glucose* (mmol/l) | 6.11 (1.15) | 7.30 (2.23) | 0.0001 |
| HbA1c* (%) | 5.9 (0.7) | 6.5 (1.4) | 0.0001 |
| Insulin* (pmol/l) | 67.8 (41.9) | 77.7 (48.7) | 0.1 |
| Systolic Blood Pressure (mmHg) | 140 (15) | 143 (18) | 0.1 |
| Diastolic Blood Pressure (mmHg) | 83 (8) | 84 (9) | 0.4 |
| Triglycerides* (mmol/l) | 1.42 (0.86) | 1.68 (1.01) | 0.04 |
| HDL-cholesterol (mmol/l) | 1.49 (0.35) | 1.40 (0.34) | 0.1 |
| LDL-cholesterol (mmol/l) | 3.63 (0.67) | 3.79 (0.65) | 0.1 |
| CRP*(mg/l) n=206 (n=193 & 13) | 2.5 (2.6) | 3.2 (1.9) | 0.07 |
logarithms used for statistical analyses
The overall frequency of retinopathy at ten years, standardized to the baseline glucose status in the study, was 3.6%, and there was a sharp increase in frequency in the group with the highest baseline glucose levels, FPG > 7.0 mmol/l (Fig. 1A), with a highly significant difference in frequency between the last two glucose groups (P < 0.0001). For the 0.5% HbA1c groups, the frequency of retinopathy also increased in a similar fashion (Fig. 1B), with a statistically significant difference between the last two HbA1c groups (P < 0.05). When individuals with drug treated diabetes at baseline were excluded from the analysis, the relations were little changed (Fig. 1A and 1B).
Figure 1.
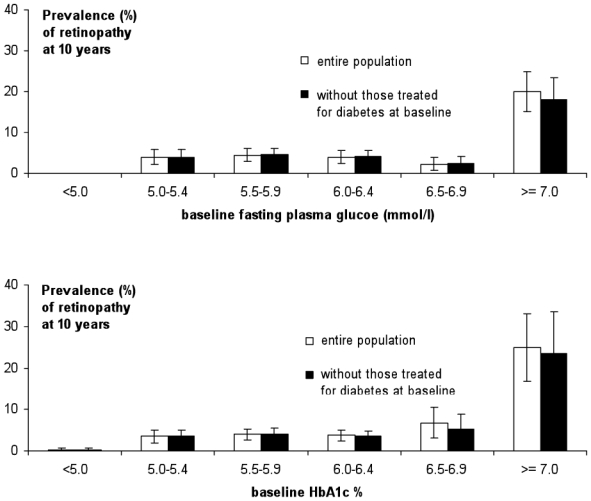
Frequency (SE) of retinopathy ten years after baseline for all participants □, and without those treated for diabetes at baseline ■, according to: A. baseline fasting plasma glucose concentrations (mmol/l); B. baseline HbA1c levels (%)
For the positive predictive values (Fig. 2A and 2B), there were essentially two parts to the relations, a very gradual increase, then a higher slope after around 6.0 mmol/l for FPG and around 6.0% for HbA1c. These could be considered as potential thresholds for defining those at risk of later retinopathy.
Figure 2.
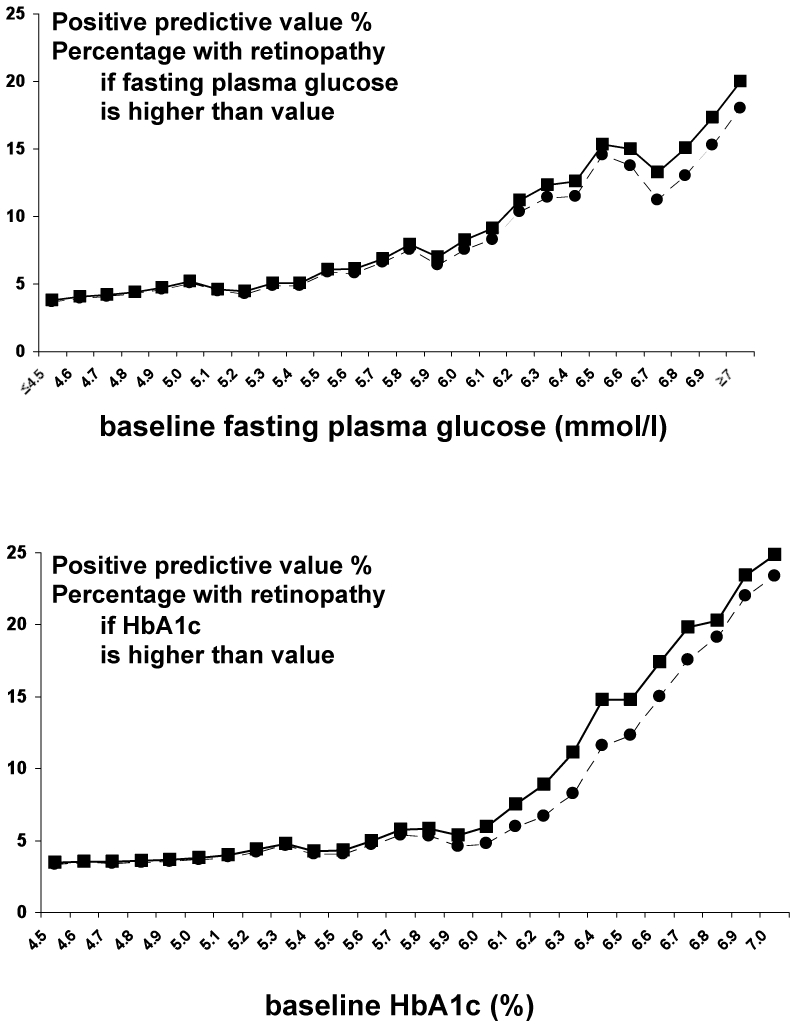
Positive predictive values for the prevalence of retinopathy ten years after baseline for all participants —■— and those not treated for diabetes at baseline --●-- by: A. baseline fasting plasma glucose concentrations (mmol/l); B. baseline HbA1c (%)
A FPG of 6.0 mmol/l had a positive predictive value of 8%, a negative predictive value of 97%, sensitivity and specificity of 28% and 88% and a positive likelihood ratio of 2.6. For an HbA1c of 6.0%, the corresponding values were 6%, 98%, 19%, 92% and 1.8. For a glucose threshold of 6.5 mmol/l, these values were 15%, 97%, 19%, 96%, 4.8 and for an HbA1c of 6.5%: 14%, 97%, 9%, 98%, 4.8. Once again, little change was observed when patients with diabetes at baseline were excluded. The ROC curves are fairly shallow for both FPG and HbA1c (Fig. 3), and the area under the curve was 64% for both measures.
Figure 3.
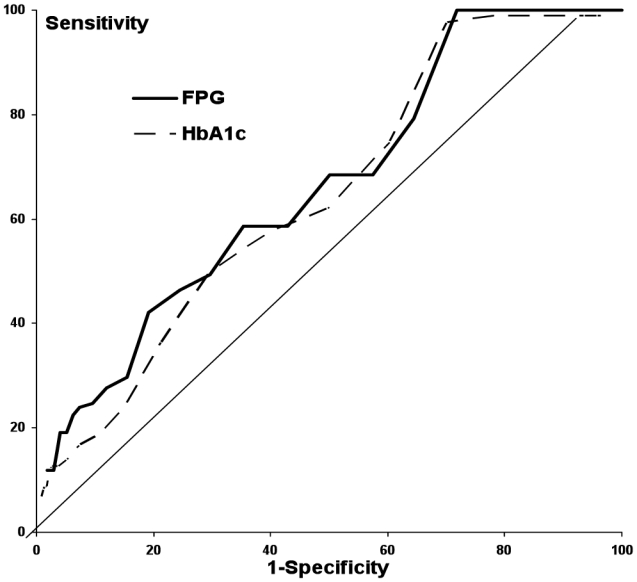
Receiver Operating Characteristic (ROC) curves for 10-year retinopathy according to baseline fasting plasma glucose — — and to baseline HbA1c - - - -.
The frequencies (95% CI) of ten-year retinopathy were 2.5% (0.5–4.5) in participants who were always normoglycaemic, higher in those IFG at some time during the ten-year follow-up 8.6% (5.0–12.2) (P < 0.0001), similar to the 7.9% (4.4–11.3) (P < 0.01 in comparison to normoglycaemic) in participants diabetic at the end of the follow-up (Fig. 4). The frequency of retinopathy in the 36 individuals treated for diabetes at baseline was 13.9% (2.6–25.2), in comparison to a frequency of 6.7% (3.2–10.3) in the 199 participants who became diabetic during the ten years of the study.
Figure 4.
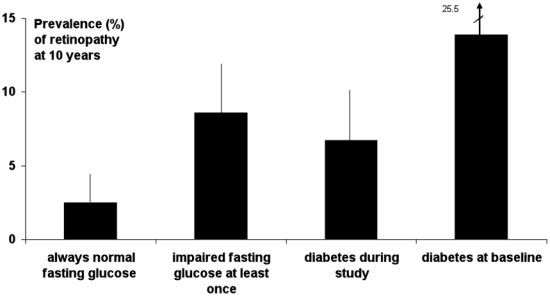
Frequency (95% CI) of retinopathy ten years after baseline, according to glucose status during the 10 year study.
The Pearson correlation coefficients between the logarithms of FPG and HbA1c was quite high, 0.73. In univariate regression models, FPG was more closely associated with retinopathy than HbA1c (χ2 Wald Statistics were 26.75 and 18.81 respectively, both P < 0.0001). There was no improvement in adding HbA1c to the model with FPG alone. Both FPG and HbA1c remained predictive of 10-year retinopathy (P < 0.0001, 0.0003) after adjusting for age, sex, hypertensive treatment, systolic blood pressure, none of which were significant. Using the area under the ROC curve as a measure to discriminate between those with and without 10-year retinopathy, the areas were 64% for FPG alone as well as for HbA1c alone or for the combination of risk factors: age, sex, hypertensive treatment, systolic blood pressure; thus all three models discriminate equally. Adding FPG to the basic risk factors, the area to increased 72%, while adding HbA1c the increase was lower at 69%, and adding HbA1c to the model with FPG and the risk factors the area remained at 72%, thus addition of HbA1c did not improve the discrimination.
COMMENT
The positive predictive values for retinopathy, increased very slowly for both baseline FPG and HbA1c at lower values, and then increased more rapidly at the values we might consider indicative of diabetes risk: approximately 6.0 mmol/l for FPG and 6.0% for HbA1c. It is more difficult to discern a threshold after which the frequency of retinopathy increased, as the frequency can only be presented by grouping the glycaemic measures into intervals. The positive predictive values provide more information about possible thresholds. Further, we emphasise the use of the positive predictive values as they are more clinically relevant to find thresholds to predict those who will have retinopathy in the future – rather than sensitivity, which is the probability of having an FPG or an HbA1c above a given threshold, given the individual had 10-year retinopathy.
Baseline hypertension was associated with later retinopathy, and over the nine year follow, higher triglyceride and CRP levels were associated with 10-year retinopathy.
The strengths of this study are the long-term follow-up, the nine-year characterisation of risk factors and the method to detect retinopathy, using a non-mydriatic digital camera, with three photographs per eye, which is more sensitive in detecting diabetic retinopathy than ophthalmoscopy. We were not able to study grades of severity of retinopathy, because of their low frequency, even among those treated for diabetes at baseline. As retinopathy was not evaluated at baseline, and there was no information recorded about clinical retinopathy, we are not able to study of the incidence of retinopathy. Our study included volunteers for a free health check-up, who agreed to participate in the nine-year D.E.S.I.R. study, and then for an additional examination to study diabetic microvascular disease. This type of self-selection is a common limitation in studies in the general population, but should not change the relations between the glycaemic parameters or other risk factors and the outcome. Our sample size only permits us find those risk factors with a strong association with retinopathy.
The American Diabetes Association and the World Health Organisation used a FPG of 7.0 mmol/l or higher to define diabetes,1,22 based on three pivotal studies which showed that signs of retinopathy were rare below a FPG <7.0 mmol/l, but that the prevalence increased substantially above this level. These studies suffered from poor methodology to detect diabetic retinopathy, based either on ophthalmoscopy or a one field photograph. Re-evaluating this threshold in three contemporary studies, using multiple retinal photographs and a validated retinal grading, Wong et al. found that the prevalence of retinopathy increased with FPG concentration, without a clear diagnostic cut-off.4 They also found that signs of retinopathy occur in 7–13% of the population below the FPG concentration of 7.0 mmol/l. For HbA1c, a large study from Malaysia recommended a threshold value of between 6.6 and 7.0% for diagnosing diabetes.5
Most reports on prevalent and incident retinopathy only study glycaemic factors. Other factors have been shown to be associated with prevalent retinopathy: age, hypertension, hypertensive medications, insulin, BMI, cholesterol, triglycerides, C-peptide, urinary albumin creatinine ratio, inflammation and endothelial dysfunction.5,7,10,12,23 Incident retinopathy was associated with waist-hip ratio in the Hoorn study.24 In the D.E.S.I.R. study, at baseline, only hypertensive treatment was related with retinopathy at 10 years, but for the cumulated effects over the 9 years of the study, evaluated by the area under the curve over this period, there was only a significant association with higher levels of triglycerides. Marginal associations (P < 0.1) were also seen with BMI, waist circumference, insulin, systolic blood pressure, HDL- and LDL-cholesterol and CRP.
There are few longitudinal studies of retinopathy, and they all show the relation with either glucose or HbA1c levels. In the largest single study of incident retinopathy, diagnosed from fundus photographs, the incidence increased from 15 cases per 10 000 person years for FPG below 5.0 mmol/l to around 30 cases for glucose between 5.0 and 7.0 mmol/l and then increased rapidly for three glucose classes within the diabetic range.25 In the D.E.S.I.R. study we were able to show a significant difference in retinopathy frequency at ten years, between FPG < and ≥ 7.0 mmol/l at baseline. In the Pima Indian study,19 five-year incident retinopathy increased at FPG and HbA1 values around 7.0 mmol/l and 7.0%. Incident retinopathy over 9.4 years in the Hoorn Study,24 was more than two fold higher in the diabetic patients than in the normoglycaemic The incidence of retinopathy was more than three-fold higher in the upper third of the population, with HbA1c ≥ 5.8%, than in the remainder of the population. In the D.E.S.I.R. study, the ten-year prevalence of retinopathy was 3.3% for HbA1c < 6.0% and 6.8% for those with a higher HbA1c ≥ 6.0%. In the ARIC study,26 the 3-year incidence of any retinopathy was three times higher above the upper quartile of the FPG distribution at baseline (6.3 mmol/l). The recent publication from Australia,4 showed the five-year incidence of any retinopathy increased at approximately 8.0 mmol/l for FPG. It is difficult to compare actual glucose and HbA1c levels where the frequency of retinopathy increases in these different studies, as there were no doubt differences in the accuracy of these assays both for glucose, but especially for HbA1c. The standardization of the HbA1c assay results should improve this situation for future studies.27
HbA1c and FPG at baseline were both related with the presence of retinopathy ten years later, and the levels where the positive predictive values increase provide a rationale for the choice of thresholds for the definition of hyperglycaemia associated with 10-year retinopathy. We propose that that thresholds of 6.0 mmol/l for FPG and 6.0% for HbA1c could be used to define those who are at risk of retinopathy; this is in agreement with our observation of a risk of retinopathy within the IFG range (FPG > 6.1 mmol/l). Factors other than glucose measures play only a minor role in retinopathy.
Acknowledgments
The D.E.S.I.R. study has been supported by INSERM contracts with CNAMTS, Lilly, Novartis Pharma and Sanofi-Aventis; by INSERM (Réseaux en Santé Publique, Interactions entre les déterminants de la santé, Cohortes Santé TGIR), the Association Diabète Risque Vasculaire, the Fédération Française de Cardiologie, La Fondation de France, ALFEDIAM, ONIVINS, Ardix Medical, Bayer Diagnostics, Becton Dickinson, Cardionics, Merck Santé, Novo Nordisk, Pierre Fabre, Roche, Topcon.
We thank Nathalie Robert for training Astrid Germain the study orthoptist, Marina Grinsztein for coding the retinal photographs and Lilly France for providing financial support for this project.
The D.E.S.I.R. Study Group. INSERM U780: B. Balkau, MA. Charles, P. Ducimetière, E. Eschwège; INSERM U367: F. Alhenc-Gelas; CHU D Angers: Y. Gallois, A. Girault; Bichat Hospital: F. Fumeron, M. Marre; CHU de Rennes: F. Bonnet; CNRS UMR8090, LILLE: P. Froguel; Centres d Examens de Sante: Alençon, Angers, Caen, Chateauroux, Cholet, Le Mans, Tours; Institute de Recherche Médecine Générale: J. Cogneau; General practitioners of the region; Institute inter-Regional pour la Santé: C. Born, E. Caces, M. Cailleau, J.G. Moreau, F. Rakotozafy, J. Tichet, S. Vol.
Footnotes
Duality of interest The other authors declare no duality of interest. Lilly France provided financial support for this study, but they were not involved in the analysis or interpretation of the data.
References
- 1.Expert Committee on the Diagnosis and Classification of Diabetes Mellitus. Report of the Expert Committee on the Diagnosis and Classification of Diabetes Mellitus. Diabetes Care. 1997;20(7):1183–1197. doi: 10.2337/diacare.20.7.1183. [DOI] [PubMed] [Google Scholar]
- 2.International Expert Committee. International Expert Committee report on the role of the A1C assay in the diagnosis of diabetes. Diabetes Care. 2009;32(7):1327–1334. doi: 10.2337/dc09-9033. [DOI] [PMC free article] [PubMed] [Google Scholar]
- 3.Ulm K. A statistical method for assessing a threshold in epidemiological studies. Stat Med. 1991;10(3):341–349. doi: 10.1002/sim.4780100306. [DOI] [PubMed] [Google Scholar]
- 4.Wong TY, Liew G, Tapp RJ, et al. Relation between fasting glucose and retinopathy for diagnosis of diabetes: three population-based cross-sectional studies. Lancet. 2008;371(9614):736–743. doi: 10.1016/S0140-6736(08)60343-8. [DOI] [PMC free article] [PubMed] [Google Scholar]
- 5.Sabanayagam C, Liew G, Tai ES, et al. Relationship between glycated haemoglobin and microvascular complications: Is there a natural cut-off point for the diagnosis of diabetes? Diabetologia. 2009 doi: 10.1007/s00125-009-1360-5. in press. [DOI] [PubMed] [Google Scholar]
- 6.McCartney P, Keen H, Jarrett RJ. The Bedford Survey: observations on retina and lens of subjects with impaired glucose tolerance and in controls with normal glucose tolerance. Diabete Metab. 1983;9(4):303–5. [PubMed] [Google Scholar]
- 7.Klein R, Klein BE, Moss SE, Wang Q. Hypertension and retinopathy, arteriolar narrowing, and arteriovenous nicking in a population. Arch Ophthalmol. 1994;112(1):92–98. doi: 10.1001/archopht.1994.01090130102026. [DOI] [PubMed] [Google Scholar]
- 8.Stolk RP, Vingerling JR, de Jong PT, et al. Retinopathy, glucose, and insulin in an elderly population. The Rotterdam Study. Diabetes. 1995;44(1):11–15. doi: 10.2337/diab.44.1.11. [DOI] [PubMed] [Google Scholar]
- 9.Rajala U, Laakso M, Qiao Q, Keinanen-Kiukaanniemi S. Prevalence of retinopathy in people with diabetes, impaired glucose tolerance, and normal glucose tolerance. Diabetes Care. 1998;21(10):1664–1669. doi: 10.2337/diacare.21.10.1664. [DOI] [PubMed] [Google Scholar]
- 10.Yu T, Mitchell P, Berry G, Li W, Wang JJ. Retinopathy in older persons without diabetes and its relationship to hypertension. Arch Ophthalmol. 1998;116(1):83–89. doi: 10.1001/archopht.116.1.83. [DOI] [PubMed] [Google Scholar]
- 11.Gabir MM, Hanson RL, Dabelea D, et al. Plasma glucose and prediction of microvascular disease and mortality: evaluation of 1997 American Diabetes Association and 1999 World Health Organization criteria for diagnosis of diabetes. Diabetes Care. 2000;23(8):1113–1118. doi: 10.2337/diacare.23.8.1113. [DOI] [PubMed] [Google Scholar]
- 12.van Leiden HA, Dekker JM, Moll AC, et al. Blood pressure, lipids, and obesity are associated with retinopathy: the Hoorn study. Diabetes Care. 2002;25(8):1320–1325. doi: 10.2337/diacare.25.8.1320. [DOI] [PubMed] [Google Scholar]
- 13.Tapp RJ, Shaw JE, Harper CA, et al. AusDiab Study Group. The prevalence of and factors associated with diabetic retinopathy in the Australian population. Diabetes Care. 2003;26(6):1731–1737. doi: 10.2337/diacare.26.6.1731. [DOI] [PubMed] [Google Scholar]
- 14.Diabetes Prevention Program Research Group. The prevalence of retinopathy in impaired glucose tolerance and recent-onset diabetes in the Diabetes Prevention Program. Diabet Med. 2007;24(2):137–144. doi: 10.1111/j.1464-5491.2007.02043.x. [DOI] [PMC free article] [PubMed] [Google Scholar]
- 15.Nelson RG, Wolfe JA, Horton MB, Pettitt DJ, Bennett PH, Knowler WC. Proliferative retinopathy in NIDDM. Incidence and risk factors in Pima Indians. Diabetes. 1989;38(4):435–440. doi: 10.2337/diab.38.4.435. [DOI] [PubMed] [Google Scholar]
- 16.Looker HC, Krakoff J, Knowler WC, Bennett PH, Klein R, Hanson RL. Longitudinal studies of incidence and progression of diabetic retinopathy assessed by retinal photography in Pima Indians. Diabetes Care. 2003;26(2):320–326. doi: 10.2337/diacare.26.2.320. [DOI] [PubMed] [Google Scholar]
- 17.Cikamatana L, Mitchell P, Rochtchina E, Foran S, Wang JJ. Five-year incidence and progression of diabetic retinopathy in a defined older population: the Blue Mountains Eye Study. Eye. 2007;21(4):465–471. doi: 10.1038/sj.eye.6702771. [DOI] [PubMed] [Google Scholar]
- 18.Tapp RJ, Tikellis G, Wong TY, et al. Longitudinal association of glucose metabolism with retinopathy: results from the Australian Diabetes Obesity and Lifestyle (AusDiab) study. Diabetes Care. 2008;31(7):1349–1354. doi: 10.2337/dc07-1707. [DOI] [PMC free article] [PubMed] [Google Scholar]
- 19.McCance DR, Hanson RL, Charles MA, et al. Comparison of tests for glycated haemoglobin and fasting and two hour plasma glucose concentrations as diagnostic methods for diabetes. BMJ. 1994;308(6940):1323–1328. doi: 10.1136/bmj.308.6940.1323. [DOI] [PMC free article] [PubMed] [Google Scholar]
- 20.Balkau B, Eschwege E, Tichet J, Marre M. Proposed criteria for the diagnosis of diabetes: evidence from a French epidemiological study (D.E.S.I.R.) Diabetes Metab. 1997;23(5):428–434. [PubMed] [Google Scholar]
- 21.Aldington SJ, Kohner EM, Meuer S, Klein R, Sjolie AK. Methodology for retinal photography and assessment of diabetic retinopathy: the EURODIAB IDDM complications study. Diabetologia. 1995;38(4):437–444. doi: 10.1007/BF00410281. [DOI] [PubMed] [Google Scholar]
- 22.WHO/IDF Consultation. Definition and diagnosis of diabetes mellitus and intermediate hyperglycaemia. 2006. http://www.who.int/diabetes/publications/Definition%20and%20diagnosis%20of%20diabetes_new.pdf.
- 23.van Hecke MV, Dekker JM, Nijpels G, et al. Inflammation and endothelial dysfunction are associated with retinopathy: the Hoorn Study. Diabetologia. 2005;48(7):1300–1306. doi: 10.1007/s00125-005-1799-y. [DOI] [PubMed] [Google Scholar]
- 24.van Leiden HA, Dekker JM, Moll AC, et al. Risk factors for incident retinopathy in a diabetic and nondiabetic population: the Hoorn study. Arch Ophthalmol. 2003;121(2):245–251. doi: 10.1001/archopht.121.2.245. [DOI] [PubMed] [Google Scholar]
- 25.Ito C, Maeda R, Ishida S, Harada H, Inoue N, Sasaki H. Importance of OGTT for diagnosing diabetes mellitus based on prevalence and incidence of retinopathy. Diabetes Res Clin Pract. 2000;49(2–3):181–186. doi: 10.1016/s0168-8227(00)00156-x. [DOI] [PubMed] [Google Scholar]
- 26.Wong TY, Klein R, Amirul Islam FM, et al. Three-year incidence and cumulative prevalence of retinopathy: the Atherosclerosis Risk in Communities Study. Am J Ophthalmol. 2007;143(6):970–976. doi: 10.1016/j.ajo.2007.02.020. [DOI] [PMC free article] [PubMed] [Google Scholar]
- 27.Consensus Committee. Consensus statement on the worldwide standardization of the hemoglobin A1C measurement: the American Diabetes Association, European Association for the Study of Diabetes, International Federation of Clinical Chemistry and Laboratory Medicine, and the International Diabetes Federation. Diabetes Care. 2007;30(12):2399–2400. doi: 10.2337/dc07-9925. [DOI] [PubMed] [Google Scholar]