

Abstract
To gain insights into the cellular mechanisms of neurogenesis, we analyzed retinal neuroepithelia deficient for Llgl1, a protein implicated in apicobasal cell polarity, asymmetric cell division, cell shape and cell cycle exit. We found that vertebrate retinal neuroepithelia deficient for Llgl1 retained overt apicobasal polarity, but had expanded apical domains. Llgl1 retinal progenitors also had increased Notch activity and reduced rates of neurogenesis. Blocking Notch function by depleting Rbpj restored normal neurogenesis. Experimental expansion of the apical domain, through inhibition of Shroom3, also increased Notch activity and reduced neurogenesis. Significantly, in wild-type retina, neurogenic retinal progenitors had smaller apical domains compared with proliferative neuroepithelia. As nuclear position during interkinetic nuclear migration (IKNM) has been previously linked with cell cycle exit, we analyzed this phenomenon in cells depleted of Llgl1. We found that although IKNM was normal, the relationship between nuclear position and neurogenesis was shifted away from the apical surface, consistent with increased pro-proliferative and/or anti-neurogenic signals associated with the apical domain. These data, in conjunction with other findings, suggest that, in retinal neuroepithelia, the size of the apical domain modulates the strength of polarized signals that influence neurogenesis.
Keywords: Neurogenesis, Notch, Zebrafish, Lethal giant larvae, Shroom3, Interkinetic nuclear migration, Cell polarity
INTRODUCTION
Early in retinal development, neuroepithelial progenitor cells of the optic cup divide in either a symmetric proliferative mode, where both daughter cells remain mitotic, or in a neurogenic mode, where at least one daughter cell exits the cell cycle and differentiates as a neuron. Although the signaling pathways and transcriptional networking involved in retinal neurogenesis are beginning to be understood, less is known about the cell biological mechanisms that regulate this transition. However, analyses of invertebrates and vertebrates have revealed several cellular processes important for regulating neurogenesis. Cellular mechanisms include the asymmetric distribution of fate determinants between daughter cells, such as signaling proteins or transcription factors (Sawa, 2010). More general components, such as centrioles, sub-types of endosomes, proteasomes and apical or basal membranes can also be asymmetrically distributed and affect cell fates (Willardsen and Link, 2011). In addition, cellular activities, such as the length of the cell cycle of the progenitor or the dynamics of the primary cilia, have also been shown to influence the mode of cell division in progenitor cells (Lee and Gleeson, 2010; Salomoni and Calegari, 2010). Although these data support roles for specific cellular components or activities in regulating the symmetry of daughter cell fates, less is known about how progenitor cells are selected to produce post-mitotic neurons initially.
Recent studies, however, have demonstrated an important role for interkinetic nuclear migration (IKNM) and polarized signals in regulating neurogenesis within the retina (Baye and Link, 2008; Latasa et al., 2009). IKNM is the process in which neuroepithelial nuclei oscillate from the apical to basal surface and in phase with the mitotic cycle. In the zebrafish retina, for example, the depth of nuclear migration correlates with the probability that the next cell division will be neurogenic (Baye and Link, 2007). Within the retina, IKNM is facilitated primarily by the activity of actomyosin, but is also influenced by microtubule motors (Del Bene et al., 2008; Norden et al., 2009; Yu et al., 2011). For example, in dynactin1a mutants, the depth of nuclear migration is augmented and the retinal neuroepithelia show a higher proportion of neurogenic divisions. The relationship between nuclear position and neurogenesis depends on apicobasal cell polarity (Baye and Link, 2007), and mutations in a variety of genes essential for apicobasal cell polarity affect neurogenesis (Yamaguchi et al., 2010). The role of IKNM on neurogenesis is important in structures other than zebrafish retina, as experimental manipulations that alter IKNM in mouse cortical neuroepithelia affect cell cycle exit and generation of neurons (Ge et al., 2010; Schenk et al., 2009; Tsai et al., 2005; Xie et al., 2007; Zhang et al., 2009). Furthermore, computational analysis of rat retinal progenitors implicated IKNM, among other parameters, as important for predicting neurogenic and cell-type fate decisions (Cohen et al., 2010). Although the Notch pathway has been proposed as a potential mediator for how patterns of IKNM might influence neurogenesis (Del Bene et al., 2008; Murciano et al., 2002), specific mechanisms have remained unexplored. Insights to the cellular mechanisms that might regulate selection of neurogenic divisions have been gained by the study of factors that are known to regulate the candidate cellular processes introduced above. For example, analysis of Lethal giant larval proteins, primarily in invertebrates, has provided insight into the regulation of cell polarity, actomyosin dynamics and cell cycle exit.
The lethal 2 giant larvae locus [l(2)gl in D. melanogaster] was first identified in Drosophila as homozygous mutations caused neoplastic tumors in larval imaginal discs and later in the maturing brain (Mechler et al., 1985). The l(2)gl gene encodes a conserved protein comprised of WD40 repeats in the N-terminal half and an ‘Lgl-domain’ that makes up the C-terminal half. Studies demonstrated that L(2)gl regulates various aspects of apicobasal cell polarity in numerous tissues (Vasioukhin, 2006; Yamanaka and Ohno, 2008). For example in many epithelia, L(2)gl and the vertebrate homologues Llgl1 and Llgl2, are essential for maintenance of apical cell junctions (Bilder et al., 2000; Hutterer et al., 2004; Yamanaka et al., 2003).
In other cell types, loss of l(2)gl results in distinct apicobasal polarity defects. For example, Drosophila neuroblasts deficient for l(2)gl show defects in targeting protein determinants to subcellular domains and in regulating mitotic spindle orientations (Albertson and Doe, 2003; Peng et al., 2000). Mutant neuroblasts frequently produce two self-renewing progenitors as opposed to wild-type cells that produce one progenitor and one ganglion mother cell, thus resulting in a hyperproliferation phenotype (Lee et al., 2006). In zebrafish lateral line precursor cells, knock down of Llgl1 or Llgl2 function blocks constriction of apical actin belts and subsequent deposition of neuromasts (Hava et al., 2009). In addition, Llgl proteins are required for internalization of apical membrane and proteins during depolarization in MDCK cells (Yamanaka et al., 2006). In penner/llgl2 zebrafish mutants, epidermal cells overproliferate and the formation of basally located hemidesmosomes is prevented. The eye disc cells in Drosophila l(2)gl mutants also show hyper-proliferation, but, owing to residual maternal L(2)gl protein, observable apicobasal polarity is spared (Grzeschik et al., 2007). Finally, in mouse cortical neuroepithelia, targeted gene disruption of Llgl1 results in loss of apical junction maintenance and reduced cell cycle exit (Klezovitch et al., 2004). Excessive proliferation was attributed to failure to asymmetrically segregate Numb, a negative regulator of the Notch pathway. Overall, these studies have shown that Llgl proteins are linked to various aspects of apicobasal cell polarity and can regulate cell cycle exit. In this study, we explore the function of Llgl1 in retinal development and its role in the subcellular organization of neuroepithelial cells, and the influence of Llgl1 on the relationship between IKNM and neurogenesis.
MATERIALS AND METHODS
Zebrafish transgenic lines
The following lines were used: Tg(hsp70:shrm3DN:ires:mCherry)mw21 (this study); Tg(h2afx:proml1b-GFP)mw22 (this study); Tg(h2afx:h2afv-mCherry)mw3 (McMahon et al., 2009); Tg(atoh7:GFP)rw021 (Masai et al., 2003); Tg(h2afv:h2afv-GFP)kca6 (Pauls et al., 2001); Tg(her4:dRed)knu2 (Yeo et al., 2007); Tg(her4:GFP)y83 (Yeo et al., 2007); Tg(tp1-MmHbb:d2GFP)mw43 (this study; based on Parsons et al., 2009).
Morpholinos
The following morpholino oligonucleotides were synthesized by GeneTools (Philomath, OR): llgl1 ATG MO1, 5′-CCGTCTGAACCTAAACTTCATCATC-3′ (Hava et al., 2009); llgl1 UTR MO2, 5′-TGAAGCCGAATCAGAGGTAAATCAC-3′ (Hava et al., 2009); tp53 MO, 5′-GCGCCATTGCTTTGCAAGAATTG-3′ (Robu et al., 2007); rbpj ATG MO, 5′-CAAACTTCCCTGTCACAACAGGCGC-3′ (Ohata et al., 2011); atoh7 ATG MO1, 5′-TTCATGGCTCTTCAAAAAAGTCTCC-3′ (Pittman et al., 2008); and control MO, 5′-CCTCTTACCTCAGTTACAATTTATA-3′.
Antibodies
The following antibodies were used: phospho(ser10)histone3 [rabbit polyclonal, 1:1000, Upstate Biologicals (Lake Placid, NY, USA), Cat#06-570]; β-catenin [mouse monoclonal, 1:500, BD Biosciences (San Jose, CA, USA), Cat#610153]; syntaxin 4 [rabbit polyclonal, 1:400, Chemicon-Millipore (Temecula, CA, USA), Cat#AB5330]; aPKC-ι/ζ C20 (Prkci) [rabbit polyclonal, 1:1000, Santa Cruz Biotechnology (Santa Cruz, CA, USA), Cat#SC-216)]; BrdU [rat monoclonal, 1:1000, Harlan Sera Labs (Leicestershire, UK) Cat#MAS-250]; Ki67 (goat polyclonal, 1:30, Santa Cruz Biotechnology, Cat#SC-7846); phospho(ser19)-myosin regulatory light chain (pMRLC) [rabbit polyclonal, 1:100, Cell Signaling Technology (Danvers, MA, USA), Cat#3671L]; Crb2a/Zs4 antigen [1:20, University of Oregon Monoclonal Antibody Facility (Hsu and Jensen, 2010)]; Llgl1 [rabbit polyclonal, 1:1000 (this study)]; and Llgl1 (frog) [rabbit polyclonal, 1:2000 for western blotting (Dollar et al., 2005)].
BrdU/Ki67 analysis
Assays for cell proliferation and cell cycle exit using BrdU/Ki67 was performed as previously described (Baye and Link, 2007; Klezovitch et al., 2004).
Time lapse imaging
Maximum basal nuclear position and cell cycle period during IKNM was quantified as previously described (Baye and Link, 2007).
Blastulae transplantation
Blastulae transplantation was performed as previously described to generate chimeric embryos (Carmany-Rampey and Moens, 2006).
Heat shock-mediated transgene induction
Heat shock was carried out at the following developmental times and intervals: 22 hpf for 30 minutes; 28 hpf for 30 minutes; 30 hpf for 40 minutes. For each heat-shock, fish were placed in 15 ml polypropylene tubes and were transferred to a waterbath at 37°C. Between heat-shocks, embryos were transferred back to Petri dishes and returned to a 28.5°C incubator. At 32 hpf, embryos were scored for expression of the ires:mCherry transgene and processed as described in the text.
RESULTS
Isolation of zebrafish Llgl1
To begin studies of Llgl1 in zebrafish retinal neurogenesis, we isolated a full-length cDNA. Predicted translation of zebrafish llgl1 showed that it shares high homology to Llgl1 from other vertebrates with significant, but less homology to Llgl2 (Fig. 1A). Nearly exact conservation was found in the region containing the stretch of serine residues that serve as phosphorylation sights for Prkci (Fig. 1A) (Betschinger et al., 2003; Plant et al., 2003). Expression analysis indicated that llgl1 message was abundant in the eyes and developing central nervous system (CNS) during the period of neurogenesis. Message levels were diminished as differentiation progressed (Fig. 1B). In zebrafish, retinal progenitor cells begin to leave the cell cycle at 28 hpf (hours post fertilization) and the central retina is nearly all post-mitotic by 72 hpf (Hu and Easter, 1999). Consistent with mRNA expression, Llgl1 immunoreactivity was found in the proliferative retinal neuroepithelium in a punctate manner along the basolateral plasma membranes (Fig. 1D, left). Expression of fusions between green fluorescent protein and Llgl1 (GFP-Llgl1) showed more uniform basolateral membrane localization (Fig. 1D, right). Basolateral membrane location is typical for most cells that express Llgl proteins, including neuroepithelia (Afonso and Henrique, 2006). We did not detect Llgl1 immunoreactivity or GFP-Llgl1 in apical crescents of dividing cells or in nuclei, as has been shown for Drosophila neuroblasts and oocyte follicular epithelia, respectively (Albertson and Doe, 2003; Dollar et al., 2005).
Fig. 1.

Loss of Llgl1 disrupts retinal development. (A) Phylogenetic comparison of Llgl proteins showing percentage identity (left, top) and cladogram when compared with zebrafish Llgl1 (right, top). Sequence comparison (bottom) showing conservation of serines known to be phosphorylated. (B) In situ hybridization of llgl1 mRNA in zebrafish embryos at 24, 48 and 72 hours post-fertilization (hpf). (C) Side views of morphant embryos at 36 hpf: 8 ng control+ 8ng tp53 morpholino (MO) (top); 8 ng llgl1 ATG MO (middle); 8 ng tp53 + 8ng llgl1 ATG MO (bottom). (D) Localization of Llgl1 immunoreactivity (red puncta) in 32 hpf retina of H2A-GFP (green nuclei) transgenic embryos (left) or those injected with 8 ng tp53 + 8ng llgl1 ATG MO (middle). Localization of fluorescence in 32 hpf retina of wild-type embryos injected with 100 pg GFP-Llgl1 mRNA (right). (E) Sagittal images of eyes in living embryos stained with Acridine Orange (AO) (green puncta, arrows) to label dying cells: 8 ng control+ 8ng tp53 morpholino (MO) (left); 8 ng llgl1 ATG MO (middle); 8 ng tp53 + 8ng llgl1 ATG MO (right). Average number of Acridine Orange-positive cells per eye±s.e.m. (50 μm confocal optic section) (bottom). For each condition, n=10 eyes from 10 embryos were quantified. *P<0.001 (Student’s t-test). (F) Retinal histology of eyes from 80 hpf zebrafish embryos: 8 ng control+ 8ng tp53 morpholino (MO) (left); 8 ng llgl1 ATG MO (middle); 8 ng tp53 + 8ng llgl1 ATG MO (right). (G) Retinal histology of eyes from E15.5 day mice: wild type (left panels) and Llgl1 homozygous mutant (right panels). Note the rosettes in the retinal pigment epithelium (arrow) and neural retina (arrowhead). Scale bars: 250 μm in C; 20 μm in D; 100 μm in E-G.
Knock down of Llgl1 results in eye defects
We next used antisense oligonucleotides (morpholinos, MOs) to knock down Llgl1 in zebrafish embryos. Injection of llgl1 MOs resulted in embryos with smaller eyes, reduced brain size and moderate heart defects (supplementary material Fig. S1). Although these phenotypes are shared with mutants for other polarity genes (prkci/has, mpp5a/nok, epb41l5/moe), the majority of llgl1 morphants did not show significant body curvature or ocular hypopigmentation, which are hallmarks of polarity mutants (Cui et al., 2007; Horne-Badovinac et al., 2001; Jensen and Westerfield, 2004; Wei and Malicki, 2002). To address whether the small eyes and brains of llgl1 morphants may be caused by cell death, we co-injected morpholinos against tp53, which has been shown to abrogate apoptosis (Robu et al., 2007). Knockdown of llgl1 with tp53 MOs or in a tp53 mutant background (Berghmans et al., 2005) partially rescued eye and brain size (Fig. 1C). Quantitatively, the number of acridine orange-positive cells in llgl1 morphant retinas was reduced when tp53 was also deleted (Fig. 1E). In addition to cDNA rescue controls for these llgl1 MOs, we assessed Llgl1 immunoreactivity in morphant eyes and found a reduction, but not total absence, of retinal Llgl1 (Fig. 1D; supplementary material Fig. S2). Similarly, western blot analysis showed significant, but incomplete, depletion of Llgl1 in morphants (Hava et al., 2009) (supplementary material Fig. S2). Together, these data are consistent with perdurance of maternal Llgl1 protein, which is resistant to MOs that target mRNAs. A large supply of Lgl maternal protein has also been shown for Drosophila (Grzeschik et al., 2007). The tp53-mediated cell death caused by llgl1 MOs might be due to either off-target effects and/or a specific role of Llgl1 in neuronal survival. We favor a specific role in neuronal survival, however, based on the similarities between the llgl1 MO and mouse Llgl1 knock-out phenotypes as described below (Fig. 1F,G). As our goal was to investigate loss of Llgl1 function to gain insights into the cell biological regulation of neurogenesis, all subsequent analyses using llgl1 MOs was carried out with tp53 co-depletion so that neurogenesis could be studied without the complications of increased cell death. Histological analysis of llgl1 morphants revealed a delay in retinal lamination and local disorganization (Fig. 1F; supplementary material Fig. S1). To confirm the specificity of these phenotypes and address vertebrate conservation, we analyzed eyes of the Llgl1 knockout mice (Klezovitch et al., 2004). Like zebrafish llgl1 morphants, the retina of Llgl1 knockout mice showed delayed lamination and cellular rosettes (Fig. 1G).
Loss of Llgl1 reduces cell cycle exit of retinal progenitor cells
The morphological features in retinas depleted of Llgl1 are consistent with a hyperproliferation defect in the neuroepithelial progenitors. To address this possibility, we conducted phospho-histoneH3 (PH3) immunostaining on control and llgl1 MO-injected embryos (Fig. 2A,B). PH3 immunoreactivity labels cells in late G2/M-phase and therefore marks a subset of the proliferating cells. Analysis showed a trend towards increased cell proliferation with loss of Llgl1 (Fig. 2C). By labeling cells with Histone2B-GFP and monitoring nuclear dynamics from mitosis to mitosis, we did not measure a significant difference in the cell cycle period of control versus llgl1 morphant cells (Fig. 2D). Both assays showed cell divisions were confined to their normal location at the apical surface. Because PH3 immunoreactivity labels only a small proportion of the total proliferative cells, we next performed BrdU experiments to better quantify potential defects in cell cycle exit. BrdU labeling from either 34-46 hpf or from 48-60 hpf, revealed llgl1 morphants had significantly higher proportions of proliferative cells (Fig. 2E-G). We performed a similar assay to calculate the proportion of cells that exited mitosis from E14.5 to E15.5 in wild-type and Llgl1–/– mice. Using BrdU, in combination with Ki67 immunoreactivity, which marks proliferative cells throughout the cell cycle, we found that the proportion of cells exiting the cell cycle was significantly reduced in Llgl1–/– retinal neuroepithelia. Overall, these data indicate that loss of Llgl1 in retinal neuroepithelia biases progenitors to re-enter the cell cycle, without altering the cell cycle period.
Fig. 2.

Loss of Llgl1 disrupts cell cycle exit in retinal progenitor cells. (A,B) Phosphohistone3 (PH3) immunoreactivity in zebrafish eyes of 36 hpf (A) wild-type and (B) llgl1 MO (8 ng) embryos. (C) Comparison of the number of PH3-positive mitotic cells between control (black bar) and llgl1 morphant (gray bar) zebrafish embryos (n=12 eyes analyzed for each condition). (D) Comparison of the cell cycle period between control (black bar) and llgl1 morphant (gray bar) zebrafish embryos (n=25 cells each from four control MO or five llgl1 MO embryos). (E,F) Retinal sections from 60 hpf wild-type (E) or llgl1 morphant (F) zebrafish showing BrdU labeling starting at 48 hpf. (G) Comparison of the proportion of BrdU-negative (post-mitotic cells) per section between control (black bars) and llgl1 morphant (gray bars) zebrafish embryos (n=10 retina analyzed for each condition). BrdU was injected from 34-46 hpf (left) or from 48-60 hpf (right). (H) BrdU labeling [red (E14.5-E15.5)] and Ki67 (green) immunoreactivity with colocalization (yellow) and high-magnification inset for wild-type and Llgl1 homozygous mutant mice. (I) Comparison between wild-type (black bar) and Llgl1 homozygous mutant mice (gray bar) for the percentage of retinal cells that had exited the cell cycle between E14.5 and E15.5 (proportion of BrdU-positive; Ki67-negative of the total number of BrdU-positive cells). For each genotype, six eyes from three embryos were quantified. For C,D,G,I, error bars represent s.e.m.; P, Student’s t-test; NS, not significant. Scale bars: 100 μm in A,B,H; 50 μm in E,F.
Apicobasal polarity is intact in retinal neuroepithelia following loss of Llgl1
Because apical junctions in many cell types are disrupted following depletion of Llgl proteins, we investigated these structures in zebrafish llgl1 morphant and mouse Llgl1–/– mutant retinal neuroepithelia. Apicobasal markers in retinal neuroepithelia were correctly positioned in both zebrafish and mice depleted of Llgl1 (Fig. 3A-H; data not shown). Markers included Prkci, which depends on Llgl1 function for apical localization in other cell types, as well as Stx4a, which has been shown to directly interact with Llgl2 (Musch et al., 2002; Rolls et al., 2003; Yamanaka et al., 2003). Inspection of the apical junction markers, however, indicated that the spacing between junctions was expanded following loss of Llg1. We confirmed these observations using transmission electron microscopy (Fig. 3I,J; supplementary material Fig. S3). In both control and llgl1 morphants, polarized features of the neuroepithelial cells were maintained, including the apical localization of adherens junctions, Golgi apparatus and centrosomes. Although electron-dense adherens junctions were localized apically in llgl1 morphants, the junctions did appear enlarged and more diffuse (Fig. 3J; supplementary material Fig. S3). Although primary cilia were difficult to find in retinal neuroepithelia in general when compared with those in the forebrain, both control and llgl1 morphants displayed these apical structures (data not shown). Also consistent with light microscopy, inspection of electron micrographs suggested expansion of the apical domain in llgl1 morphants. Quantification of the cellular area above adherens junctions indicated that llgl1 morphant cells indeed had enlarged apical domains (Fig. 3K).
Fig. 3.

Apicobasal polarity is maintained in Llgl1-deficient retinal neuroepithelia. (A-C,E-G) Immunostaining for apical junction markers in 36 hpf zebrafish retina: (A,E) rhodamine-phalloidin; (B,F) β-catenin; (C,G) Prkci. For the apical markers, zebrafish were injected with either 8 ng control+ 8ng tp53 MO (A-C) or 8 ng tp53 + 8ng llgl1 ATG MO (E-G). (D,H) Immunostaining for the basal marker syntaxin 4 in wild-type (D) or Lgl1 mutant (H) E15.5 mouse retina. Note the basal staining in a rosette in H (arrowhead). (I,J) Transmission electron micrographs of zebrafish retinal neuroepithelial cells injected with either 8 ng control+ 8ng tp53 MO (I) or 8 ng tp53 + 8ng llgl1 ATG MO (J). The apical membrane above the electron-dense adherens junctions is highlighted (red outline). Individual cells are pseudo-colored green for contrast. (K) Comparison of the average length of apical membrane between control (black bar) and llgl1 morphant (gray bar) cells. Scale bars: 25 μm in A-H; 500 nm in I,J.
Phosphorylated (active) non-muscle myosin II can mediate apical domain constriction and has been shown to physically interact with Llgl proteins (Sawyer et al., 2009; Strand et al., 1995). We therefore assessed localization of the phosphorylated regulatory subunit of myosin II (pMRLC). In control retinal neuroepithelia, pMRLC localized to the apical region and to perinuclear puncta, which have been previously shown to be associated with cells undergoing rapid interkinetic nuclear migration (Norden et al., 2009; Leung et al., 2011). In llgl1 morphant retinas, perinuclear pMRLC-staining was not changed, but there was a reduction in immunoreactivity at the apical domain, as assessed by colocalization with the apical domain marker Crumbs2a (Crb2a – Zebrafish Information Network) (supplementary material Fig. S4).
Cell-autonomous expansion of the apical domain in llgl1 morphants
The apical domain of llgl1 morphants might have been affected by changes in cell shape, owing to altered cell density. To address this possibility and investigate the cell autonomy of llgl1 morphant phenotypes, we generated genetic mosaics through blastulae transplantation (Carmany-Rampey and Moens, 2006). Donor cells were injected at the one-cell stage with the lineage-tracing probe, Alexa488-dextran and either llgl1+tp53 MO or control+tp53 MO (Fig. 4A). Donor blastulae cells were then transferred to unlabeled wild-type host cells. At 34 hpf, chimeric embryos were fixed and stained with rhodamine-phalloidin to mark actin belts associated with apical junctions and define the apical surfaces of retinal neuroepithelial cells (Fig. 4B). Quantification of the apical area of control versus llgl1 morphant cells revealed that the apical domain was expanded with the loss of Llgl1 (Fig. 4C). Neither the total surface area nor the height of llgl1 morphant cells were, however, significantly different from control cells (Fig. 4D; supplementary material Fig. S5). Together, these data indicate that apical domain expansion in retinal neuroepithelia is a cell-autonomous feature of Llgl1 depletion.
Fig. 4.
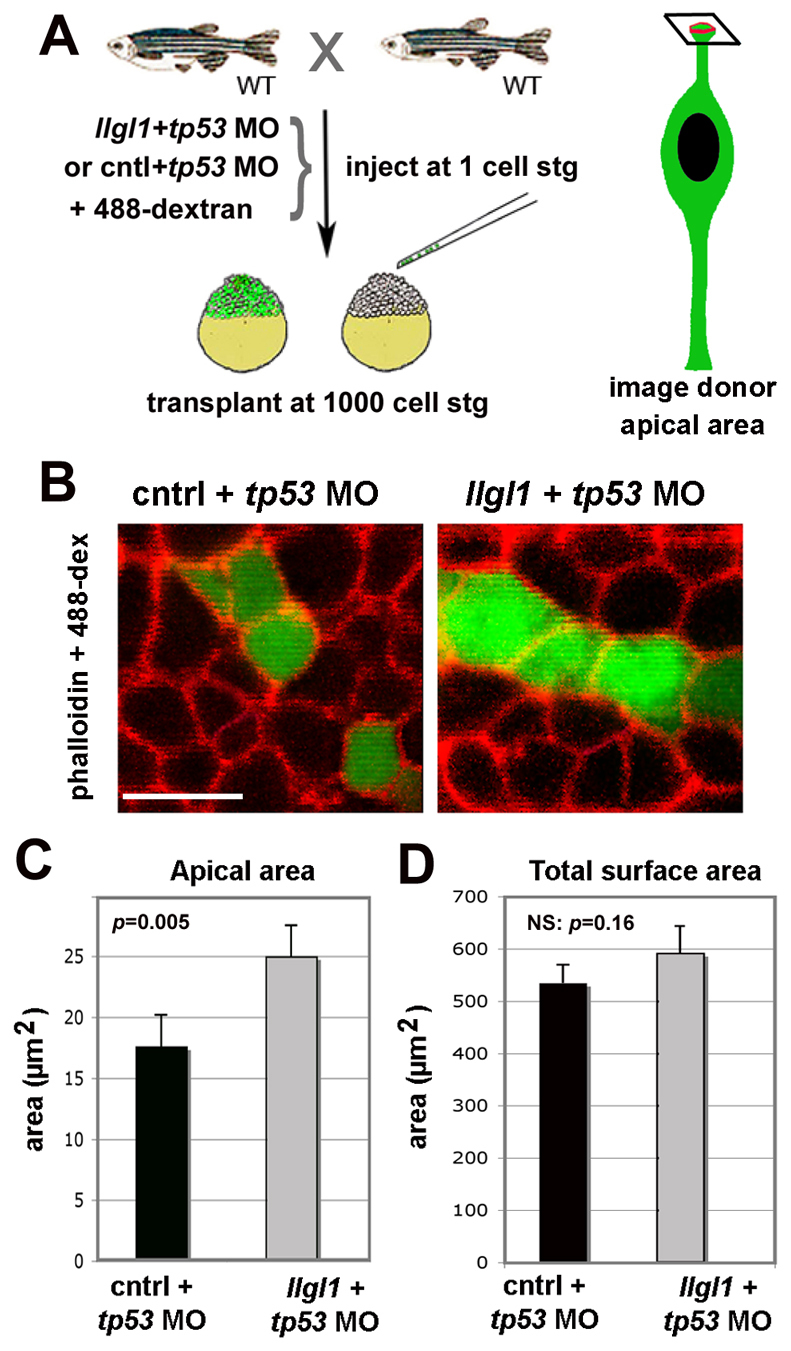
Apical domain expansion in Llgl1-deficient retinal neuroepithelia. (A) Schematic showing the experimental design for evaluating apical domain of morphant retinal neuroepithelia in wild-type host eyes. (B) Confocal image of the apical surface area of retinal neuroepithelial endfeet. Donor cells (green) were derived from embryos injected from either 8 ng control+ 8ng tp53 MO (left) or 8 ng tp53 + 8ng llgl1 ATG MO (right). Chimeric embryos were fixed at 34 hpf and stained for rhodamine-phalloidin (red). (C) Comparison of the apical surface area between control (black bars) and llgl1 morphant (gray bars) cells (n=22 cells each from six control MO or 5 llgl1 MO chimeras). (D) Comparison of the total surface area between control (black bars) and llgl1 morphant (gray bars) cells (n=25 cells each from three control MO or three llgl1 MO retinas). For D and E, error bars represent s.e.m.; P, Student’s t-test; NS, not significant. Scale bar: 10 μm in B.
Retinal neurogenesis is attenuated in llgl1 morphants
We next used a similar genetic mosaic assay to investigate the consequences of depleting Llgl1 on retinal neurogenesis. Donor cells were derived by mating carriers of the Tg(h2afx:h2afv-mCherry)mw3 and Tg(atoh7:GFP)rw021 transgenes, which mark all progenitor nuclei in red fluorescence and neurogenic progenitors with cytoplasmic green fluorescence (Masai et al., 2003; McMahon et al., 2009). Expression of the atoh7:GFP transgene (previously called ath5:GFP) initiates during the last cell cycle preceding a neurogenic division and is maintained in a subset of post-mitotic retinal neurons (Poggi et al., 2005). Donor clusters were tracked at 26 hpf with the onset of atoh7 expression, at 36 hpf midway though atoh7-dependent neurogenesis, and at 60 hpf when atoh7 neurogenesis was complete. Initiation of neurogenesis occurred normally in llgl1 morphant cells. However, by 36 hpf, control cell clusters had on average 57% atoh7:GFP-positive cells, whereas llgl1 morphant cell clusters showed 32% atoh7:GFP-positive cells. The defect in neurogenesis was maintained through 60 hpf (Fig. 5C). The expansion of apical domain and concomitant reduction in cell cycle exit and neurogenesis raised the issue of whether, in wild-type retina, the apical domain is smaller in neurogenic progenitors when compared with proliferative progenitors. To address this issue, we analyzed the apical area of atoh7:GFP-positive neurogenic cells versus non-GFP cells during the initiation of retinal neurogenesis in wild-type transgenic embryos (Fig. 5D-G; supplementary material Movie 1). This was accomplished by monitoring the apical domain in live atoh7:GFP transgenic embryos. The apical domain was marked by RFP-UtrCH, which localizes to apical junctions based on the F-actin binding domain of Utrophin (Burkel et al., 2007). Like that described for the mammalian cortex (Kosodo et al., 2004), neurogenic progenitors in zebrafish retina showed smaller apical domains (Fig. 5H). With this analysis, we also found that while the apical domain area varied between cells, for individual progenitors there were minimal changes throughout the cell cycle, until just before entry into M phase when the cell rounded (supplementary material Movies 2, 3).
Fig. 5.

Neurogenesis is reduced in Llgl1-deficient retinal neuroepithelia. (A) Experimental design for evaluating neurogenesis in morphant retinal cells in wild-type host eyes. (B) Confocal images of donor cells showing atoh7:GFP (green, left panels), H2A-mCherry (red, middle panels) and combined images (right panels) at 36 hpf. Donor cells were derived from embryos injected with either 8 ng control+ 8ng tp53 MO (top) or 8 ng tp53 + 8ng llgl1 ATG MO (bottom). (C) Comparison of the proportion of atoh7:GFP-positive cells in control or llgl1 morphant clusters (n>10 clusters from 10 chimeras for each condition) tracked at 26, 36 and 60 hpf. Cluster Growth Quotient indicates the fold expansion of the cluster cell number [(60 hpf cell number–26 hpf cell number)/26 hpf cell number]. (D) Image plane used to measure apical area. (E) Confocal images of retinal neuroepithelial apical domains prior to atoh7:GFP expression (segmented areas, left) and just after GFP became detectable (right). Apical junctions are labeled by injection of RFP-UtrCH mRNA (red) (F) Comparison of the apical area of cells prior to atoh7:GFP (green bars, n=21 cells) expression and cells that did not go on to express GFP (black bars, n=35 cells). Error bars represent s.e.m.; P, Student’s t-test.
To investigate whether Atoh7 function itself modulated apical domain size, we analyzed this feature in embryos where Atoh7 translation was blocked. As previously observed, atoh7 morpholinos efficiently inhibited retinal ganglion cell genesis up to 72 hpf (Pittman et al., 2008). However, at earlier developmental times, loss of Atoh7 did not affect the size of the apical domain (supplementary material Fig. S6).
Experimental expansion of apical domain reduced neurogenesis
These results suggest that the size of the apical domain in retinal neuroepithelial cells might influence neurogenic decisions, and is not simply a consequence of a neurogenic fate. To explore this possibility further, experiments were conducted to expand the apical domain of retinal neuroepithelia, without manipulating Llgl1, which potentially regulates apical domain size and neurogenesis through independent mechanisms. Previous work has demonstrated that disruption of Shroom3 protein activity results in expansion of apical area without affecting overall apicobasal cell polarity (Haigo et al., 2003; Hildebrand, 2005; Lee et al., 2007). We generated a transgenic line that expresses a dominant-negative version of zebrafish Shroom3 (Shrm3DN). In this line, Shrm3DN is expressed by the inducible heat-shock 70 promoter (hsp70) and the cells are marked by mCherry fluorescent protein (Fig. 6A). We also generated a transgenic line in which GFP is fused with Prominin1b (Prom1b-GFP), a cholesterol-interacting pentaspan membrane protein that is enriched at the apical region of polarized cells, including retinal neuroepithelia (Fig. 6B) (Corbeil et al., 2010). Embryos produced by crossing fish from these two lines were heat shocked to induce Shrm3DN protein and the localization of Prom1b-GFP was then evaluated. Similar to frog neural plate cells expressing a comparable Shrm3DN protein (Lee et al., 2007), retinal neuroepithelial cells appeared shortened and the apical domain was expanded. Overall apicobasal polarity, however, was maintained (Fig. 6B). To evaluate better the apical domain in Shrm3DN-expressing neuroepithelia, transmission electron microscopy was employed. Cells expressing Shrm3DN showed enlarged apical domains, in which membrane often bulged above the adherens junctions (Fig. 6D; supplementary material Fig. S3). As in Llgl depleted cells, the adherens junctions themselves of Shrm3DN cells were also larger. Consistent with marker studies, apical features of these neuroepithelial cells were preserved at the ultrastructural level, including location of the adherens junctions, centrosomes and the Golgi (Fig. 6C,D; supplementary material Fig. S3). Expansion of the apical domain in Shrm3DN-expressing cells was quantified and confirmed as cell-autonomous in a genetic mosaic assay (Fig. 6E,F). Interestingly, in mosaics, donor cell height was not altered by Shroom3 inhibition (supplementary material Fig. S7). When the mosaic assay was conducted using shrm3DN;atoh7:GFP transgenic cells as donors, we found that similar to llgl1 morphants, neurogenesis was reduced (Fig. 6G-I). Experimental reduction of apical domain size was attempted by expressing full-length Shroom3. However, transient activation at the start of retinogenesis resulted in a strong delamination phenotype of neuroepithelia, precluding a meaningful analysis of neurogenesis. As neither Shroom3 nor Llgl1 proteins are thought to regulate directly the transcriptional aspects of neurogenesis, these observations suggest that the size of apical membrane influences this cell fate. We addressed this possibility by analyzing whether neurogenic signals, which are associated with the apical domain, were affected in either llgl1 morphant or Shrm3DN transgenic fish.
Fig. 6.

Inhibiting Shroom3 expanded the apical domain and reduced neurogenesis in retinal neuroepithelia. (A) Schematic showing modular organization of wild-type vertebrate Shroom3 and the dominant-negative (Shrm3DN) version. (B) Localization of prom1b-GFP in non-transgenic and Shrm3DN transgenic retina following heat shock (HS). (C,D) Transmission electron micrographs of 32 hpf retinal neuroepithelial cells from (C) non-transgenic and (D) Shrm3DN transgenic retina following heat shock. The apical membrane above the electron-dense adherens junctions is highlighted (red outline). Individual cells are pseudo-colored green for contrast. (E) Confocal image (left panel) of the apical retinal surface of 32 hpf prom1b-GFP (green) transgenic embryos injected with shrm3DN:ires:mCherry plasmid (red). Segmentation of the confocal image, used for quantification, is shown in the right panel. (F) Comparison of the apical area between Shrm3DN-positive cells (gray bars, n=20 cells, three embryos) and mCherry-negative cells (black bars, n=20 cells, three embryos). (G) Schematic showing the experimental design for evaluating neurogenesis in Shroom3DN-expressing cells in wild-type host eyes. (H) Comparison of the proportion of atoh7:GFP-positive cells in mCherry-positive clusters with either hsp70:mCherry-(black bars) or hsp70:shrm3DN:ires:mCherry (gray bars)-injected plasmid (for each condition, n=10 clusters, 10 embryos). (I) Examples of clusters expressing either hsp70:mCherry (red, right) or hsp70:shrm3DN:ires:mCherry (red, left) in a atoh7:GFP background (green cells) following heat shock (HS). For F and H, error bars represent s.e.m.; P, Student’s t-test. Scale bars: 500 nm in C,D.
Notch activity is increased with expansion of the apical domain and is required for reduced neurogenesis
Previous studies have shown that, in retinal neuroepithelia, cells with apical nuclei show increased expression of Notch target genes (Cisneros et al., 2008; Del Bene et al., 2008; Murciano et al., 2002). This suggests that the apical region of neuroepithelia is enriched for Notch activity, potentially through a variety of mechanisms. For example, in Drosophila, Notch receptor proteins are specifically associated with the apical domain of neuroepithelia (Genevet et al., 2009; Maitra et al., 2006; Vaccari and Bilder, 2005). However, localizing endogenous full-length Notch proteins has been elusive for vertebrates. To investigate whether expansion of the apical domain in retinal neuroepithelia altered Notch activity, we analyzed expression of the her4:dRed or tp1:d2GFP transgenes following disruption of either Llgl1 or Shroom3. Her4 is a direct target of Notch activity and the transgenic line functions as a sensitive reporter for Notch activity in the nervous system (Yeo et al., 2007). The tp1 promoter consists of 12 Rpbj-binding sites and reports Notch activity throughout the embryo (Parsons et al., 2009). We found that transiently overexpressing Shrm3DN protein, using an hsp70:Shrm3DN:ires:GFP construct, resulted in acute autonomous elevations of Notch activity (Fig. 7A-F). Confocal images indicated that the increased Notch activity remained enriched at the apical region of the neuroepithelium, although the polarized levels of expression was less obvious than control transgenic or non-transgenic cells. Pixel intensity measurements showed a 2.5-fold increase in both reporters following inhibition of Shroom3 (Fig. 7C,F). Similarly, knockdown of llgl1 resulted in upregulation of multiple Notch target genes and downregulation of neurogenic genes, as judged by real-time quantitative RT-PCR (supplementary material Fig. S8).
Fig. 7.

Augmented Notch signaling is required for reduced neurogenesis with loss of Llgl1. (A,B) Retinal expression of her4:dRed in 36 hpf embryos injected with plasmid DNA for hsp70:Shrm3DN:ires:GFP (A) or hsp70:GFP (B). (C) Pixel intensity measurements comparing her4:dRed expression in hsp70:Shrm3DN:ires:GFP-positive (n=58) and -negative (n=162) or hsp70:GFP-positive (n=72) or -negative (n=138) cells. (D,E) Retinal expression of tp1:d2GFP in 36 hpf embryos injected with plasmid DNA for (D) hsp70:Shrm3DN:ires:mCherry or (E) hsp70:mCherry. (F) Pixel intensity measurements comparing tp1:d2GFP expression in hsp70:Shrm3DN:ires:GFP-positive (n=73) and -negative (n=73) or hsp70:GFP-positive (n=66) or -negative (n=70) cells. Error bars in C and F represent s.e.m.; n equals total number of cells quantified from more than three embryos for each condition; P, Student’s t-test. (G) Percentage of cells within an atoh7:GFP-donor cluster that express GFP at 36 hpf. The morpholino condition is listed under each bar: 8 ng tp53 MO; 8 ng tp53 + 8ng llgl1 ATG MO; 8 ng tp53 + 8ng llgl1 ATG MO + 4 ng rbpj MO; 8 ng tp53 + 4 ng rbpj MO. For each condition, n=12 clusters were scored from 12 chimeras. P, one-way ANOVA following Tukey’s post-hoc test; ns, not significant. (H) Maximum basal nuclear position during interkinetic nuclear migration in retinal donor cells that expressed atoh7:GFP (green) or remained GFP negative (red) from donor embryos injected with either 8 ng control + 8ng tp53 MO (left) or 8 ng tp53 + 8ng llgl1 ATG MO (right). Maximum nuclear position is significantly different for neurogenic progenitors in control versus llgl1 morphants; P, Wilcoxon Rank Sum Test. (I) Schematic model showing neuroepithelial cells undergoing nuclear migration. Wild-type cells with basal nuclei become neurogenic progenitors. In Llgl1-deficient cells, the apical domain (red) is expanded and the apical-associated signals (blue gradient) are increased, causing cells with basal nuclei to divide as proliferative progenitors. (J) Schematic model showing neuroepithelial cells undergoing cytokinesis. Divisions that differentially partition the apical membrane drive asymmetric fates, whereas divisions that equally segregate the apical domain result in symmetric fates. Cells with larger apical domains, such as with Llgl1 deletion, may tend to partition this domain equally.
To test whether increased Notch activity was essential for the reduced neurogenesis following Llg1 depletion, Rbpj morpholinos were employed (Ohata et al., 2011). In the atoh7:GFP genetic mosaic assay, knockdown of Llgl1 again showed reduced neurogenesis. However, co-depletion of Llgl1 and Rbpj resulted in control proportions of atoh7:GFP-positive cells in donor clusters (Fig. 7G). Potentially, Notch activity itself may have caused the expansion of the apical domain following loss of Llgl1. To test this, we expressed a constitutive active Notch1 protein (GFP-Notch1ΔE) in retinal neuroepithelia. This mutant version of Notch1 lacks part of the extracellular domain and is constitutively susceptible to γ-secretase activity and shows strong gain of Notch activity (Coffman et al., 1993). In GFP-Notch1ΔE-expressing cells, neurogenesis was reduced, but the apical domain was not expanded (supplementary material Fig. S9). Interestingly, the Notch fusion protein showed preferential localization within the apical region. Together, these data indicate that elevated Notch activity is a consequence, and not a cause, of an expanded apical domain and nuclear Notch signaling is required for the neurogenic defects with loss of Llgl1.
In a final set of experiments, we analyzed whether loss of Llgl1, and the concomitant expansion of the apical domain and Notch activity, affected the relationship of nuclear position and neurogenesis. During interkinetic nuclear migration in the zebrafish retina, cells with nuclei that migrate to more basal positions are biased to produce neurons in the next division (Baye and Link, 2007). Measuring the maximum basal nuclear position within control or llgl1 morphant cells of atoh7:GFP transgenic embryos showed that a polarized relationship between nuclear position and neurogenesis was maintained following loss of Llgl1 (Fig. 7H). Furthermore, the overall range of maximum nuclear positions was not significantly altered, indicating that interkinetic nuclear migration itself was not affected. However, cells that normally would have divided neurogenically based on their maximum nuclear position, remained proliferative following loss of Llgl1 (Fig. 7D). These data suggest that Llgl1 disruption affects retinal neurogenesis initially not by altering overall apicobasal cell polarity, but instead by increasing the apical domain and neurogenic signals, such as Notch, that are associated with this region (Fig. 7I,J).
DISCUSSION
In this study, we explored the loss-of-function phenotypes of Llgl1 in zebrafish and mouse retinal neuroepithelia to gain insight into the cellular mechanisms that influence neurogenesis. In these cells, we found that reduction of Llgl1 resulted in expansion of the apical domain and enlargement of the apical junctions, but did not disrupt overall apicobasal polarity. The lack of overt depolarization could potentially be due to inefficient knockdown of Llgl1, presence of maternal protein or compensation by Llgl2. Indeed, mutations in zebrafish llgl2 also do not show classic polarity phenotypes, which have been attributed to maternal protein and/or compensation by Llgl1. Instead, llgl2 (penner) mutants show disruption to apicobasal features, including expanded apical surface and loss of basal hemidesmosomes, as well hyperproliferation of epidermis (Reischauer et al., 2009; Sonawane et al., 2005; Sonawane et al., 2009). With regard to Llgl1 morphants and mutants, despite overtly normal polarity, neurogenesis was affected and retinal progenitor cells re-entered the cell cycle in higher proportions than wild-type cells. Our additional experiments and previous reports suggest that the size of the apical domain and associated junctions influences neurogenesis. First, in wild-type cells, neurogenic progenitors had smaller apical domains – an observation previously made for mammalian cortical progenitor cells (Kosodo et al., 2004). Second, transient expansion of the apical domain by inhibition of Shroom3 activity also inhibited neurogenesis in retinal neuroepithelia. Mechanistically, either loss of Llgl1 or inhibition of Shroom3 in these cells increased Notch activity, which is known to maintain the progenitor state and can block neurogenesis. Indeed, Notch activity was found to be essential for the altered neurogenesis with loss of Llgl1. Interestingly, Llgl1 morphants showed normal interkinetic nuclear migration. However, Llgl1-deficient progenitors that had nuclei move deep towards the basal side often remained proliferative. This contrasts with wild-type cells with similar maximum basal nuclear positions, which nearly always became neurogenic. Overall, these data suggest that in retinal progenitors, pro-proliferative and/or anti-neurogenic signals are associated with the apical membrane and junctions, and the size of this region modulates signaling activity. The strength of apically localized activities in part regulates the selection of neurogenic progenitors based on proximity of the nucleus to the apical region and/or the inheritance of this domain between daughter cells (Fig. 7I,J).
The shift in the relationship between nuclear position and neurogenesis following loss of Llgl1 implies that apical domain-associated signals act acutely and in collaboration with nuclear position to modulate neurogenesis. In other words, the fate decision to produce a post-mitotic daughter is determined rapidly in the progenitor cell itself. However, our data do not exclude a role for apical domain inheritance and associated signals/determinants in also modulating cell fate decisions within the daughter cells. For example, apical domain distribution may determine whether neurogenic divisions produce one neuron and a progenitor cell or two neurons. Alternatively, apical domain partitioning may also regulate the specific cell type fate of daughter cells. In invertebrates, asymmetric partitioning of regulator factors is a well-established mechanism for cell fate determination (Sawa, 2010). Studies with vertebrates also indicate that unequal distribution of apically localized proteins correlate with asymmetric cell fates (Alexandre et al., 2010; Bultje et al., 2009; Cayouette et al., 2001; Kosodo et al., 2004; Marthiens and ffrench-Constant, 2009; Zigman et al., 2005). For example, in the developing zebrafish neural tube, time-lapse imaging demonstrated that unilateral segregation of the apical domain to one daughter cell, as judged by Par3-GFP, correlated with asymmetric cell divisions, in which the cell that inherited the apical domain was biased to differentiate as the neuron (Alexandre et al., 2010).
Our results raise the question how does the apical domain regulate Notch activity? Possibilities for direct and indirect mechanisms exist. For example β-catenin (Ctnnb1) is a well-characterized core component of apical junctions and known to regulate adhesion between neuroepithelia. It is also the key effector of canonical Wnt signaling. In zebrafish and frog retinal neuroepithelia, activation of the canonical Wnt signaling pathway drives progenitor cell proliferation and, through Notch, blocks neural differentiation (Agathocleous et al., 2009; Van Raay et al., 2005; Yamaguchi et al., 2005). Another key component associated with apical junctions is Par3. In the developing mouse cortex, Par3 levels were found to positively regulate Notch activity and overexpression of Par3 promoted symmetric proliferative divisions (Bultje et al., 2009). The apical protein Crumbs negatively regulates Notch activity in neuroepithelia (Ohata et al., 2011). Potentially, expansion of the apical domain either recruits activators of Notch signaling or dilutes the effective concentration of inhibitors.
In Drosophila, components of the Salvador-Warts-Hippo (SWH) signaling pathway are also associated with the apical domain and promote cell proliferation. In fact, recent studies showed that inhibition of the SWH pathway results in expansion of the apical domain and accumulation of signaling molecules at the apical cell surface, including Notch (Genevet et al., 2009; Hamaratoglu et al., 2009; Maitra et al., 2006; Yu et al., 2008). However, Notch activity in SWH pathway mutants was not upregulated, owing to the effects of the SWH pathway mutations on endocytosis and intracellular trafficking, which is required for Notch activation (Fortini and Bilder, 2009). Intriguingly, deletion of Lgl in the Drosophila eye disc, results in hyperproliferation that depends on the transcriptional co-activator Yorkie, a target of the SWH pathway (Grzeschik et al., 2010). Yorkie overexpression can also drive apical domain expansion (Genevet et al., 2009), but it is unclear whether this manipulation affects Notch signaling.
In summary, our analysis of the loss-of-function phenotype for Llgl1 in retinal neuroepithelia has provided insight to the cell biological regulation of neurogenesis and the role of the apical domain as a signaling source capable of influencing cell cycle exit. Analysis of interkinetic nuclear migration in wild-type and llgl1 morphant embryos suggests that apical domain-associated signals cooperate with nuclear position acutely to control the selection of neurogenic progenitor cells. Other mechanisms, such as apical domain partitioning at cytokinesis, are also possible. Future studies will be important to probe further the nuances of how apical domain size is regulated and how polarized signals are transferred to and integrated within the nucleus to impact neurogenesis.
Supplementary Material
Acknowledgments
We thank Anitha Ponnuswami for assistance with construct generation, Pat Cliff for zebrafish husbandry and Clive Wells for assistance on TEM studies. We also thank Drs John Wallingford, Gretchen Dollar and Sergie Sokol for sharing reagents.
Footnotes
Funding
This project was supported by the National Institutes of Health [T32EY014536 to B.S.C., R01CA098161 and R01CA131047 to V.V., and R01EY014167 to B.A.L.], as well as by a National Eye Institute Core Facilities grant [P30EY001931] to the vision research community of the Medical College of Wisconsin. Deposited in PMC for release after 12 months.
Competing interests statement
The authors declare no competing financial interests.
Supplementary material
Supplementary material available online at http://dev.biologists.org/lookup/suppl/doi:10.1242/dev.078097/-/DC1
References
- Afonso C., Henrique D. (2006). PAR3 acts as a molecular organizer to define the apical domain of chick neuroepithelial cells. J. Cell Sci. 119, 4293–4304 [DOI] [PubMed] [Google Scholar]
- Agathocleous M., Iordanova I., Willardsen M. I., Xue X. Y., Vetter M. L., Harris W. A., Moore K. B. (2009). A directional Wnt/beta-catenin-Sox2-proneural pathway regulates the transition from proliferation to differentiation in the Xenopus retina. Development 136, 3289–3299 [DOI] [PMC free article] [PubMed] [Google Scholar]
- Albertson R., Doe C. Q. (2003). Dlg, Scrib and Lgl regulate neuroblast cell size and mitotic spindle asymmetry. Nat. Cell Biol. 5, 166–170 [DOI] [PubMed] [Google Scholar]
- Alexandre P., Reugels A. M., Barker D., Blanc E., Clarke J. D. (2010). Neurons derive from the more apical daughter in asymmetric divisions in the zebrafish neural tube. Nat. Neurosci. 13, 673–679 [DOI] [PubMed] [Google Scholar]
- Baye L. M., Link B. A. (2007). Interkinetic nuclear migration and the selection of neurogenic cell divisions during vertebrate retinogenesis. J. Neurosci. 27, 10143–10152 [DOI] [PMC free article] [PubMed] [Google Scholar]
- Baye L. M., Link B. A. (2008). Nuclear migration during retinal development. Brain Res. 1192, 29–36 [DOI] [PMC free article] [PubMed] [Google Scholar]
- Berghmans S., Murphey R. D., Wienholds E., Neuberg D., Kutok J. L., Fletcher C. D., Morris J. P., Liu T. X., Schulte-Merker S., Kanki J. P., et al. (2005). tp53 mutant zebrafish develop malignant peripheral nerve sheath tumors. Proc. Natl. Acad. Sci. USA 102, 407–412 [DOI] [PMC free article] [PubMed] [Google Scholar]
- Betschinger J., Mechtler K., Knoblich J. A. (2003). The Par complex directs asymmetric cell division by phosphorylating the cytoskeletal protein Lgl. Nature 422, 326–330 [DOI] [PubMed] [Google Scholar]
- Bilder D., Li M., Perrimon N. (2000). Cooperative regulation of cell polarity and growth by Drosophila tumor suppressors. Science 289, 113–116 [DOI] [PubMed] [Google Scholar]
- Bultje R. S., Castaneda-Castellanos D. R., Jan L. Y., Jan Y. N., Kriegstein A. R., Shi S. H. (2009). Mammalian Par3 regulates progenitor cell asymmetric division via notch signaling in the developing neocortex. Neuron 63, 189–202 [DOI] [PMC free article] [PubMed] [Google Scholar]
- Burkel B. M., von Dassow G., Bement W. M. (2007). Versatile fluorescent probes for actin filaments based on the actin-binding domain of utrophin. Cell Motil. Cytoskel. 64, 822–832 [DOI] [PMC free article] [PubMed] [Google Scholar]
- Carmany-Rampey A., Moens C. B. (2006). Modern mosaic analysis in the zebrafish. Methods 39, 228–238 [DOI] [PubMed] [Google Scholar]
- Cayouette M., Whitmore A., Jeffery G., Raff M. (2001). Asymmetric segregation of Numb in retinal development and the influence of the pigmented epithelium. J. Neurosci. 21, 5643–5651 [DOI] [PMC free article] [PubMed] [Google Scholar]
- Cisneros E., Latasa M. J., Garcia-Flores M., Frade J. M. (2008). Instability of Notch1 and Delta1 mRNAs and reduced Notch activity in vertebrate neuroepithelial cells undergoing S-phase. Mol. Cell. Neurosci. 37, 820–831 [DOI] [PubMed] [Google Scholar]
- Clark B. S., Winter M., Cohen A. R., Link B. A. (2011). Generation of Rab-based transgenic lines for in vivo studies of endosome biology in zebrafish. Dev. Dyn. 240, 2452–2465 [DOI] [PMC free article] [PubMed] [Google Scholar]
- Coffman C. R., Skoglund P., Harris W. A., Kintner C. R. (1993). Expression of an extracellular deletion of Xotch diverts cell fate in Xenopus embryos. Cell 73, 659–671 [DOI] [PubMed] [Google Scholar]
- Cohen A. R., Gomes F. L., Roysam B., Cayouette M. (2010). Computational prediction of neural progenitor cell fates. Nat. Methods 7, 213–218 [DOI] [PubMed] [Google Scholar]
- Corbeil D., Marzesco A. M., Wilsch-Brauninger M., Huttner W. B. (2010). The intriguing links between prominin-1 (CD133), cholesterol-based membrane microdomains, remodeling of apical plasma membrane protrusions, extracellular membrane particles, and (neuro)epithelial cell differentiation. FEBS Lett. 584, 1659–1664 [DOI] [PubMed] [Google Scholar]
- Cui S., Otten C., Rohr S., Abdelilah-Seyfried S., Link B. A. (2007). Analysis of aPKClambda and aPKCzeta reveals multiple and redundant functions during vertebrate retinogenesis. Mol. Cell. Neurosci. 34, 431–444 [DOI] [PMC free article] [PubMed] [Google Scholar]
- Del Bene F., Wehman A. M., Link B. A., Baier H. (2008). Regulation of neurogenesis by interkinetic nuclear migration through an apical-basal notch gradient. Cell 134, 1055–1065 [DOI] [PMC free article] [PubMed] [Google Scholar]
- Dollar G. L., Weber U., Mlodzik M., Sokol S. Y. (2005). Regulation of Lethal giant larvae by Dishevelled. Nature 437, 1376–1380 [DOI] [PubMed] [Google Scholar]
- Fortini M. E., Bilder D. (2009). Endocytic regulation of Notch signaling. Curr. Opin. Genet. Dev. 19, 323–328 [DOI] [PMC free article] [PubMed] [Google Scholar]
- Ge X., Frank C. L., Calderon de Anda F., Tsai L. H. (2010). Hook3 interacts with PCM1 to regulate pericentriolar material assembly and the timing of neurogenesis. Neuron 65, 191–203 [DOI] [PMC free article] [PubMed] [Google Scholar]
- Genevet A., Polesello C., Blight K., Robertson F., Collinson L. M., Pichaud F., Tapon N. (2009). The Hippo pathway regulates apical-domain size independently of its growth-control function. J. Cell Sci. 122, 2360–2370 [DOI] [PMC free article] [PubMed] [Google Scholar]
- Grzeschik N. A., Amin N., Secombe J., Brumby A. M., Richardson H. E. (2007). Abnormalities in cell proliferation and apico-basal cell polarity are separable in Drosophila lgl mutant clones in the developing eye. Dev. Biol. 311, 106–123 [DOI] [PMC free article] [PubMed] [Google Scholar]
- Grzeschik N. A., Parsons L. M., Allott M. L., Harvey K. F., Richardson H. E. (2010). Lgl, aPKC, and Crumbs regulate the Salvador/Warts/Hippo pathway through two distinct mechanisms. Curr. Biol. 20, 573–581 [DOI] [PubMed] [Google Scholar]
- Haigo S. L., Hildebrand J. D., Harland R. M., Wallingford J. B. (2003). Shroom induces apical constriction and is required for hingepoint formation during neural tube closure. Curr. Biol. 13, 2125–2137 [DOI] [PubMed] [Google Scholar]
- Hamaratoglu F., Gajewski K., Sansores-Garcia L., Morrison C., Tao C., Halder G. (2009). The Hippo tumor-suppressor pathway regulates apical-domain size in parallel to tissue growth. J. Cell Sci. 122, 2351–2359 [DOI] [PMC free article] [PubMed] [Google Scholar]
- Hava D., Forster U., Matsuda M., Cui S., Link B. A., Eichhorst J., Wiesner B., Chitnis A., Abdelilah-Seyfried S. (2009). Apical membrane maturation and cellular rosette formation during morphogenesis of the zebrafish lateral line. J. Cell Sci. 122, 687–695 [DOI] [PMC free article] [PubMed] [Google Scholar]
- Hildebrand J. D. (2005). Shroom regulates epithelial cell shape via the apical positioning of an actomyosin network. J. Cell Sci. 118, 5191–5203 [DOI] [PubMed] [Google Scholar]
- Horne-Badovinac S., Lin D., Waldron S., Schwarz M., Mbamalu G., Pawson T., Jan Y., Stainier D. Y., Abdelilah-Seyfried S. (2001). Positional cloning of heart and soul reveals multiple roles for PKCλ in zebrafish organogenesis. Curr. Biol. 11, 1492–1502 [DOI] [PubMed] [Google Scholar]
- Hsu Y. C., Jensen A. M. (2010). Multiple domains in the Crumbs Homolog 2a (Crb2a) protein are required for regulating rod photoreceptor size. BMC Cell Biol. 11, 60 [DOI] [PMC free article] [PubMed] [Google Scholar]
- Hu M., Easter S. S. (1999). Retinal neurogenesis: the formation of the intial central patch of postmitotic cells. Dev. Biol. 207, 309–321 [DOI] [PubMed] [Google Scholar]
- Hutterer A., Betschinger J., Petronczki M., Knoblich J. A. (2004). Sequential roles of Cdc42, Par-6, aPKC, and Lgl in the establishment of epithelial polarity during Drosophila embryogenesis. Dev. Cell 6, 845–854 [DOI] [PubMed] [Google Scholar]
- Jensen A. M., Westerfield M. (2004). Zebrafish mosaic eyes is a novel FERM protein required for retinal lamination and retinal pigmented epithelial tight junction formation. Curr. Biol. 14, 711–717 [DOI] [PubMed] [Google Scholar]
- Klezovitch O., Fernandez T. E., Tapscott S. J., Vasioukhin V. (2004). Loss of cell polarity causes severe brain dysplasia in Lgl1 knockout mice. Genes Dev. 18, 559–571 [DOI] [PMC free article] [PubMed] [Google Scholar]
- Kosodo Y., Roper K., Haubensak W., Marzesco A. M., Corbeil D., Huttner W. B. (2004). Asymmetric distribution of the apical plasma membrane during neurogenic divisions of mammalian neuroepithelial cells. EMBO J. 23, 2314–2324 [DOI] [PMC free article] [PubMed] [Google Scholar]
- Latasa M. J., Cisneros E., Frade J. M. (2009). Cell cycle control of Notch signaling and the functional regionalization of the neuroepithelium during vertebrate neurogenesis. Int. J. Dev. Biol. 53, 895–908 [DOI] [PubMed] [Google Scholar]
- Lee C., Scherr H. M., Wallingford J. B. (2007). Shroom family proteins regulate gamma-tubulin distribution and microtubule architecture during epithelial cell shape change. Development 134, 1431–1441 [DOI] [PubMed] [Google Scholar]
- Lee C. Y., Robinson K. J., Doe C. Q. (2006). Lgl, Pins and aPKC regulate neuroblast self-renewal versus differentiation. Nature 439, 594–598 [DOI] [PubMed] [Google Scholar]
- Lee J. H., Gleeson J. G. (2010). The role of primary cilia in neuronal function. Neurobiol. Dis. 38, 167–172 [DOI] [PMC free article] [PubMed] [Google Scholar]
- Leung L., Klopper A. V., Grill S. W., Harris W. A., Norden C. (2011). Apical migration of nuclei during G2 is a prerequisite for all nuclear motion in zebrafish neuroepithelia. Development 138, 5003–5013 [DOI] [PMC free article] [PubMed] [Google Scholar]
- Maitra S., Kulikauskas R. M., Gavilan H., Fehon R. G. (2006). The tumor suppressors Merlin and Expanded function cooperatively to modulate receptor endocytosis and signaling. Curr. Biol. 16, 702–709 [DOI] [PubMed] [Google Scholar]
- Marthiens V., ffrench-Constant C. (2009). Adherens junction domains are split by asymmetric division of embryonic neural stem cells. EMBO Rep. 10, 515–520 [DOI] [PMC free article] [PubMed] [Google Scholar]
- Masai I., Lele Z., Yamaguchi M., Komori A., Nakata A., Nishiwaki Y., Wada H., Tanaka H., Nojima Y., Hammerschmidt M., et al. (2003). N-cadherin mediates retinal lamination, maintenance of forebrain compartments and patterning of retinal neurites. Development 130, 2479–2494 [DOI] [PubMed] [Google Scholar]
- McMahon C., Gestri G., Wilson S. W., Link B. A. (2009). Lmx1b is essential for survival of periocular mesenchymal cells and influences Fgf-mediated retinal patterning in zebrafish. Dev. Biol. 332, 287–298 [DOI] [PMC free article] [PubMed] [Google Scholar]
- Mechler B. M., McGinnis W., Gehring W. J. (1985). Molecular cloning of lethal(2)giant larvae, a recessive oncogene of Drosophila melanogaster. EMBO J. 4, 1551–1557 [DOI] [PMC free article] [PubMed] [Google Scholar]
- Murciano A., Zamora J., Lopez-Sanchez J., Frade J. M. (2002). Interkinetic nuclear movement may provide spatial clues to the regulation of neurogenesis. Mol. Cell. Neurosci. 21, 285–300 [DOI] [PubMed] [Google Scholar]
- Musch A., Cohen D., Yeaman C., Nelson W. J., Rodriguez-Boulan E., Brennwald P. J. (2002). Mammalian homolog of Drosophila tumor suppressor lethal (2) giant larvae interacts with basolateral exocytic machinery in Madin-Darby canine kidney cells. Mol. Biol. Cell 13, 158–168 [DOI] [PMC free article] [PubMed] [Google Scholar]
- Norden C., Young S., Link B. A., Harris W. A. (2009). Actomyosin is the main driver of interkinetic nuclear migration in the retina. Cell 138, 1195–1208 [DOI] [PMC free article] [PubMed] [Google Scholar]
- Ohata S., Aoki R., Kinoshita S., Yamaguchi M., Tsuruoka-Kinoshita S., Tanaka H., Wada H., Watabe S., Tsuboi T., Masai I., et al. (2011). Dual roles of Notch in regulation of apically restricted mitosis and apicobasal polarity of neuroepithelial cells. Neuron 69, 215–230 [DOI] [PubMed] [Google Scholar]
- Pauls S., Geldmacher-Voss B., Campos-Ortega J. A. (2001). A zebrafish histone variant H2A.F/Z and a transgenic H2A.F/Z:GFP fusion protein for in vivo studies of embryonic development. Dev. Genes Evol. 211, 603–610 [DOI] [PubMed] [Google Scholar]
- Peng C. Y., Manning L., Albertson R., Doe C. Q. (2000). The tumour-suppressor genes lgl and dlg regulate basal protein targeting in Drosophila neuroblasts. Nature 408, 596–600 [DOI] [PubMed] [Google Scholar]
- Pfaffl M. W., Horgan G. W., Dempfle L. (2002). Relative expression software tool (REST) for group-wise comparison and statistical analysis of relative expression results in real-time PCR. Nucleic Acids Res. 30, e36 [DOI] [PMC free article] [PubMed] [Google Scholar]
- Pittman A. J., Law M. Y., Chien C. B. (2008). Pathfinding in a large vertebrate axon tract: isotypic interactions guide retinotectal axons at multiple choice points. Development 135, 2865–2871 [DOI] [PMC free article] [PubMed] [Google Scholar]
- Plant P. J., Fawcett J. P., Lin D. C., Holdorf A. D., Binns K., Kulkarni S., Pawson T. (2003). A polarity complex of mPar-6 and atypical PKC binds, phosphorylates and regulates mammalian Lgl. Nat. Cell Biol. 5, 301–308 [DOI] [PubMed] [Google Scholar]
- Poggi L., Vitorino M., Masai I., Harris W. A. (2005). Influences on neural lineage and mode of division in the zebrafish retina in vivo. J. Cell Biol. 171, 991–999 [DOI] [PMC free article] [PubMed] [Google Scholar]
- Reischauer S., Levesque M. P., Nusslein-Volhard C., Sonawane M. (2009). Lgl2 executes its function as a tumor suppressor by regulating ErbB signaling in the zebrafish epidermis. PLoS Genet. 5, e1000720 [DOI] [PMC free article] [PubMed] [Google Scholar]
- Robu M. E., Larson J. D., Nasevicius A., Beiraghi S., Brenner C., Farber S. A., Ekker S. C. (2007). p53 activation by knockdown technologies. PLoS Genet. 3, e78 [DOI] [PMC free article] [PubMed] [Google Scholar]
- Rolls M. M., Albertson R., Shih H. P., Lee C. Y., Doe C. Q. (2003). Drosophila aPKC regulates cell polarity and cell proliferation in neuroblasts and epithelia. J. Cell Biol. 163, 1089–1098 [DOI] [PMC free article] [PubMed] [Google Scholar]
- Salomoni P., Calegari F. (2010). Cell cycle control of mammalian neural stem cells: putting a speed limit on G1. Trends Cell Biol. 20, 233–243 [DOI] [PubMed] [Google Scholar]
- Sawa H. (2010). Specification of neurons through asymmetric cell divisions. Curr. Opin. Neurobiol. 20, 44–49 [DOI] [PubMed] [Google Scholar]
- Sawyer J. M., Harrell J. R., Shemer G., Sullivan-Brown J., Roh-Johnson M., Goldstein B. (2009). Apical constriction: a cell shape change that can drive morphogenesis. Dev. Biol. 341, 5–19 [DOI] [PMC free article] [PubMed] [Google Scholar]
- Schenk J., Wilsch-Brauninger M., Calegari F., Huttner W. B. (2009). Myosin II is required for interkinetic nuclear migration of neural progenitors. Proc. Natl. Acad. Sci. USA 106, 16487–16492 [DOI] [PMC free article] [PubMed] [Google Scholar]
- Sonawane M., Carpio Y., Geisler R., Schwarz H., Maischein H.-M., Nuesslein-Volhard C. (2005). Zebrafish penner/lethal giant larvae 2 functions in hemidesmosome formation, maintenance of cellular morphology and growth regulation in the developing basal epidermis. Development 132, 3255–3265 [DOI] [PubMed] [Google Scholar]
- Sonawane M., Martin-Maischein H., Schwarz H., Nusslein-Volhard C. (2009). Lgl2 and E-cadherin act antagonistically to regulate hemidesmosome formation during epidermal development in zebrafish. Development 136, 1231–1240 [DOI] [PubMed] [Google Scholar]
- Strand D., Unger S., Corvi R., Hartenstein K., Schenkel H., Kalmes A., Merdes G., Neumann B., Krieg-Schneider F., Coy J. F., et al. (1995). A human homologue of the Drosophila tumour suppressor gene l(2)gl maps to 17p11.2-12 and codes for a cytoskeletal protein that associates with nonmuscle myosin II heavy chain. Oncogene 11, 291–301 [PubMed] [Google Scholar]
- Tsai J. W., Chen Y., Kriegstein A. R., Vallee R. B. (2005). LIS1 RNA interference blocks neural stem cell division, morphogenesis, and motility at multiple stages. J. Cell Biol. 170, 935–945 [DOI] [PMC free article] [PubMed] [Google Scholar]
- Vaccari T., Bilder D. (2005). The Drosophila tumor suppressor vps25 prevents nonautonomous overproliferation by regulating notch trafficking. Dev. Cell 9, 687–698 [DOI] [PubMed] [Google Scholar]
- Van Raay T. J., Moore K. B., Iordanova I., Steele M., Jamrich M., Harris W. A., Vetter M. L. (2005). Frizzled 5 signaling governs the neural potential of progenitors in the developing Xenopus retina. Neuron 46, 23–36 [DOI] [PubMed] [Google Scholar]
- Vasioukhin V. (2006). Lethal giant puzzle of Lgl. Dev. Neurosci. 28, 13–24 [DOI] [PubMed] [Google Scholar]
- Wei X., Malicki J. (2002). nagie oko, encoding a MAGUK-family protein, is essential for cellular patterning of the retina. Nat. Genet. 31, 150–157 [DOI] [PubMed] [Google Scholar]
- Willardsen M. I., Link B. A. (2011). Cell biological regulation of division fate in vertebrate neuroepithelial cells. Dev. Dyn. 240, 1865–1879 [DOI] [PMC free article] [PubMed] [Google Scholar]
- Xie Z., Moy L. Y., Sanada K., Zhou Y., Buchman J. J., Tsai L. H. (2007). Cep120 and TACCs control interkinetic nuclear migration and the neural progenitor pool. Neuron 56, 79–93 [DOI] [PMC free article] [PubMed] [Google Scholar]
- Yamaguchi M., Tonou-Fujimori N., Komori A., Maeda R., Nojima Y., Li H., Okamoto H., Masai I. (2005). Histone deacetylase 1 regulates retinal neurogenesis in zebrafish by suppressing Wnt and Notch signaling pathways. Development 132, 3027–3043 [DOI] [PubMed] [Google Scholar]
- Yamaguchi M., Imai F., Tonou-Fujimori N., Masai I. (2010). Mutations in N-cadherin and a Stardust homolog, Nagie oko, affect cell-cycle exit in zebrafish retina. Mech. Dev. 127, 247–264 [DOI] [PubMed] [Google Scholar]
- Yamanaka T., Ohno S. (2008). Role of Lgl/Dlg/Scribble in the regulation of epithelial junction, polarity and growth. Front. Biosci. 13, 6693–6707 [DOI] [PubMed] [Google Scholar]
- Yamanaka T., Horikoshi Y., Sugiyama Y., Ishiyama C., Suzuki A., Hirose T., Iwamatsu A., Shinohara A., Ohno S. (2003). Mammalian Lgl forms a protein complex with PAR-6 and aPKC independently of PAR-3 to regulate epithelial cell polarity. Curr. Biol. 13, 734–743 [DOI] [PubMed] [Google Scholar]
- Yamanaka T., Horikoshi Y., Izumi N., Suzuki A., Mizuno K., Ohno S. (2006). Lgl mediates apical domain disassembly by suppressing the PAR-3-aPKC-PAR-6 complex to orient apical membrane polarity. J. Cell Sci. 119, 2107–2118 [DOI] [PubMed] [Google Scholar]
- Yeo S. Y., Kim M., Kim H. S., Huh T. L., Chitnis A. B. (2007). Fluorescent protein expression driven by her4 regulatory elements reveals the spatiotemporal pattern of Notch signaling in the nervous system of zebrafish embryos. Dev. Biol. 301, 555–567 [DOI] [PubMed] [Google Scholar]
- Yu J., Poulton J., Huang Y. C., Deng W. M. (2008). The hippo pathway promotes Notch signaling in regulation of cell differentiation, proliferation, and oocyte polarity. PLoS ONE 3, e1761 [DOI] [PMC free article] [PubMed] [Google Scholar]
- Yu J., Lei K., Zhou M., Craft C. M., Xu G., Xu T., Zhuang Y., Xu R., Han M. (2011). KASH protein Syne-2/Nesprin-2 and SUN proteins SUN1/2 mediate nuclear migration during mammalian retinal development. Hum. Mol. Genet. 20, 1061–1073 [DOI] [PMC free article] [PubMed] [Google Scholar]
- Zhang X., Lei K., Yuan X., Wu X., Zhuang Y., Xu T., Xu R., Han M. (2009). SUN1/2 and Syne/Nesprin-1/2 complexes connect centrosome to the nucleus during neurogenesis and neuronal migration in mice. Neuron 64, 173–187 [DOI] [PMC free article] [PubMed] [Google Scholar]
- Zigman M., Cayouette M., Charalambous C., Schleiffer A., Hoeller O., Dunican D., McCudden C. R., Firnberg N., Barres B. A., Siderovski D. P., et al. (2005). Mammalian inscuteable regulates spindle orientation and cell fate in the developing retina. Neuron 48, 539–545 [DOI] [PubMed] [Google Scholar]
Associated Data
This section collects any data citations, data availability statements, or supplementary materials included in this article.