

Abstract
Lateral heterogeneity of cell membranes has been demonstrated in numerous studies showing anomalous diffusion of membrane proteins; it has been explained by models and experiments suggesting dynamic barriers to free diffusion, that temporarily confine membrane proteins into microscopic patches. This picture, however, comes short of explaining a steady-state patchy distribution of proteins, in face of the transient opening of the barriers. In our previous work we directly imaged persistent clusters of MHC-I, a type I transmembrane protein, and proposed a model of a dynamic equilibrium between proteins newly delivered to the cell surface by vesicle traffic, temporary confinement by dynamic barriers to lateral diffusion, and dispersion of the clusters by diffusion over the dynamic barriers. Our model predicted that the clusters are dynamic, appearing when an exocytic vesicle fuses with the plasma membrane and dispersing with a typical lifetime that depends on lateral diffusion and the dynamics of barriers. In a subsequent work, we showed this to be the case. Here we test another prediction of the model, and show that changing the stability of actin barriers to lateral diffusion changes cluster lifetimes. We also develop a model for the distribution of cluster lifetimes, consistent with the function of barriers to lateral diffusion in maintaining MHC-I clusters.
Introduction
The fluid mosaic model of cell membrane organization emphasizes the autonomy and lateral mobility of membrane proteins and lipids; the model characterizes membranes as more fluid than mosaic (1). In recent years, it has become clear that, in fact, membrane lipids and proteins associate on many scales from protein dimers to multimolecular clusters, to micrometer-size membrane domains (2,3). The mechanisms of molecular associations and domain formation vary for different molecules and for different size-scales. At the smallest scale, differences in interaction energies among different proteins and lipids will lead to differential associations and formation of small clusters of membrane proteins and lipids. At larger length-scales these small clusters can be stabilized and their size enhanced by constraints to lateral diffusion. Some of these constraints arise in the actin-rich membrane skeleton (4). Other constraints to lateral diffusion (which can therefore stabilize molecular clusters) can be inferred from the anomalous lateral diffusion of many membrane proteins (5).
Class I major histocompatibility complex (MHC) molecules, type I transmembrane proteins, exhibit such constrained diffusion, as was demonstrated using fluorescence recovery after photobleaching (FRAP) measurements. The results were interpreted as a slow diffusion coefficient (∼10−10 cm2 s−1) within a protein-rich domain and a fast (∼10−9 cm2 s−1) diffusion coefficient in the continuum between such domains. The borders of the protein-rich domains were demonstrated to reside in the cytosol and were suggested to consist of cytoskeletal components (6). This interpretation, consistent with the membrane-skeleton fence model (7), further prompted the direct observation of these protein-rich domains, delineated by cytoskeletal fences, and predicted to be of ∼200-nm dimensions from single-particle tracking observations on other membrane proteins (8). We used super-resolution, near-field scanning optical microscopy (9) and also a deconvolution approach to conventional micrographs (10) to directly image immunolabeled MHC-I on the plasma membrane, and found protein-rich domains with sizes of 300–700 nm. We also estimated the number of molecules present in one such domain to be 25–125 (9). This number was later measured again using far-field microscopy and found to be 20–240 (10), consistent with the earlier estimation. We refer to these protein-rich regions inferred from FRAP studies, delineated by cytoskeletal barriers to free diffusion, and directly imaged with near-field scanning optical microscopy and far-field microscopy as clusters of MHC-I molecules. Changes in the extent of class I MHC clustering have functional consequences. Dispersal of small-scale clusters interferes with the recognition of MHC molecules by effector T-lymphocytes (11). Stabilizing larger clusters, by stabilizing membrane skeleton's actin, has the opposite effect, enhancing recognition of MHC molecules by effector lymphocytes (12).
The existence of MHC-I clusters, however, cannot be explained merely by the existence of barriers to free diffusion, because these barriers were shown to be dynamic and allow escape and diffusion of proteins out of the protein-rich domains. Thus, a given cluster should disperse by diffusion over the barriers in a relatively short time, and the persistence of clusters must be maintained by some replenishing mechanism. To better understand the persistence of MHC clusters at steady state, we made a quantitative model based on the proposal that protein clusters are maintained by a combination of vesicle trafficking to and from the cell surface (leading to local concentrations of newly delivered membrane proteins), confinement of membrane proteins by dynamic barriers, and the dispersion of individual clusters by lateral diffusion (13). The model predicts that individual clusters appear instantly at different points in time, due to delivery of molecules by a fusing vesicle and the temporary restraint of these newly delivered molecules by fences; each cluster concentration decays with a characteristic lifetime due to (restricted) diffusion over the cytoskeleton barriers.
The apparent size of the individual cluster also increases with time, due to this diffusion over the barriers. The population of clusters present on the membrane at any given point in time is thus heterogeneous in size and concentration, because different clusters are born in different moments and their size increases, whereas their concentration decreases with time. The model does not assume any kind of interaction between the molecules; the simulated clusters are formed solely due to a dynamic equilibrium between continuous delivery of new molecules at distinct locations on the plasma membrane and their temporary restraint by the fences. Moreover, the model assumes the delivery sites of new molecules are random. Despite this dynamic and random picture, two-dimensional autocorrelation of the simulated membrane captures a typical size and extent of clustering (contrast or deviation from a uniform random distribution of molecules). When studying the simulated dynamics of individual simulated clusters, we predicted an exponential decay of their concentration, with a typical 1/e lifetime of ∼20 s.
To test this dynamic nature of the clusters, we used live cells with GFP-tagged MHC-I combined with total internal reflection fluorescence microscopy (TIRFM) real-time imaging (14). We showed that the size and intensity of a particular cluster varies with time. An example is shown in Fig. 1: the waterfall plot in Fig. 1 D shows the intensity profile (as a function of position) of a single cluster and its progression with time. The cluster is born at an instant (indicated in Fig. 1 C), followed by an exponential decay in its intensity and a progressive widening. Various clusters in a given frame have various sizes and intensities, depending on their age, number of molecules forming them, and initial size (at the time of birth). A characteristic size can be extracted by using two-dimensional autocorrelation of the images, as we have shown in Hwang et al. (9) and Gheber and Edidin (13) or by constructing a distribution of individual sizes, as was shown in Tang and Edidin (10), where the distribution of cluster sizes was found to be approximately Gaussian, with a mean of ∼320 nm and a standard deviation of ∼30 nm. This size distribution changes (the mean size increases) upon inhibiting vesicle traffic to the plasma membrane (10).
Figure 1.
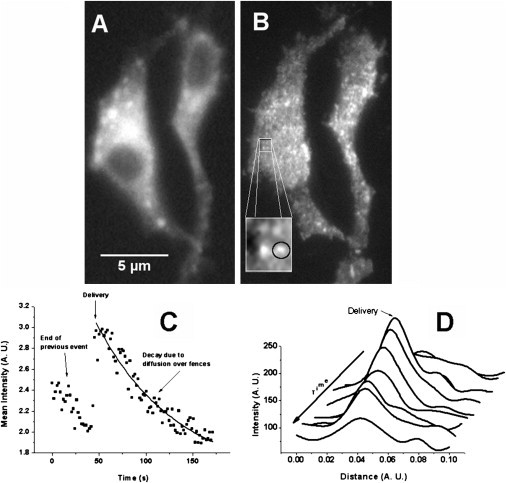
Comparison between epi-fluorescence and TIRF imaging. (A) Epi-fluorescence image of two GFP-tagged MHC-I fibroblasts. The nuclei (dark) are visible and patches of fluorescence are not well localized. (B) The same two cells, in the same focal plane, imaged using TIRFM. Cells appear two-dimensional, the membrane contour is sharp, and the MHC-I clusters are easily distinguished (see zoomed-in inset). (Circle, inset) Example of selection of a clearly distinguishable cluster. (C) A time-dependent plot of the average intensity in an area as was indicated (see circle in panel B). In this particular case, a new delivery is observed (indicated by an arrow). The intensity decays exponentially with time both before and after the delivery. The data after the delivery is fitted with an exponential decay (solid line). (D) Intensity profiles as a function of position of the cluster analyzed in panel C, at 10 different time points (see waterfall plot). The profiles are laterally displaced along the x axis for clarity, to form a pseudo-three-dimensional view of the spatial evolution of a single cluster with time; there is no lateral motion of the cluster peak in reality. (Arrow) Time progresses from back to front. The cluster intensity and dimensions are seen to change with time: the cluster is bright and narrow upon delivery, becoming dimmer and wider as time progresses.
Fitting the time-dependent intensity of individual clusters with a decaying exponential function, we extracted the typical lifetime of individual clusters, constructed the lifetime distribution, and found the characteristic lifetime of a cluster is ∼35 s (14), in very good agreement with the predictions of the model (13) and with other data on kinetics of exocytic traffic (15).
In this article we characterize the lifetimes of MHC-I clusters and compare the lifetime distributions resulting from various drug treatments that stabilize or destabilize the actin of the plasma membrane skeleton; our model (13) predicts that these treatments should affect the lifetime of MHC-I clusters. Stabilizing actin, a likely component of barriers to lateral diffusion (12), is expected to prolong the lifetime of a cluster of MHC molecules; destabilizing is expected to reduce this lifetime by removing some impediments to lateral diffusion. Here we show that this is the case. We also investigate the shape of the distribution of cluster lifetimes and develop a model that emphasizes the importance of barriers to lateral diffusion in determining cluster lifetime.
Materials and Methods
All reagents were purchased from Biological Industries, Kibbutz Beit Haemek, Israel, unless otherwise noted.
Cell culture
Normal mouse fibroblasts (L-M(tk−)) expressing MHC I, H2-Ld with their intracellular region tagged with GFP (GFP-in) (13) were cultured in 250-mL TC flasks (CELSTAR tissue culture dishes; Grenier Bio-One, Monroe, NC) at 37°C and 5% CO2 in Roswell Park Memorial Institute Medium (RPMI-1640) without L-glutamine, with 10% Fetal Bovine Serum, 0.22 mg/mL G418 (Geneticin; Sigma, St. Louis, MO). The correct folding and function of the GFP construct was validated and reported in Marguet et al. (16); we thus assume it is a faithful reporter of the endogenous MHC-I population.
Cell mounting
Cells were detached from flasks by incubating in 2 mL Trypsin EDTA 0.25% for 10 min at 37°C, and transferred to homemade glass bottom petri dishes, in 4 mL medium. After overnight incubation, medium was removed and dishes were gently rinsed three times and imaged in 0.5 mL warmed (37°C) HEPES Hanks' balanced salt solution.
Treatments
Cells were incubated for 30 min at 37°C in 10 or 20 μM Phalloidin (Sigma), or in 100 or 200 nM Latrunculin A (Sigma). Subsequently, the cells were gently rinsed three times and imaged in 5 mL warmed (37°C), drug-free, HEPES Hanks' balanced salt solution, for 1 h. Higher concentrations of Latrunculin A proved to result in observable shape change of the cells, and were not used in experiments. At 200 nM Latrunculin A, the cells maintained their shape, with good adhesion.
Imaging
Imaging was performed in drug-free HEPES Hanks' balanced salt solution. Imaging was carried out on a homemade prism-based total internal reflection fluorescence microscopy (TIRFM) system, using an Argon-ion laser (2213-75SLY; Uniphase, San Jose, CA) at 488 nm as the excitation light source. Digital images were acquired with a SPOT charge-coupled device camera (Diagnostic Instruments, Sterling Heights, MI), mounted on an Axioplan2 upright light microscope with a 40×, 0.8 NA water dipping objective (Carl Zeiss Microimaging, Peabody, MA), as previously described in Lavi et al. (14). TIRFM excludes the fluorescence originating in the cell cytoplasm and allows observation of the clusters on the plasma membrane only, as seen in the comparison between panels A and B in Fig. 1. Time series were acquired, 5-min-long each, for a total of 1 h, of the same field. Exposure times ranged between 1 and 2.5 s per frame, depending on the brightness of the cells under investigation. These exposure times are short compared with the dynamics we are sampling (tens of seconds) and were found to be an optimal compromise between low noise and high photobleaching. One-h-long time series were analyzed separately for the first 30 min and last 30 min, to obtain information on the time dependence of the distributions.
Image analysis
Image analysis was carried out using the software ImageJ (National Institutes of Health, Bethesda, MD; available freely at http://imagej.nih.gov/ij/), as follows.
The inset of Fig. 1 B is a zoom-in of the area indicated and shows four clearly distinguishable clusters. The circle around the bottom-right cluster in the inset shows an example of definition of a region of interest (ROI). Clusters were identified in this manner on one frame of a series, where it was the most distinguishable from its background and the intensity of the ROI (as a mean shaded value) was quantified throughout the series. The intensity was plotted as a function of time, after background and photobleaching corrections.
For each cluster, the time-dependent intensity was fitted with a single exponential decay function of the form I(t) = I0 +A exp (−t/τ), where I0 is the intensity for t = ∞, τ is the characteristic lifetime of the patch, and A is its intensity above the background for t = 0. Such a plot is shown in Fig. 1 C, where a new delivery is also observed during the measurement. The solid line represents an exponential fit as mentioned above. The individual lifetimes (τ) thus quantified for hundreds of clusters were then used to construct distributions of lifetimes.
Significance test
Lifetime distributions were all positively skewed and were fitted with a lognormal distribution function of the form
where τ is the characteristic lifetime extracted from the exponential fit of the intensity versus time trace of individual clusters, and τc is the most probable value (the mode, or peak). When comparing distributions, we used the mode as the measure of location of the distribution, because it is the most intuitive and easy to identify (visually). However, to test significance of differences between the mean lifetimes resulting from various treatments, we compared the distributions of ln(τ), which were found to be indistinguishable from normal distributions (by Shapiro-Wilk and Liliefors normality tests). We then used a t-test on log-transformed data, to test the null hypothesis that two distributions have the same mean.
Results and Discussion
Total internal reflection fluorescence microscopy (TIRFM) is a well-established technique (14,17) that preferentially excites fluorescence from the cell surface, while excluding most fluorescence from the cytoplasm. GFP-tagged MHC-I proteins traffic from the endoplasmic reticulum through the Golgi complex to the surface. Hence, fluorescence is present throughout the cell cytoplasm. TIRFM excludes this cytoplasmic fluorescence from the image, as shown in Fig. 1, which compares conventional epifluorescence (Fig. 1 A) and TIRF illumination (Fig. 1 B).
Clusters were identified in a frame of a stack of images, as shown by the circular ROI in the inset of Fig. 1 B, and their average (per pixel) intensity was quantified and plotted against time, for the entire duration of the measurement, as shown in Fig. 1 C. As predicted by our model (13), the clusters are born at an instant (Fig. 1 C); their average intensity decays exponentially with time (Fig. 1 C), and their size increases with time (Fig. 1 D). The decrease of intensity over time was fitted with an exponential decay function, as discussed in Materials and Methods, after which a distribution of lifetimes (extracted τ) was constructed, in a similar way as previously reported in Lavi et al. (14).
Actin stabilization or destabilization changes the lifetimes of MHC I clusters
To test the hypothesis that stabilizing or destabilizing actin filaments alters cluster lifetime, by changing the dynamics of the barriers that obstruct free diffusion, we treated cells with drugs—Phalloidin and Lantrunculin A—which stabilize or destabilize actin filaments, respectively. Phalloidin binds to filamentous actin much more tightly than to actin monomers, leading to a decrease in the dissociation of actin subunits from filament ends. This stabilizes actin filaments through the prevention of filament depolymerization (18). Latrunculin A binds actin monomers more readily than F-actin, thus preventing their incorporation into polymerizing F-actin filaments. Hence, it decreases the rate constant for the association of actin monomers, destabilizing actin filaments (19).
The distribution of cluster lifetimes for untreated cells (control) is presented in Fig. 2 (middle panel); the modal lifetime is 42 s, in agreement with our earlier result (14). Treatment with 20 μM Phalloidin caused a shift toward longer lifetimes, with a mode of 92 s, as shown in Fig. 2 (bottom panel). Treatment with 200 nM Latrunculin A shifted cluster lifetimes toward shorter lifetimes with a mode of 26 s, as shown in Fig. 2 (top panel). Analysis of the log-transformed data showed that the average lifetimes of clusters in drug-treated cells were significantly different (p < 0.05) from those in untreated cells. Thus, stabilization of actin filaments, which ought to hinder dispersion of MHC-I molecules by lateral diffusion, increases the lifetime of MHC-I clusters (Fig. 2, bottom), whereas destabilization of actin filaments, which ought to enhance cluster dispersion, decreases cluster lifetimes (Fig. 2, top).
Figure 2.
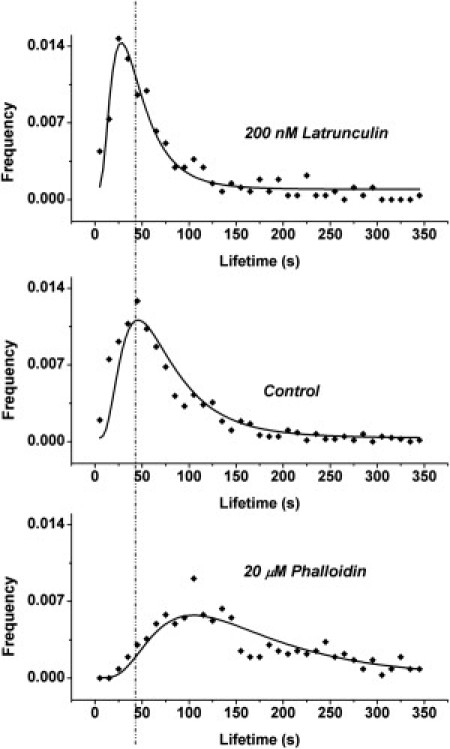
Lifetime distributions of MHC-I clusters on plasma membrane of cells treated with (top panel) 200 nM Latrunculin A and (bottom panel) 20 μM Phalloidin. (Middle panel) Distribution for clusters of untreated cells. (Solid lines) Fit of log-normal distribution to the data points. (Vertical dashed line) Mode (peak) of the distribution for untreated cells.
The effect of Phalloidin and Latrunculin A on MHC I cluster lifetimes is transient
Time series were acquired for cells treated with 20 μM Phalloidin for 1 h after a rinse and change to balanced salt solution. Comparing distribution of lifetimes acquired during the first 30 min and during the following 30 min, it is evident that the effect of treatment is reversible (Fig. 3). During the first 30 min of imaging (Fig. 3 A), the modal cluster life time is 92 s (similar to that shown for phalloidin-treated cells in Fig. 2, bottom panel), whereas during the following 30 min, a significantly (p < 0.05) shorter modal lifetime, 64 s is measured. The effect of Phalloidin is thus transient.
Figure 3.
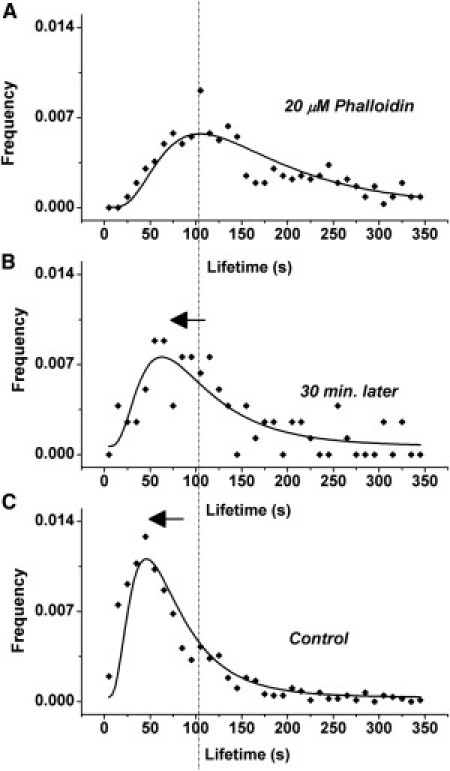
Shift in cluster life times is transient for Phalloidin. (A) Lifetime of MHC-I clusters from cells incubated with 20 μM Phalloidin (identical with Fig. 2, bottom panel) imaged immediately after removing the drug. (B) Lifetime of MHC-I clusters from same cells, 30 min after removing the drug. (C) Lifetime of MHC-I clusters from untreated cells. (Solid lines) Fit to log-normal distribution. (Vertical dashed line) Mode (peak) of the distribution for 20 μM Phalloidin treatment. (Arrows) Gradual shift toward shorter lifetimes, as the effect of Phalloidin is reduced.
Similar experiments with 200 nM Latrunculin A showed that the decrease of cluster lifetime is transient as well, and at 30-min posttreatment, a significant increase (p < 0.05) in modal lifetime was measured, as shown in Fig. 4.
Figure 4.
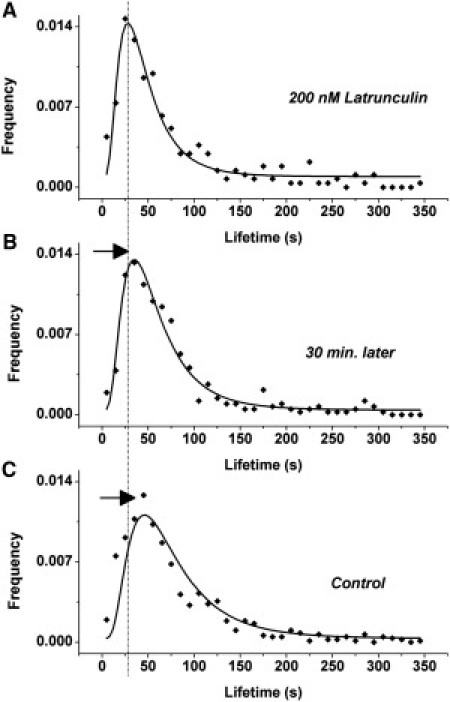
Shift in cluster lifetimes is transient for Latrunculin. (A) Lifetime of MHC-I clusters from cells incubated with 200 nM Latrunculin (identical with Fig. 2, top panel) imaged immediately after removing the drug. (B) Lifetime of MHC-I clusters from same cells, 30 min after removing the drug. (C) Lifetime of MHC-I clusters from untreated cells. (Solid lines) Fit to log-normal distribution. (Vertical dashed line) Mode (peak) of the distribution for 200 nM Latrunculin treatment. (Arrows) Gradual shift toward longer lifetimes, as the effect of Latrunculin is reduced.
Lifetime of MHC I clusters depends on dose of treatment
Intermediate concentrations, 100 nM of Latrunculin A and 10 μM of Phalloidin gave intermediate cluster lifetimes, as shown in Fig. 5. Thus it is possible to shift the characteristic lifetimes of MHC-I clusters over a range of ∼20–∼90 s, using this relatively simple protocol. The shift, although transient, provides a time window of several tens of minutes when lifetimes are altered, and could be used to determine the relationship between clustering and function, for example in the recognition of MHC-I proteins by T cells.
Figure 5.
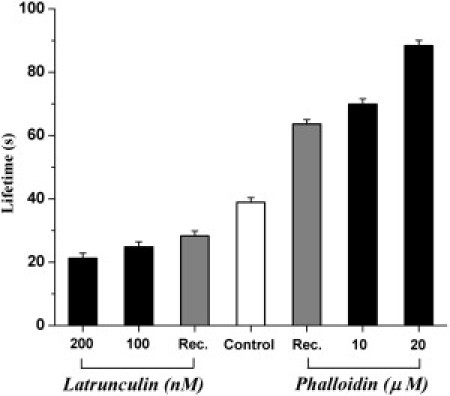
Modal cluster lifetimes for MHC-I molecules on cells treated with actin-modulating drugs. (Open bar, Control) Cluster lifetime of untreated cells. (Shaded columns, Rec. (Recovery)) Lifetime measured 30-min post treatment with Latrunculin A (200 nM) or Phalloidin (20 μM), as indicated. (Solid columns) Modal lifetime for cells treated with the indicated drug concentration. (Error bars) Mean ± SE for log-transformed data.
The source of log-normal distribution of cluster lifetimes
The lifetime distributions presented here and previously (14) are positively skewed, and we used the log-normal distribution to fit the data and extract the distribution parameters (mainly the mode of the distribution) to infer significance of effects induced by various treatments. In this section we discuss the underlying factors that may lead to this measured distribution of τ.
Consider an initial high concentration (ρ) of molecules (delivered by a vesicle) in a region of size R (determined by the spacing between actin filaments), which then decays as ρ(t) ∼ exp(−t/τ); the lifetime τ is given by τ = R2/D, where D is the diffusion coefficient of the fluorescent marker in the membrane. The distribution of decay times τ is thus determined by two factors: the obstacles to diffusion that control D, and the size of the original patch R, which in turn is determined by the dimensions of the region where the molecules are delivered. We analyze the expected distribution of lifetimes, as a result of these two possible contributions, separately.
First possible contribution
1. First we consider the case where the decay times may be controlled by the variability in D, i.e., by the strength of the obstructions to diffusion. We can assume that the escape time from each small trap is given by the usual form (5)
| (1) |
where τ0 is the attempt time related to the free diffusion within the membrane, and ΔE is the energy barrier (in units of kBT).
The distribution of barrier heights can be treated as a Gaussian around some typical barrier strength ΔE0,
| (2) |
and to simplify the analysis we take it to apply in the range −∞ < ΔE < ∞. Then the distribution of decay times is given by
| (3) |
which is essentially a log-normal distribution.
Second possible contribution
2. We now consider a case where the distribution of τ is controlled by the variability in R. The distribution of R is not known; however, we may explore several processes that give rise to known distributions:
a. For example, if the distribution of patch sizes is given by some aggregation processes, this results in the form (20)
| (4) |
for 0 < R < ∞, then the distribution of decay times is given by
| (5) |
which is essentially an exponential distribution.
b. Another possible process discussed in Gov (20), that could give rise to an interesting distribution of R, is for a flat circular domain that grows by aggregation along its rim, while decaying anywhere in its interior. We may think of a process whereby a membrane domain (or a hole in the cortical cytoskeleton network) grows by coalescence with smaller domains (holes) along its rim, but may shrink due to new cytoskeleton barriers appearing anywhere within its bulk. Such a process would result in a distribution of R of the form
| (6) |
which is essentially a shifted Gaussian distribution centered roughly around R0 (compared to Eq. 14). Using this gives the distribution for τ as
| (7) |
At large τ this is again an exponential distribution, but it now has a peak, and throughout most of the measured regime it decays essentially as .
In Fig. 6 we compare these three distributions to the experimental data (a log-log plot is shown in Fig. S1 in the Supporting Material, where the behavior at short τ can be more easily observed). Importantly, the equation resulting from assuming variability in D (Eq. 3) has fitting parameters involving the energy barrier for crossing the obstacles (ΔE0) and the width of distribution of this energy barrier (αE). Thus, when modulating the strength of the actin fences, we expect to see a change in ΔE0, consistent with lowering or raising the energy barriers. On the other hand, Eqs. 5 and 7, resulting from the assumption that variability in R leads to the distribution of τ, have fitting parameters involving D (the diffusion coefficient). We thus expect to observe a change in D consistent with the modulation of the actin fences. We cannot directly extract values for D from this fit, because we are missing values for the other parameters. However, in our original model (13) we assumed D ∼ 10−9 cm2 s−1 for free diffusion and D ∼ 10−10 cm2 s−1 for hindered diffusion (as measured using FRAP (6)) and calculated a typical cluster lifetime of ∼20 s, in very good agreement with the measured 35–45 s. The diffusion coefficients underlying the distributions measured here must, thus, be of the same order of magnitude.
Figure 6.
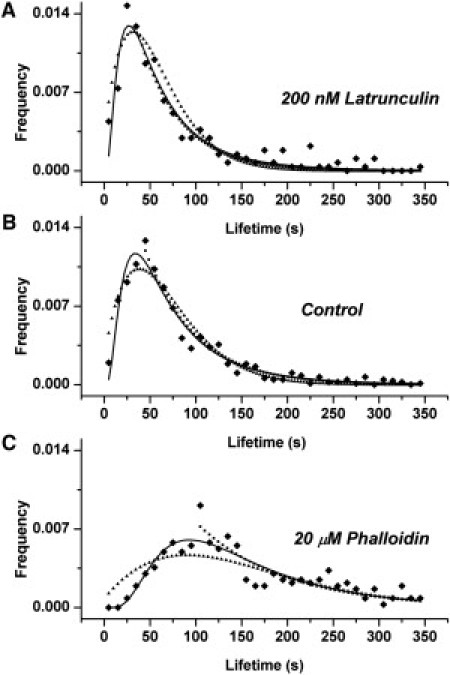
Fitting the data with the resulting distributions. The figure shows fitting of experimental data with Eq. 3 (solid line), Eq. 5 (dotted line), and Eq. 7 (triangles) for the treatment with 200 nM Latrunculin (A), control cells (B), and 20 μM Phalloidin (C). The fitting parameters for each equation are given in Table 1.
It turns out that the log-normal distribution (Eq. 3) gives a very good fit with the values of the parameters given in Table 1. From these values we observe that when Phalloidin (Latrunculin A) is used to stabilize (destabilize) the actin filaments, this results in larger (smaller) energy barriers (ΔE0) whereas the width of the energy barrier distribution (αE) is affected very little. Thus, barrier height decreases for destabilization, and increases for stabilization of actin fences.
Table 1.
Fitting parameters for the data shown in Fig. 6
|
τ0 |
ΔE0 |
αE |
D/α2R |
D/α2R |
R0/αR |
|
|---|---|---|---|---|---|---|
| Eq. 3 | Eq. 5 | Eq. 7 | ||||
| Latrunculin, 200 nM | 0.94 | 3.97 | 1.1 | 0.022 | 0.060 | 1.4 |
| Control | 0.99 | 4.10 | 1.1 | 0.018 | 0.050 | 1.4 |
| Phalloidin 200, μM | 1.05 | 4.86 | 0.9 | 0.005 | 0.025 | 1.5 |
Uncertainty in the values of the parameters is indicated by the number of significant digits.
The behavior at large values of τ could, however, also roughly be fit with an exponential decay (Eq. 5). From the values in Table 1 we observe that values of D/α2R (corresponding to diffusion coefficients) are larger (faster diffusion) for destabilization and smaller (slower diffusion) for stabilization of actin filaments. Equation 7 fits better the data for all values of τ (not just large values, like Eq. 5), although at small values of τ it is not as successful as Eq. 3. Nevertheless, the values of the fitting parameters (in Table 1) show again lower values of D/α2R (slow diffusion) for stabilization and higher values (fast diffusion) for destabilization of actin filaments, with a negligible variation of the initial patch size distribution (determined by the parameters R0/αR) across treatments. This initial patch distribution is presumably determined by the size of the delivery vesicles, and thus is not sensitive to drug treatment of the actin filaments.
In general, the extent of the effect is smaller for treatment with Latrunculin A (both for the experimental data and obviously, as reflected in the fitting parameters) than that for treatment with Phalloidin, because we limited ourselves to a maximum concentration of 200 nm for Latrunculin A, in order not to change the adhesion and shape of the drug-treated cells.
The two complementary interpretations show that the treatment with Phalloidin and Latrunculin A either modulate the diffusion coefficient, or cause a shift in the distribution of barrier heights for escape. These are consistent interpretations, in the sense that lowering of the barrier height for escape results in higher diffusion coefficients and vice versa. Although variation in barrier height (Eq. 3) alone could account for the general shape of lifetime distribution, it is evident that variation in the initial patch size (R0) may have a significant contribution (Eqs. 5 and 7) as well. We thus cannot rule out a combination of both factors, leading to the distribution of lifetimes that we measure.
These results agree with the interpretation that the actin cytoskeleton contributes to the energy barriers and obstacles that determine the diffusion of MHC-I in the membrane. Existence of such dynamic patches of membrane proteins is thus a necessary outcome of anomalous, confined diffusion, and the natural mechanism of protein traffic to and from plasma membrane.
Conclusions
Lifetime of MHC-I clusters on the plasma membrane is controlled by components of the actin cytoskeleton, which act as obstacles to free diffusion: modulation of the obstacle strength, using actin-binding drugs, transiently shifts the distribution of cluster lifetimes in a predictable manner.
The shape of the measured lifetime distribution is explained by a mathematical model assuming a normal distribution of energy barriers to diffusion, in combination with possible contributions from a distribution of the initial dimensions of the MHC-I cluster. The model links between the shape of lifetime distribution and the barrier height for free diffusion, thus reinforcing the notion that the dynamic nature of MHC-I clusters is a necessary outcome of obstructed diffusion and vesicle traffic to the plasma membrane.
Given the biological function of MHC-I (i.e., presentation of cytosolic peptides to inspection of T-cells, and the dynamic nature of presentation), it is possible that modulation of the MHC-I cluster lifetime may modulate the recognition of foreign peptides by T-cells.
Acknowledgments
Support of this research by grant No. 2009345 from the United States-Israel Binational Science Foundation to M.E. and L.A.G. is gratefully acknowledged.
Supporting Material
References
- 1.Singer S.J., Nicolson G.L. The fluid mosaic model of the structure of cell membranes. Science. 1972;175:720–731. doi: 10.1126/science.175.4023.720. [DOI] [PubMed] [Google Scholar]
- 2.Engelman D.M. Membranes are more mosaic than fluid. Nature. 2005;438:578–580. doi: 10.1038/nature04394. [DOI] [PubMed] [Google Scholar]
- 3.Vereb G., Szöllosi J., Damjanovich S. Dynamic, yet structured: the cell membrane three decades after the Singer-Nicolson model. Proc. Natl. Acad. Sci. USA. 2003;100:8053–8058. doi: 10.1073/pnas.1332550100. [DOI] [PMC free article] [PubMed] [Google Scholar]
- 4.Sako Y., Kusumi A. Barriers for lateral diffusion of transferrin receptor in the plasma membrane as characterized by receptor dragging by laser tweezers: fence versus tether. J. Cell Biol. 1995;129:1559–1574. doi: 10.1083/jcb.129.6.1559. [DOI] [PMC free article] [PubMed] [Google Scholar]
- 5.Feder T.J., Brust-Mascher I., Webb W.W. Constrained diffusion or immobile fraction on cell surfaces: a new interpretation. Biophys. J. 1996;70:2767–2773. doi: 10.1016/S0006-3495(96)79846-6. [DOI] [PMC free article] [PubMed] [Google Scholar]
- 6.Edidin M., Stroynowski I. Differences between the lateral organization of conventional and inositol phospholipid-anchored membrane proteins. A further definition of micrometer scale membrane domains. J. Cell Biol. 1991;112:1143–1150. doi: 10.1083/jcb.112.6.1143. [DOI] [PMC free article] [PubMed] [Google Scholar]
- 7.Tsuji A., Kawasaki K., Kusumi A. Regulation of band 3 mobilities in erythrocyte ghost membranes by protein association and cytoskeletal meshwork. Biochemistry. 1988;27:7447–7452. doi: 10.1021/bi00419a041. [DOI] [PubMed] [Google Scholar]
- 8.Kusumi A., Sako Y., Yamamoto M. Confined lateral diffusion of membrane receptors as studied by single particle tracking (nanovid microscopy). Effects of calcium-induced differentiation in cultured epithelial cells. Biophys. J. 1993;65:2021–2040. doi: 10.1016/S0006-3495(93)81253-0. [DOI] [PMC free article] [PubMed] [Google Scholar]
- 9.Hwang J., Gheber L.A., Edidin M. Domains in cell plasma membranes investigated by near-field scanning optical microscopy. Biophys. J. 1998;74:2184–2190. doi: 10.1016/S0006-3495(98)77927-5. [DOI] [PMC free article] [PubMed] [Google Scholar]
- 10.Tang Q., Edidin M.A. Vesicle trafficking and cell surface membrane patchiness. Biophys. J. 2001;81:196–203. doi: 10.1016/S0006-3495(01)75691-3. [DOI] [PMC free article] [PubMed] [Google Scholar]
- 11.Bodnár A., Bacsó Z., Matkó J. Class I HLA oligomerization at the surface of B cells is controlled by exogenous β(2)-microglobulin: implications in activation of cytotoxic T lymphocytes. Int. Immunol. 2003;15:331–339. doi: 10.1093/intimm/dxg042. [DOI] [PubMed] [Google Scholar]
- 12.Kwik J., Boyle S., Edidin M. Membrane cholesterol, lateral mobility, and the phosphatidylinositol 4,5-bisphosphate-dependent organization of cell actin. Proc. Natl. Acad. Sci. USA. 2003;100:13964–13969. doi: 10.1073/pnas.2336102100. [DOI] [PMC free article] [PubMed] [Google Scholar]
- 13.Gheber L.A., Edidin M.A. A model for membrane patchiness: lateral diffusion in the presence of barriers and vesicle traffic. Biophys. J. 1999;77:3163–3175. doi: 10.1016/S0006-3495(99)77147-X. [DOI] [PMC free article] [PubMed] [Google Scholar]
- 14.Lavi Y., Edidin M.A., Gheber L.A. Dynamic patches of membrane proteins. Biophys. J. 2007;93:L35–L37. doi: 10.1529/biophysj.107.111567. [DOI] [PMC free article] [PubMed] [Google Scholar]
- 15.Schmoranzer J., Kreitzer G., Simon S.M. Migrating fibroblasts perform polarized, microtubule-dependent exocytosis towards the leading edge. J. Cell Sci. 2003;116:4513–4519. doi: 10.1242/jcs.00748. [DOI] [PubMed] [Google Scholar]
- 16.Marguet D., Spiliotis E.T., Edidin M. Lateral diffusion of GFP-tagged H2Ld molecules and of GFP-TAP1 reports on the assembly and retention of these molecules in the endoplasmic reticulum. Immunity. 1999;11:231–240. doi: 10.1016/s1074-7613(00)80098-9. [DOI] [PubMed] [Google Scholar]
- 17.Axelrod D. Total internal reflection fluorescence microscopy. Methods Cell Biol. 1989;30:245–270. doi: 10.1016/s0091-679x(08)60982-6. [DOI] [PubMed] [Google Scholar]
- 18.Cooper J.A. Effects of cytochalasin and phalloidin on actin. J. Cell Biol. 1987;105:1473–1478. doi: 10.1083/jcb.105.4.1473. [DOI] [PMC free article] [PubMed] [Google Scholar]
- 19.Yarmola E.G., Somasundaram T., Bubb M.R. Actin-latrunculin A structure and function. Differential modulation of actin-binding protein function by latrunculin A. J. Biol. Chem. 2000;275:28120–28127. doi: 10.1074/jbc.M004253200. [DOI] [PubMed] [Google Scholar]
- 20.Gov N.S. Modeling the size distribution of focal adhesions. Biophys. J. 2006;91:2844–2847. doi: 10.1529/biophysj.106.088484. [DOI] [PMC free article] [PubMed] [Google Scholar]
Associated Data
This section collects any data citations, data availability statements, or supplementary materials included in this article.