

Abstract
Lipid droplets are complex organelles that exhibit highly dynamic behavior in early Drosophila embryo development. Imaging lipid droplet motion provides a robust platform for the investigation of shuttling by kinesin and dynein motors, but methods for imaging are either destructive or deficient in resolution and penetration to study large populations of droplets in an individual embryo. Here we report real-time imaging and quantification of droplet motion in live embryos using a recently developed technique termed “femtosecond-stimulated Raman loss” microscopy. We captured long-duration time-lapse images of the developing embryo, tracked single droplet motion within large populations of droplets, and measured the velocity and turning frequency of each particle at different apical-to-basal depths and stages of development. To determine whether the quantities for speed and turning rate measured for individual droplets are sufficient to predict the population distributions of droplet density, we simulated droplet motion using a velocity-jump model. This model yielded droplet density distributions that agreed well with experimental observations without any model optimization or unknown parameter estimation, demonstrating the sufficiency of a velocity-jump process for droplet trafficking dynamics in blastoderm embryos.
Introduction
Lipid droplets are complex intracellular structures present in a wide range of organisms from microbes to higher plant and animal species (1). Two major components constitute an individual droplet: 1), a central core of neutral lipid; 2), a monolayer of phospholipids associated with intramembranous and surface proteins (2). Lipid droplets have multiple functions in cells and tissues, including: 1), acting as a fat repository; 2), aiding in lipid metabolism and homeostasis; 3), storing thousands of protein types (2–4). Using RNAi (RNA interference) analysis, a large number of genes have been found to be involved in lipid droplet biology (5).
Lipid droplets are highly dynamic organelles (6). One of their typical dynamic characteristics is that they are actively transported by microtubule motors throughout the cytoplasm (6). Lipid-droplet shuttling has been discovered in many distinct cell types ranging from insect embryos to human liver cells (2). This motion of lipid droplets has been proposed to be essential for many cellular processes, including maintenance of lipid homeostasis (2,7), nutrient transport from sites of synthesis to sites of need (2), the exchange of lipids and proteins between distinct cellular compartments (2,8,9), and the protection of cells against toxic lipids and destructive proteins (2,9,10).
Intracellular transport powered by microtubule motors plays a central role in the delivery of proteins, RNAs, and organelles to specific subcellular positions at specific times (11). The mechanisms of transport by molecular motors and their regulators are highly intricate, requiring adaptor proteins, cargo-associated regulators, and various signaling cascades (11). In early Drosophila embryos, lipid droplets undergo bidirectional movements in the apical and basal directions along radially organized microtubules. Such movements are powered by molecular motors of the kinesin and cytoplasmic dynein families (12,13). The apparently random droplet motions coalesce into an overall droplet bulk displacement in the whole embryo (14). To date, several regulators of lipid-droplet motion have been identified, such as Klar, LSD2, Halo, and dynactin (14–17). Drosophila provides an excellent model organism to study lipid-droplet trafficking dynamics and its biological significance in cells and tissues.
It is generally hard to study large populations of droplet motion in vivo due to a lack of adequate imaging techniques. Staining or fluorescent labeling is usually a priority for lipid droplets to be studied by means of microscopic imaging (18). However, labeling often interferes with the normal function of the biomolecules and it may impact the physical and chemical environment in vivo. Previous studies in Drosophila demonstrate how differential interference contrast (DIC) microscopy provides label-free imaging of lipid droplets in vivo, and the imaging results indicated a number of characteristic changes in droplet motion and distributions from syncytial blastoderm through gastrulation (12–16). The primary drawback of DIC is that it is limited to a few droplets at a film and has a shallow penetration depth. Due to this shallow penetration depth, a mechanical embryo compression is needed to reduce the thickness of the embryo, and this external force may affect the cellular structure and kill the embryo (14). Some other previous label-free imaging techniques include second-harmonic generation (SHG) and third-harmonic generation (THG) microscopy (19–21), and it was shown that THG microscopy can monitor the trafficking dynamics of unstained lipid droplets in vivo in early Drosophila embryos (21). THG microscopy shows a higher resolution and a deeper penetration depth compared to traditional DIC microscopy. However, THG does not probe any real vibration of the molecules directly, thus providing limited information about the internal molecular identity (22).
The widely applied coherent anti-Stokes Raman scattering (CARS) microscopy serves as another excellent means for label-free imaging of biological samples, primarily with lipid contrast (23–25). However, there are several limitations with CARS that impede imaging sensitivity and its applicability for imaging in developing embryos, such as nonresonant background, spectral distortion, and nonlinear concentration dependence (26,27). The recent development of stimulated Raman scattering (SRS) microscopy avoids these shortcomings and supersedes CARS microscopy by providing better vibrational contrast and higher sensitivity (28–30). Saar et al. (30) improved the speed of SRS imaging to video rate, which allowed for fast imaging of blood flow. Like CARS, SRS signal is based on the vibrational spectra of biological samples, which contain a vast amount of molecular information. SRS is highly sensitive to lipid-containing structures with CH2 stretching vibration (29,30).
In SRS, two laser beams at the pump and Stokes frequencies coincide temporarily and spatially on the specimen. When the frequency difference of the two beams, which is also known as Raman shift, is tuned to match a molecular vibration of the specimen, an enhancement of the Raman signal is accomplished due to stimulated excitation of vibration transitions (28). Recently, Zhang et al. (31) increased the sensitivity of SRS microscopy by one order of magnitude through femtosecond pulse excitation. In this platform termed “femtosecond stimulated Raman loss” (fSRL) microscopy, most excitation power is contributed by the Stokes beam above 1.0 μm. This configuration allows lower power requirements that ensure minimal photodamage to the sample (31), which is critical for longitudinal imaging of biological processes in live embryos. Moreover, little scattering of the near-infrared excitation beams in fSRL imaging leads to a deep penetration in tissues, providing high imaging fidelity with no artificial compression of the embryo needed.
To quantify intraembryonic lipid-droplet transport, we applied fSRL microscopy to image living Drosophila embryos from syncytial blastoderm through early gastrulation. Our results show that lipid droplets provide the major contrast captured by fSRL imaging of the embryo, which also provided higher resolution and deeper penetration depth than other existing techniques. Using fSRL, long-duration time-lapse images of the embryo in vivo were acquired with minimal photo-damage caused to the embryo, and quantitative analysis of lipid-droplet motion by the tracking of single droplets shows both a time and space dependence for the speed and turning frequency for droplet motion. Based on the tracking results, we investigated a mathematical model for a velocity-jump process to simulate droplet bulk displacement during early embryogenesis and found that a position-dependent velocity-reversing rate of droplet motion was the key regulatory point for the switch of basal accumulation in phase II to apical redistribution in phase III.
Materials and Methods
Drosophila embryo preparation and labeling
The Oregon-R Drosophila strain was used for the imaging experiments. Embryos were collected at different stages from syncytial blastoderm, through cellularization to gastrulation, dechorionated with bleach, and washed with phosphate-buffered saline (PBS). We designed a chamber using a glass-bottomed petri dish (MatTek, Ashland, MA) for sample mounting and imaging (see Fig. S1 in the Supporting Material). Dechorionated embryos were glued to the glass bottom and submerged in PBS. To prevent anoxia, oxygen was continuously supplied to maintain the concentration of dissolved oxygen. The whole imaging process was completed at 25°C. For Nile Red staining, standard protocols were used (14). Blastoderm fly embryos were collected, fixed in 4% paraformaldehyde, and stained for 30−40 min in Nile Red (Sigma Aldrich, St. Louis, MO) working solution at a concentration of 1.0 μg/ml in phosphate-buffered saline/polyvinylpyrrolidone (PBS/PVP), and mounted in PBS/PVP for observation.
fSRL and TPEF microscopy
One Ti-sapphire laser (Chameleon Vision; Coherent, Santa Clara, CA) of 80 MHz with ∼140 fs pulse-width pumps and an optical parametric oscillator (Chameleon Compact; Angewandte Physik & Elektronik, Berlin, Germany), generating the pump and Stokes beams (see Fig. S1). The two beams are collinearly combined and directed into a laser-scanning microscope (FV300; Olympus, Tokyo, Japan). They are then focused into the sample using a water-immersion objective lens (UplanSapo 20× or 60×; Olympus). The forward fSRL signal is collected by an air condenser (N.A. = 0.55, Olympus) and detected by a photodiode (818-BB-40; Newport, Irvine, CA). An acousto-optic modulator (15180-1.06-LTD-GAP; Gooch & Housego, Somerset, UK) is used to manipulate the intensity of the Stokes beam. The two-photon excited fluorescence (TPEF) signal is collected by the same objective and detected using a photomultiplier tube (R3896; Hamamatsu, Bridgewater, NJ). Based on the lipid vibration at ∼2850 cm−1, the pump beam was tuned at ∼832 nm and the Stokes beam was tuned at ∼1089 nm. Laser power was set to be 40 mW and 140 mW for pump and Stokes beams, respectively. Background intensity was obtained from fSRL imaging of the PBS solution, and was subtracted from the total for quantitative observation of droplet net transport.
Single droplet tracking
A detailed introduction to the tracking method can be found elsewhere (32,33). Individual droplet motion in live embryos was measured by tracking them as various Gaussian-like blobs using a code written in Interactive Data Language. The applicable diameter for the tracking of the blobs in an image sequence is between 5 and 20 pixels. We carefully modulated the image pixel sizes for this requirement.
We analyzed individual droplet motion using methods described in Welte et al. (14) and Chen et al. (34). Trajectories of moving droplets were obtained from fSRL image sequences of 128 × 128 pixels at a speed of 4−5 frames/s. The instantaneous velocity was calculated as the displacement divided by the time interval of two adjacent frames. For each recorded trajectory, the motion parallel to the major axis of displacement (determined from a least-squares fitting process) was used to extract droplet kinetic data. Segments of continuous motion (i.e., runs) in either the apical or basal direction were determined based on reversal points (defined as those time points when the droplet reversed direction and thereafter traveled at least 100 nm in the opposite direction). The length, persistence time, and average velocity were measured for each segment, and the combination of all segments in the same direction was used to estimate the mean for each of the three parameters. To evaluate the inherent perturbations from the setup and the data-collecting process, we recorded and measured an image sequence of the positions of a nonmoving droplet fixed on a coverslip. A standard deviation of ∼10 nm was obtained for the position fluctuations, ensuring the precision of our analysis at the subpixel level.
Mean-square displacement (MSD) curves were obtained using overlapping lag-time intervals for identification of the trafficking modes. The MSD was calculated for lag times <3/4 of the total duration of the trace (33,34). The MSD curve was fitted by the quadratic equation (33)
| (1) |
where D is the diffusion coefficient, V is the average velocity, and t is the lag time. Equation 1 characterizes directed motion (Vt)2 with diffusion (4Dt).
Mathematical modeling
All modeling operations were completed using the COMSOL Multiphysics Simulation Software (COMSOL, Burlington, MA) and MATLAB (The MathWorks, Natick, MA). A one-dimensional model with 12 material intervals was used to simulate the apical-basal axis of the embryo cortex. Reflection (no-flux) boundary conditions were applied to both ends, and initial droplet densities were set to 1 for all 12 intervals at the beginning of phase II. Parameters of the velocity and turning rate were obtained from records of motion in the apical-basal direction that is orthogonal to the embryo surface. For each tracked droplet, the average velocity in either the apical or basal direction was calculated, and the turning rate in either direction was generated from the reciprocal of the persistence time of uninterrupted runs.
The reversal points here were defined as those times when the droplet reversed direction and thereafter moved at least 30 nm in the opposite direction. The choice of 30 nm was selected to eliminate the effects of noise and to give a more accurate estimation of the frequency of turning events. Pooled velocities and turning rates in a given direction from all droplet motion records were then used to calculate the mean values. Specifically, velocity and turning rate parameters were extracted from single droplet tracking results at three different zones in the apical-basal direction, centroids of which were ∼15 μm apart (see Fig. S2). The three sets of parameters were assigned to the intervals divided into three groups that correspond with the positions of experimental measurements.
Results
Lipid droplets in Drosophila embryos generate strong fSRL contrast
In early Drosophila embryos, lipid droplets move along radially organized microtubules in a back-and-forth manner, powered alternatively by plus-end (kinesin) and minus-end (cytoplasmic dynein) molecular motors (2). Net transport of lipid droplets in a developing Drosophila early embryo shows three distinct phases: 1), peripheral distribution, 2), basal accumulation (i.e., clearing), and 3), apical redistribution (i.e., clouding) (14).
Consistent with our expectations for lipid-droplet distributions, we captured a strong fSRL signal around the central yolk and adjacent to cell nuclei in embryos at the cellular blastoderm stage (Fig. 1 A). fSRL spectrum of an early Drosophila embryo was recorded and is shown in Fig. 1 B. The fSRL peak resides in the region of 2840−2850 cm−1, which corresponds with that of a lipid composition with CH2 stretching vibration at 2850 cm−1. This demonstrates that the strong fSRL contrast in the embryo represents lipids. We further probed the source of the strong fSRL contrast on the subcellular level and observed that the contrast originates from micrometer-scale particles that perform rapid bidirectional movements apically and basally in the developing embryo. As a control, we used Nile Red to stain fixed embryos at the cellular blastoderm stage and compared the distribution of Nile Red with an fSRL image of the same sample. Nile Red is a conventional fluorescent dye for intracellular lipid structures (18). Simultaneous fSRL and TPEF images showed excellent overlap in fixed embryos, indicating that fSRL is indeed showing the position of lipid droplets and not another off-target molecule (Fig. 1 C).
Figure 1.
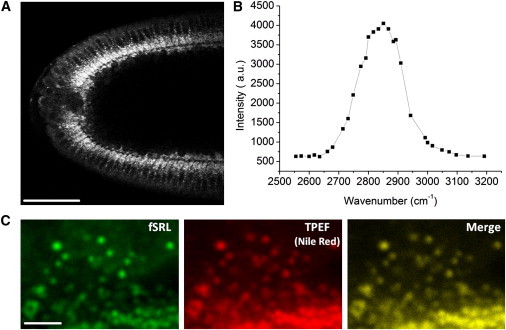
Lipid droplets generate the major contrast in fSRL images of early Drosophila embryos. (A) fSRL image of a Drosophila live embryo at the blastoderm stage shows a strong fSRL signal around the central yolk and adjacent to cell nuclei. Acquisition time, 2 μs per pixel. Bar, 50 μm. (B) fSRL spectrum of an early embryo determined by manually tuning the frequency of Stokes beam. Peak value is ∼2850 cm−1. The pump frequency was fixed at 12,019 cm−1. (C) Nile Red staining of fixed embryos indicates that the fSRL signal (left) results from lipid droplets (middle). Acquisition time, 8 μs per pixel. Bar, 10 μm.
Large-scale long-term imaging of Drosophila early embryogenesis
We recorded fSRL time-lapse sequences for the developing wild-type embryo at the organism level starting from the syncytial blastoderm stage at nuclear cycle 12 through germ-band extension after the completion of gastrulation (see Movie S1 in the Supporting Material). To acquire spatio-temporal dynamics of the global distribution of lipid droplets, we measured the distribution evolution of droplets in the same embryo during early embryogenesis (Fig. 2). In accordance with Welte et al. (14), our results show the uniform distribution of lipid droplets at phase I (Fig. 2, A and E), basal accumulation at phase II (clearing) (Fig. 2, C and F), and apical redistribution at phase III (clouding) (Fig. 2, D and G). Synchronously, yolk materials including yolk vesicles were observed to shrink basally at phase II and achieve drastic distribution changes once gastrulation began (see Movie S1). The strong fSRL contrast from lipid droplets effectively delineated the cell outlines within the embryo (Fig. 1 A and Fig. 2), which could be utilized for rapid imaging of tissue morphological variation in vivo without labeling. Our results clearly exhibited the elongation of nuclei during cellularization and the morphological changes that happened after gastrulation began, including invagination of mesoderm and endoderm primordia, dorsal plate extension, and formation of cephalic and ventral furrows (Fig. 2 D, and see Movie S1).
Figure 2.
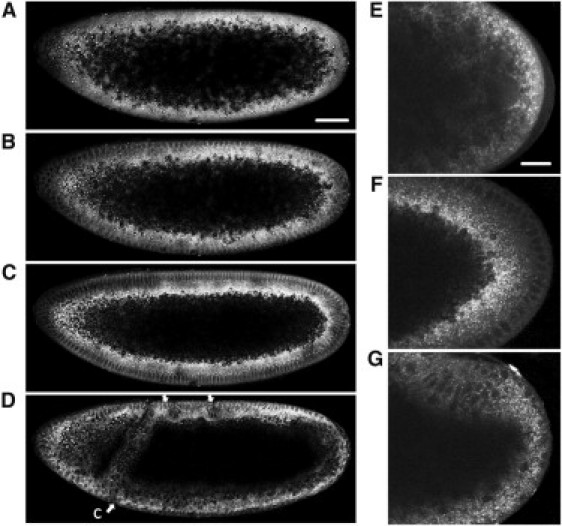
Three distinct phases of droplet global distribution during early embryogenesis. (A−D) fSRL images extracted from a 135-min time-lapse sequence taken for the same embryo. Acquisition time, 4 μs per pixel. Bar, 50 μm. See Movie S1 in the Supporting Material. (A) Phase I before nuclear cycle 13, showing a droplet uniform distribution. (B) Late phase I at the interphase of cycle 13. Droplets were excluded from the most peripheral region. (C) Phase II is midcellularization. Droplets accumulated basally. (D) Phase III is late gastrulation. Basal accumulation was reversed. fSRL contrast delineates morphological movements inside the embryo. (Ventral arrow) Cephalic furrow (cf). (Dorsal arrows) Anterior/posterior transversal furrows. (E−G) fSRL images with increased magnification showing posterior end of the embryo at phase I (E), phase II (F), and phase III (G), respectively. Acquisition time, 2 μs per pixel. Bar, 20 μm.
Tracking the net transport of lipid droplets in vivo
To further study the dynamic evolution of the droplet distribution in the embryo at the tissue level, we increased the magnification and focused on live imaging of the cortical region of the embryo. fSRL generates signals that are linearly proportional to the concentration of targeted molecular species and avoids a nonresonant background, thus allowing straightforward quantification of fat content from in vivo imaging (35).
Lipid-droplet distribution changes during early embryogenesis were quantified by measuring the intensities of the fSRL signal at various positions along the apical-basal axis. In mitosis 12, at the end of phase I, the droplet distribution was broad and relatively uniform in the entire cortex, concentrating in a region 10−25 μm below the embryo surface (Fig. 3 A). When the embryo reached cycle 13, the droplet population at the peripheral-most position moved basally to some extent, causing the distribution peak to change to the zone between 20 and 30 μm beneath the surface (Fig. 3 B). However, there were still a number of lipid droplets left at the cortex around the nuclei (Fig. 3 B) and the droplets remained unchanged during mitosis 13 (Fig. 3 C). Lipid-droplet bidirectional motion slows during syncytial mitosis and abruptly stops during mitosis 13, when cytoplasmic microtubules are disassembled before spindle formation (36) (see Movie S2).
Figure 3.
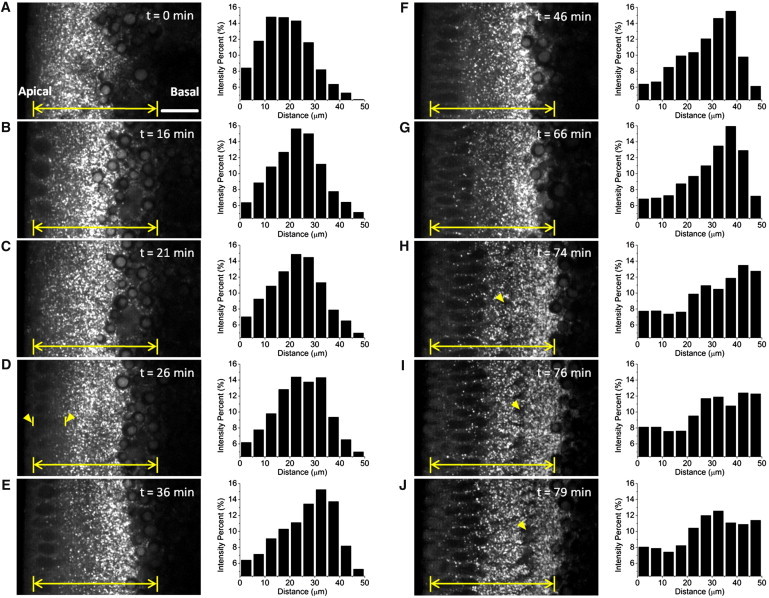
Tracking droplet net transport in vivo. (A−J) fSRL images (left panels) were extracted from a 100-min time-lapse sequence taken for the same area of the same embryo. Acquisition time, 2 μs per pixel. Bar, 15 μm. See Movie S2. (A) Mitosis 12. (B) Interphase 13. (C) Mitosis 13. (D−J) Nuclear cycle 14, showing the major dynamic evolution of lipid-droplet distribution. (D, arrows) Peripheral gap of lipid-droplet exclusion at the beginning of cycle 14. (H−J, arrows) Blastoderm cell membrane displacement during cellularization. (A−J, histograms on the right) Percentage of background-subtracted fSRL intensities at different regions beneath the embryo surface. (Yellow line segments) Region used for the graphs at right.
At the very beginning of cycle 14, when nuclear contours just become distinct, there is a sudden basal contraction of the most peripheral lipid droplets, leading to a droplet-excluding gap behind the nuclei and a relatively uniform distribution of lipid droplets 15−35 μm beneath the embryo surface (Fig. 3 D). The most dramatic clearing of lipid droplets from the cortex occurred during the first 10−15 min of cycle 14, when the peak concentration of lipid droplets reached the edge between the periplasm and the yolk sac (Fig. 3, D and E). After this, the spatial distribution of lipid droplets remained unchanged for the remainder of cycle 14 (Fig. 3, E−G). Lipid droplets were never completely excluded from the cortical region adjacent to and around the nuclei during cycle 14. In fact, at the initiation of membrane invagination, there was a contraction of the yolk sac followed by lipid-droplet redistribution apically by the time membranes passed beyond the tip of the nuclei (Fig. 3, H−J, and see Movie S2). Intriguingly, the expression of halo, a key determinant for directionality of organelle transport in Drosophila embryos, remains high after the beginning of cycle 14 and drops precipitously just after the membranes reach the tip of the nuclei (16). We therefore suggest midmembrane invagination to be the point of transition for lipid-droplet apical redistribution at phase III.
Single particle tracking reveals the behaviors of individual droplets
Fast fSRL imaging of developing early embryos allows single droplet tracking within populations of droplets in vivo to quantitatively characterize droplet intracellular motion (see Movie S3). Here we identified a series of trajectories of trafficking droplets for 10−30 s in duration where individual droplet motion can be quantified (one typical example is shown in Fig. 4). During both phase II and phase III, the majority of moving droplets (up to roughly 80%) behaved fundamentally in a mode of directed motion, characterized by an overall quadratic MSD curve (Fig. 4 F). The velocity of these droplets exhibited frequent changes in direction (Fig. 4 E), consistent with earlier observations that molecular motors dynein and kinesin are associated with the same lipid droplet, alternatively acting to drive droplet motion. The remaining small portion of tracked droplets showed MSD curves with larger fluctuations and irregularities at longer lag times (>1/2 of the total tracking duration), which can be an artifact of the poor statistics inherent at long lag times. We used the quadratic-shaped MSD curves to fit to Eq. 1.
Figure 4.
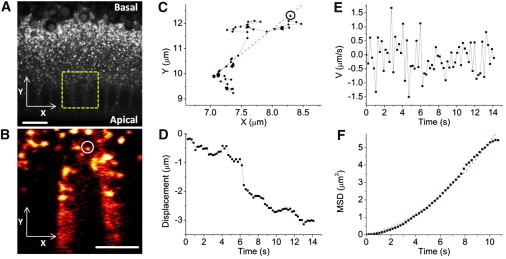
Droplet bidirectional motion characterized by single droplet tracking. (A) A snapshot of the embryo cortex. (Yellow box) Imaged region for droplet tracking. Acquisition time, 2 μs per pixel. Bar, 10 μm. (B) A typical trafficking droplet tracked over 10 s. Acquisition time, 2 μs per pixel (4∼5 frames/s). Bar, 5 μm. See Movie S3. (C) The trajectory of the droplet marked in phase B. (Dashed line) Least-squares linear fitting that characterizes the major axis of displacement. (D) Droplet displacement (along the dashed line in phase C, where segments of continuous runs were extracted). Decreasing ordinate values indicates apically directed motion. (E and F) The instantaneous velocity and MSD curve of the tracked droplet. An overall quadratic shape of the MSD curve corresponds to directed transport. Fitting of this MSD curve to Eq. 1 led to a diffusion coefficient (D) of 0.032 ± 0.003 μm2/s and an average velocity (V) of 0.201 ± 0.041 μm/s.
For phase II, the diffusion coefficients (D) and the average velocities (V) were acquired to be from ∼0.005 to 0.095 μm2/s with a weighted mean of 0.0123 ± 0.0002 μm2/s, and from ∼0.04 to 0.32 μm/s with a weighted mean of 0.072 ± 0.004 μm/s, respectively. For phase III, D and V were from 0.002 to 0.091 μm2/s with mean 0.0102 ± 0.0002 μm2/s, and from 0.04 to 0.41 μm/s with mean 0.132 ± 0.005 μm/s, respectively. We noticed that the variation in diffusion coefficient of the two phases was relatively small, whereas there was a nearly twofold increase of the average velocity from phase II to phase III. Considering the fact that the overall droplet population shifted basally in phase II and redistributed apically in phase III, this divergence in average velocity agrees with the shorter time duration for phase III (∼20 min) compared to phase II (∼50 min).
To quantify the bulk displacement of the droplet population at each developmental stage, we analyzed droplet motion using previously reported methods from Welte et al. (14) (Fig. 4,C and D, and see Materials and Methods). Specifically, droplets that tended to undergo sustained motion with considerable speed variation (peak speed no less than 1.2 μm/s in each direction) were selected for parsing and quantitative analysis. Three statistics about the motion were determined: 1), The persistence time of these segments in either direction. 2), The average distance traveled in either direction for these segments. 3), The mean velocity maintained during these segments (Table 1). Based on these kinetic parameters, we calculated the bulk displacement rate to evaluate the net transport of lipid droplets (Table 2, and see Materials and Methods). Specifically, we quantified droplet motion at the stage when membrane invagination had just passed the basal tip of nuclei. Quantitative results showed no net transport of the droplet population either apically or basally at this stage, which further confirms that midmembrane invagination is the starting point for the phase switch (see Fig. 3, H and I).
Table 1.
Kinetic parameter values of lipid-droplet intracellular motion during early embryogenesis, obtained from single particle tracking analysis
| Stage (n) | Persistence time, s mean ± SE (n) |
Mean run length, nm mean ± SE (n) |
Mean velocity, nm/s mean ± SE (n) |
|||
|---|---|---|---|---|---|---|
| Basal, t+ | Apical, t− | Basal, l+ | Apical, l− | Basal, v+ | Apical, v− | |
| Phase I (n = 2) | 2.73 ± 0.30 (66) | 2.54 ± 0.26 (68) | 855 ± 97 (66) | 972 ± 120 (68) | 290 ± 11 (66) | 358 ± 10 (68) |
| Phase II (n = 2) | 3.38 ± 0.40 (77) | 2.38 ± 0.23 (79) | 1092 ± 117 (77) | 831 ± 89 (79) | 293 ± 7 (77) | 377 ± 4 (79) |
| Phase II∼III∗ (n = 3) | 2.58 ± 0.29 (74) | 2.60 ± 0.30 (73) | 844 ± 111 (74) | 935 ± 100 (73) | 304 ± 8 (74) | 374 ± 5 (73) |
| Phase III (n = 2) | 2.44 ± 0.28 (79) | 2.76 ± 0.34 (81) | 739 ± 100 (79) | 1050 ± 143 (81) | 269 ± 8 (79) | 352 ± 6 (81) |
Phase II∼III represents the stage at cycle 14 when membranes reach ∼20%∼50% beyond the basal tip of nuclei.
Table 2.
Estimated droplet bulk displacement rate, B, calculated from the parameter values in Table 1
| Stage (n = number of embryos) | B, μm /min mean ± SE | Direction |
|---|---|---|
| Phase I (n = 2) | 1.3 ± 1.8 | None |
| Phase II (n = 2) | 2.7 ± 1.5 | Basal |
| Phase II∼III (n = 3) | 1.1 ± 1.7 | None |
| Phase III (n = 2) | 3.6 ± 2.0 | Apical |
Droplet net flux can be mathematically described using a velocity-jump model
Lipid-droplet motion in fly embryos is modulated by a complex regulatory mechanism that is responsible for the spatial distribution changes of the droplet population (15,16). The behavior of an individual droplet can be described by a direction turning rate and a velocity, two parameters needed for transport models based on velocity-jump processes (37,38). To test the feasibility of a mathematical model for velocity-jump processes to predict droplet net transport in phase II and phase III, we measured the mean turning rate and velocity for populations of droplets and used these parameters with no further optimization to model droplet density distributions along the apical-basal axis.
For simplicity, we modeled droplet transport in one space dimension along the apical-basal axis. Suppose that a droplet moves along the apical-basal axis (defined as the x axis) with speed s±(x), and, at random points in time, it reverses direction following a Poisson process with frequencies λ±(x). Let p±(x, t) be the density of droplets at (x, t) moving basally (+) and apically (−). We can generate the following equations describing p±(x, t) (38):
| (2) |
| (3) |
Particle density at (x, t) is p(x, t) ≡ p+(x, t) + p−(x, t), and the particle flux is j ≡ (s+p+ − s−p−) (38). In general, the speed and turning rate are dependent on x and on the travel direction.
To estimate parameters of the velocity and turning rate, we tracked single droplet motion in three individual cortical regions along the apical-basal axis, which generally covered the major part of the cortex (see Materials and Methods and see Fig. S2). No parsing of the droplet motion was carried out here and we only made use of pure apically basally directed velocities and turning rates (see Materials and Methods and see Table S1 in the Supporting Material). Model results based on these parameter values clearly predicted a droplet basal accumulation in phase II and an apical shift in phase III, time spans of which were ∼40 min and ∼15 min, respectively (Fig. 5). The variation in velocity and turning rate of droplet motion along the apical-basal axis turned out to be an essential feature of droplet global transport in phase II but an insignificant factor in phase III (see the Supporting Material).
Figure 5.
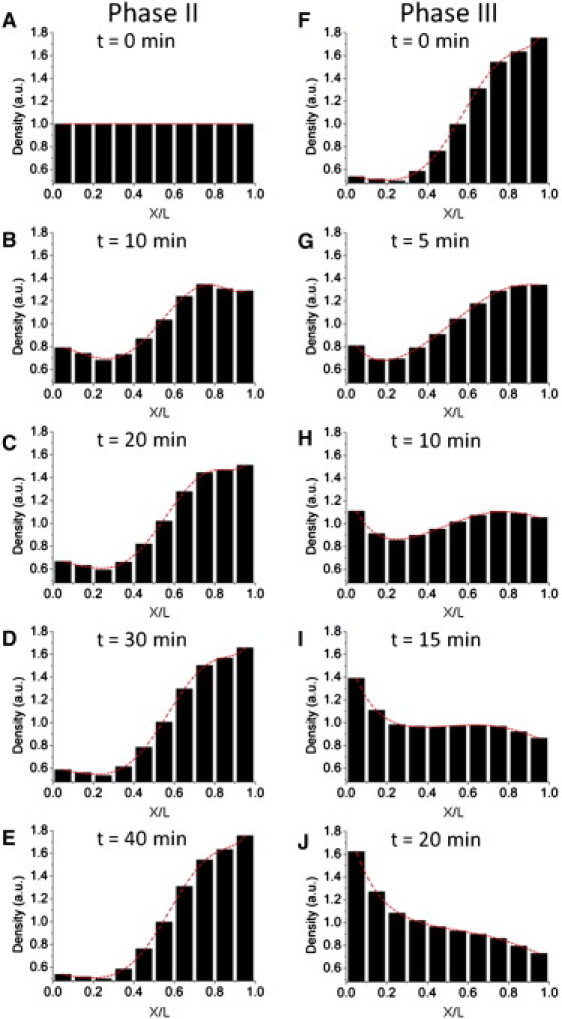
Droplet bulk displacement in the early embryo can be simulated using a velocity-jump model. (A−E) Model results for phase II. (A) Droplet initial distribution is uniform for modeling. (F−J) Model results for phase III. (F) Droplet initial distribution was that in panel E of phase II after 40 min. (Left to right of the abscissa axis) Apical-to-basal direction as in Fig. 3, and its scale is normalized to the width of the embryo cortex L (L = 40 μm).
The simple velocity-jump model produces apical-basal distributions of lipid-droplet density strikingly similar to experimental measurements (compare Fig. 5 to Fig. 3). Specifically, droplet clearing in phase II was initially more drastic in the apical than in the basal regions, and it slowed down after ∼20 min (Fig. 5, A−E). This is in accord with what is indicated in Fig. 3 and the previous report (14). In phase III's simulation, the droplet distribution returned to a nearly uniform distribution in 10∼15 min and continued to shift more apically afterwards (Fig. 5, F−J), consistent with ours and others' observations for the first 20 min of phase III.
The change of droplet distributions from phase II to phase III is found to be primarily determined by the turning rates but not the velocities. Basal turning rates were significantly larger than apical turning rates in phase II, and the apical/basal rates became almost identical in phase III (see Table S1). Velocities in the apical-basal direction of droplet motion did not differ significantly between the two phases, and they were generally higher in the apical than in the basal directions in either phase (see Table S1). We therefore came to a conclusion that the difference in the turning rate is the major determinant of droplet bulk displacement. In phase II, the larger basal turning rate triumphs over the higher apical velocity, thus giving rise to the basal transport of droplets, whereas in phase III, there is no such counteraction and the superiority of the apical velocity dominates droplets' net flux away from the basal region.
Discussion
Efficient detection of lipid droplets using fSRL microscopy
In this work, we used fSRL microscopy for label-free in vivo imaging of lipid-droplet intracellular motion in unstained early Drosophila embryos. fSRL has proven to exhibit high efficiency in label-free live imaging of water, lipids, and proteins in a series of tissue types (28). This technique overcame the major limitation of a nonresonant background that impedes CARS microscopy, and provided an easily interpretable vibrational contrast (28,30). Moreover, fSRL provided a three-dimensional sectioning capability, which was important for its application in imaging cell and tissue behavior (28). Our results demonstrate that lipid droplets can be specifically probed by fSRL microscopy with high sensitivity when pump and Stokes frequencies are properly adjusted to meet the CH2 stretching vibration from lipids. Moreover, the majority of embryos imaged from syncytial blastoderm through gastrulation continued to develop through germ band extension and hatched with no delay in development (see the Supporting Material). This suggests that fSRL causes very limited photodamage or disturbance to the embryo, and provides a noninvasive tool for label-free imaging of Drosophila embryos.
Considering that fSRL signals are linearly proportional to the concentration of targeted molecules, we used a series of fSRL intensity profiles from the lipid C-H vibration to quantitatively study droplet net flux during embryogenesis. These profiles, though background-subtracted, contained fSRL signals from sources other than the lipid droplets, which might be the cytoplasm or some membranous structures. However, the signal intensity of these sources was much smaller and can be considered uniform in the cortex, thus not affecting our quantitative analysis. Moreover, the elongated nuclei that generated a relatively weak fSRL contrast only occupied the most peripheral region of the cortex, leaving negligible effects on the intensity profiles.
While noticing that fSRL has a number of advantages over traditional fluorescent and DIC microscopy, we have to be clear that our image acquisition rate for fSRL was 4−5 frames/s to ensure image quality, which was ∼6-fold slower than that for DIC (14). As a result, we may miss or underestimate some of the reversal points and short-duration runs.
Membrane midinvagination is the switch point from phase II to phase III
Time-lapse fSRL imaging of the embryo cortex indicates that droplet net flux tends to switch from basal accumulation to apical redistribution when membrane invagination reaches 20−50% beyond the tip of nuclei (midinvagination). This finding differs from the previous electron micrographs that showed maximal clearing of lipid droplets by the end of cellularization, with the majority of droplets residing in the yolk sac (14). This divergence may arise from the fact that previous studies using electron microscopy did not examine many distinct time points of embryo development, and our fSRL time-lapse imaging achieves an improved time resolution of droplet net transport while maintaining high image quality.
Using fSRL, individual droplet dynamics were analyzed, providing insight into the switching point in droplet net flux along the apical-basal axis. The net flux leads to basal accumulation of the droplet population until the midpoint of membrane invagination when the flux becomes zero and eventually apically directed. This further confirms membrane midinvagination's importance as the switch point from phase II to phase III. Our finding agrees with a more recent report that also implicated the particularity of the time when membrane invagination extends beyond nuclei (39). This intermediate phase that was named phase IIB appears to coincide with the reversal of droplet net transport (39).
In the blastoderm embryo, droplet motion is important for: 1), transporting nutrients, 2), delivering proteins and lipophilic signals, and 3), exchanging lipids with other cellular structures (e.g., endoplasmic reticulum and endosomes) (2). The apical redistribution of the droplet population before the end of cellularization when membrane invagination seals cortical nuclei may be necessary for nutrient and signal transport from the yolk to the cortex. Intriguingly, expression of one of the central droplet-motion regulators, Halo, was observed to be high during early cycle 14 and vanished precipitously just after the membranes passed beyond the tip of nuclei (16). Halo has been proposed to interfere with minus-end motors, weakening its binding to the core coordination machinery for droplet motion (16). The collapse of Halo expression may explain the switch in direction of droplet net transport during membrane invagination.
A velocity-jump mathematical model links single droplet motion with droplet population distributions
In the velocity-jump model, two parameters regulate the transport properties that predict distributions of particle density: 1), direction turning rate; and 2), particle velocity. The analysis presented here supports the notion that changes in the turning rate dominate droplet distribution changes in the embryo. Even though velocity tended to increase slightly from phase II to phase III throughout the embryo, these changes alone do not significantly alter the distribution of droplet density in the model. In phase II, the larger basal turning rate determined the droplet net flux. In phase III, however, the turning rates for both apical and basal directions were almost equal, and it was the higher apical velocity that eventually redistributed the droplet population apically.
According to the model's prediction, the variation in velocity and turning frequency of droplet motion along the apical-basal axis is an essential feature of droplet basal accumulation during cellularization. This variation may arise from: 1), more irregular distribution of microtubule tracks in basal cortical regions; 2), increased interference from surrounding droplets in basal regions; 3), difference in concentration of droplet motion regulators along the apical-basal axis.
Results of the model largely agree with experimental observations in space and time during the timescale of embryonic development. However, after longer durations, a peak of droplet density formed at the apicalmost regions in phase III (Fig. 5 J), an outcome we did not observe during any of the imaging experiments. More detailed models that account for morphological changes of the embryo cortex, nuclei exclusion of droplets, and other physiology may alleviate this discrepancy. Another limitation of our model stems from the velocity and turning rate calculations. We only measured three sets of velocities and turning rates for each phase at three spatial positions along the apical-basal axis, as opposed to measuring these properties at every spatial position. Even with these limitations, the simple model offered an effective prediction of the trend of droplet net transport in phase II and phase III.
In summary, fSRL provides an efficient and convenient technique for label-free imaging of lipid droplets in early Drosophila embryos. In addition to its application in droplet studies, fSRL may be used to image other lipid-containing structures in Drosophila, similar to what is recently reported using CARS microscopy to image Drosophila fat bodies at larval and pupal stages (40). The continued application of fSRL imaging to investigate intracellular and extracellular processes will improve our quantitative understanding of many mechanisms during development.
Acknowledgments
We thank Dr. M. A. Welte for discussion of results and Dr. T. Hays for critique of the manuscript.
This work was supported by Indiana Clinical and Translational Sciences Institute's Collaboration in Biomedical/Translational Research Pilot Program grant No. RR025761 and Subaward 529626301 of the National Institutes of Health grant No. RO1GMO29123-28.
Contributor Information
Ji-Xin Cheng, Email: jcheng@purdue.edu.
David M. Umulis, Email: dumulis@purdue.edu.
Supporting Material
References
- 1.Murphy D.J. The biogenesis and functions of lipid bodies in animals, plants and microorganisms. Prog. Lipid Res. 2001;40:325–438. doi: 10.1016/s0163-7827(01)00013-3. [DOI] [PubMed] [Google Scholar]
- 2.Welte M.A. Fat on the move: intracellular motion of lipid droplets. Biochem. Soc. Trans. 2009;37:991–996. doi: 10.1042/BST0370991. [DOI] [PubMed] [Google Scholar]
- 3.Brasaemle D.L. Thematic review series: adipocyte biology. The perilipin family of structural lipid droplet proteins: stabilization of lipid droplets and control of lipolysis. J. Lipid Res. 2007;48:2547–2559. doi: 10.1194/jlr.R700014-JLR200. [DOI] [PubMed] [Google Scholar]
- 4.Cermelli S., Guo Y., Welte M.A. The lipid-droplet proteome reveals that droplets are a protein-storage depot. Curr. Biol. 2006;16:1783–1795. doi: 10.1016/j.cub.2006.07.062. [DOI] [PubMed] [Google Scholar]
- 5.Guo Y., Walther T.C., Farese R.V. Functional genomic screen reveals genes involved in lipid-droplet formation and utilization. Nature. 2008;453:657–661. doi: 10.1038/nature06928. [DOI] [PMC free article] [PubMed] [Google Scholar]
- 6.Martin S., Parton R.G. Lipid droplets: a unified view of a dynamic organelle. Nat. Rev. Mol. Cell Biol. 2006;7:373–378. doi: 10.1038/nrm1912. [DOI] [PubMed] [Google Scholar]
- 7.Boström P., Rutberg M., Olofsson S.O. Cytosolic lipid droplets increase in size by microtubule-dependent complex formation. Arterioscler. Thromb. Vasc. Biol. 2005;25:1945–1951. doi: 10.1161/01.ATV.0000179676.41064.d4. [DOI] [PubMed] [Google Scholar]
- 8.Murphy S., Martin S., Parton R.G. Lipid droplet-organelle interactions; sharing the fats. Biochim. Biophys. Acta. 2009;1791:441–447. doi: 10.1016/j.bbalip.2008.07.004. [DOI] [PubMed] [Google Scholar]
- 9.Welte M.A. Proteins under new management: lipid droplets deliver. Trends Cell Biol. 2007;17:363–369. doi: 10.1016/j.tcb.2007.06.004. [DOI] [PubMed] [Google Scholar]
- 10.Listenberger L.L., Han X., Schaffer J.E. Triglyceride accumulation protects against fatty acid-induced lipotoxicity. Proc. Natl. Acad. Sci. USA. 2003;100:3077–3082. doi: 10.1073/pnas.0630588100. [DOI] [PMC free article] [PubMed] [Google Scholar]
- 11.Welte M.A., Gross S.P. Molecular motors: a traffic cop within? HFSP J. 2008;2:178–182. doi: 10.2976/1.2956447. [DOI] [PMC free article] [PubMed] [Google Scholar]
- 12.Gross S.P., Welte M.A., Wieschaus E.F. Dynein-mediated cargo transport in vivo. A switch controls travel distance. J. Cell Biol. 2000;148:945–956. doi: 10.1083/jcb.148.5.945. [DOI] [PMC free article] [PubMed] [Google Scholar]
- 13.Shubeita G.T., Tran S.L., Gross S.P. Consequences of motor copy number on the intracellular transport of kinesin-1-driven lipid droplets. Cell. 2008;135:1098–1107. doi: 10.1016/j.cell.2008.10.021. [DOI] [PMC free article] [PubMed] [Google Scholar]
- 14.Welte M.A., Gross S.P., Wieschaus E.F. Developmental regulation of vesicle transport in Drosophila embryos: forces and kinetics. Cell. 1998;92:547–557. doi: 10.1016/s0092-8674(00)80947-2. [DOI] [PubMed] [Google Scholar]
- 15.Welte M.A., Cermelli S., Gross S.P. Regulation of lipid-droplet transport by the perilipin homolog LSD2. Curr. Biol. 2005;15:1266–1275. doi: 10.1016/j.cub.2005.06.062. [DOI] [PubMed] [Google Scholar]
- 16.Gross S.P., Guo Y., Welte M.A. A determinant for directionality of organelle transport in Drosophila embryos. Curr. Biol. 2003;13:1660–1668. doi: 10.1016/j.cub.2003.08.032. [DOI] [PubMed] [Google Scholar]
- 17.Gross S.P., Welte M.A., Wieschaus E.F. Coordination of opposite-polarity microtubule motors. J. Cell Biol. 2002;156:715–724. doi: 10.1083/jcb.200109047. [DOI] [PMC free article] [PubMed] [Google Scholar]
- 18.Greenspan P., Mayer E.P., Fowler S.D. Nile Red: a selective fluorescent stain for intracellular lipid droplets. J. Cell Biol. 1985;100:965–973. doi: 10.1083/jcb.100.3.965. [DOI] [PMC free article] [PubMed] [Google Scholar]
- 19.Zipfel W.R., Williams R.M., Webb W.W. Live tissue intrinsic emission microscopy using multiphoton-excited native fluorescence and second harmonic generation. Proc. Natl. Acad. Sci. USA. 2003;100:7075–7080. doi: 10.1073/pnas.0832308100. [DOI] [PMC free article] [PubMed] [Google Scholar]
- 20.Olivier N., Luengo-Oroz M.A., Beaurepaire E. Cell lineage reconstruction of early zebrafish embryos using label-free nonlinear microscopy. Science. 2010;329:967–971. doi: 10.1126/science.1189428. [DOI] [PubMed] [Google Scholar]
- 21.Débarre D., Supatto W., Beaurepaire E. Imaging lipid bodies in cells and tissues using third-harmonic generation microscopy. Nat. Methods. 2006;3:47–53. doi: 10.1038/nmeth813. [DOI] [PubMed] [Google Scholar]
- 22.Min W., Freudiger C.W., Xie X.S. Coherent nonlinear optical imaging: beyond fluorescence microscopy. Annu. Rev. Phys. Chem. 2011;62:507–530. doi: 10.1146/annurev.physchem.012809.103512. [DOI] [PMC free article] [PubMed] [Google Scholar]
- 23.Zumbusch A., Holtom G.R., Xie X.S. Three-dimensional vibrational imaging by coherent anti-Stokes Raman scattering. Phys. Rev. Lett. 1999;82:4142–4145. [Google Scholar]
- 24.Evans C.L., Xie X.S. Coherent anti-stokes Raman scattering microscopy: chemical imaging for biology and medicine. Annu. Rev. Anal. Chem. 2008;1:883–909. doi: 10.1146/annurev.anchem.1.031207.112754. [DOI] [PubMed] [Google Scholar]
- 25.Rinia H.A., Burger K.N.J., Müller M. Quantitative label-free imaging of lipid composition and packing of individual cellular lipid droplets using multiplex CARS microscopy. Biophys. J. 2008;95:4908–4914. doi: 10.1529/biophysj.108.137737. [DOI] [PMC free article] [PubMed] [Google Scholar]
- 26.Ganikhanov F., Evans C.L., Xie X.S. High-sensitivity vibrational imaging with frequency modulation coherent anti-Stokes Raman scattering (FM CARS) microscopy. Opt. Lett. 2006;31:1872–1874. doi: 10.1364/ol.31.001872. [DOI] [PubMed] [Google Scholar]
- 27.Li L., Wang H., Cheng J.X. Quantitative coherent anti-Stokes Raman scattering imaging of lipid distribution in coexisting domains. Biophys. J. 2005;89:3480–3490. doi: 10.1529/biophysj.105.065607. [DOI] [PMC free article] [PubMed] [Google Scholar]
- 28.Freudiger C.W., Min W., Xie X.S. Label-free biomedical imaging with high sensitivity by stimulated Raman scattering microscopy. Science. 2008;322:1857–1861. doi: 10.1126/science.1165758. [DOI] [PMC free article] [PubMed] [Google Scholar]
- 29.Freudiger C.W., Min W., Xie X.S. Stimulated Raman scattering microscopy for label-free chemical imaging. Opt. Photonics News. 2009;20:30. [Google Scholar]
- 30.Saar B.G., Freudiger C.W., Xie X.S. Video-rate molecular imaging in vivo with stimulated Raman scattering. Science. 2010;330:1368–1370. doi: 10.1126/science.1197236. [DOI] [PMC free article] [PubMed] [Google Scholar]
- 31.Zhang D., Slipchenko M.N., Cheng J.X. Highly sensitive vibrational imaging by femtosecond pulse stimulated Raman loss. Phys. Chem. Lett. 2011;2:1248–1253. doi: 10.1021/jz200516n. [DOI] [PMC free article] [PubMed] [Google Scholar]
- 32.Crocker J.C., Grier D.G. Methods of digital video microscopy for colloidal studies. J. Colloid Interface Sci. 1996;179:298–310. [Google Scholar]
- 33.Saxton M.J., Jacobson K. Single-particle tracking: applications to membrane dynamics. Annu. Rev. Biophys. Biomol. Struct. 1997;26:373–399. doi: 10.1146/annurev.biophys.26.1.373. [DOI] [PubMed] [Google Scholar]
- 34.Chen H., Yang J., Cheng J.X. Cholesterol level regulates endosome motility via Rab proteins. Biophys. J. 2008;94:1508–1520. doi: 10.1529/biophysj.106.099366. [DOI] [PMC free article] [PubMed] [Google Scholar]
- 35.Wang M.C., Min W., Xie X.S. RNAi screening for fat regulatory genes with SRS microscopy. Nat. Methods. 2011;8:135–138. doi: 10.1038/nmeth.1556. [DOI] [PMC free article] [PubMed] [Google Scholar]
- 36.Foe V.E., Alberts B.M. Studies of nuclear and cytoplasmic behavior during the five mitotic cycles that precede gastrulation in Drosophila embryogenesis. J. Cell Sci. 1983;61:31–70. doi: 10.1242/jcs.61.1.31. [DOI] [PubMed] [Google Scholar]
- 37.Hillen T., Othmer H.G. The diffusion limit of transport equations derived from velocity-jump processes. SIAM J. Appl. Math. 2000;61:751–775. [Google Scholar]
- 38.Othmer H.G., Hillen T. The diffusion limit of transport equations. II. Chemotaxis equations. SIAM J. Appl. Math. 2002;62:1222–1250. [Google Scholar]
- 39.Larsen K.S., Xu J., Gross S.P. BicaudalD actively regulates microtubule motor activity in lipid droplet transport. PLoS ONE. 2008;3:e3763. doi: 10.1371/journal.pone.0003763. [DOI] [PMC free article] [PubMed] [Google Scholar]
- 40.Chien C.H., Chen W.W., Chang T.C. Label-free imaging of Drosophila in vivo by coherent anti-Stokes Raman scattering and two-photon excitation autofluorescence microscopy. J. Biomed. Opt. 2011;16:016012. doi: 10.1117/1.3528642. [DOI] [PubMed] [Google Scholar]
Associated Data
This section collects any data citations, data availability statements, or supplementary materials included in this article.