

Abstract
A growth cone is a motile structure at the tips of axons that is driven by the actin network and guides axon extension. Low actin adhesion to the substrate creates a stationary actin treadmill that allows leading-edge protrusion when adhesion increases in response to guidance cues. We use experimental measurements in the Aplysia bag growth cone to develop and constrain a simple mechanical model of the actin treadmill. We show that actin retrograde flow is primarily generated by myosin contractile forces, but when myosin is inhibited, leading-edge membrane tension increases and drives the flow. By comparing predictions of the model with previous experimental measurements, we demonstrate that lamellipodial and filopodial filament breaking contribute equally to the resistance to the flow. The fully constrained model clarifies the role of actin turnover in the mechanical balance driving the actin treadmill and reproduces the recent experimental observation that inhibition of actin depolymerization causes retrograde flow to slow exponentially with time. We estimate forces in the actin treadmill, and we demonstrate that measured G-actin distributions are consistent with the existence of a forward-directed fluid flow that transports G-actin to the leading edge.
Introduction
Cell migration is a ubiquitous process underlying morphogenesis, wound healing, and cancer, among other biological phenomena (1). Leading-edge protrusion on flat surfaces—the first step in cell crawling—relies on continuous remodeling of a cytoskeletal structure called the lamellipodium (2), a broad and flat network of actin filaments. The lamellipodium is several microns in width, but only ∼0.1–0.2 μm high (3). The actin network, a polarized dendritic array (Fig. 1 A), grows near the lamellipodial leading edge (4). Combined with adhesion to the substrate, this growth moves the leading edge forward in response to guidance cues. Meanwhile, the actin network disassembles throughout the lamellipodium (4), and actin monomer diffusion recycles the monomers to the leading edge (4). Diffusive transport can be assisted by a forward-directed flow of the fluid fraction of the cytoplasm (5). The front-to-rear length of the dynamic lamellipodial network is governed by the dynamics of this biochemical cycle in which actin is being continuously converted from monomer to polymer and back again (6).
Figure 1.
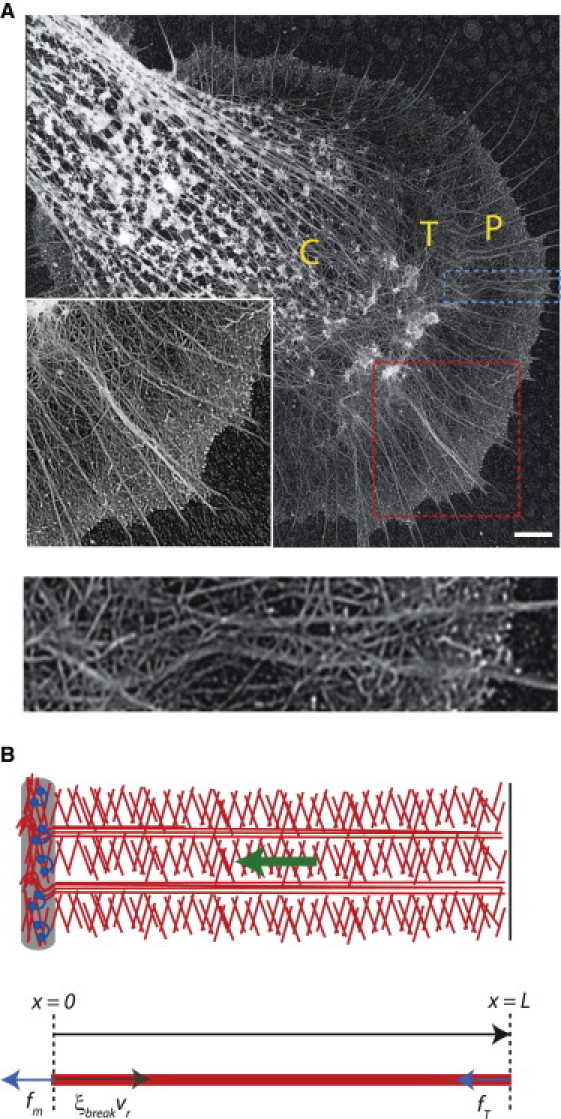
Actin treadmill in the nerve growth cone. (A) Upper, Electron microscopy image of an Aplysia bag cell nerve growth cone, obtained as described in Schaefer et al. (40). (Inset) Higher magnification of P domain (larger box), showing the dendritic network of veil filaments interspersed with filopodial bundles. The central (C) domain, transition (T) zone, and peripheral (P) domain are labeled. Scale bar, 3.5 μm. Lower, Higher magnitude of quasi-1D slice of P domain (smaller box in upper image), to illustrate a representative region of interest for the 1D model illustrated in B. (B) Upper, Schematic of the actin treadmill components: actin filaments (center), leading edge (right), and T zone and myosin (left). The actin network undergoes retrograde flow (green arrow). Lower, balance of forces in the 1D model for the P-domain actin network. The coordinate x represents the distance from the boundary between the T zone and P domain, with x = L corresponding to the leading edge. The active forces driving retrograde flow are membrane tension, fT, and myosin contraction, fm (arrows pointing to the left). The effective drag force opposing retrograde flow (arrow pointing to the right) arises from the necessity to disassemble the actin network at the T zone.
Growing actin filaments push forward on the membrane enveloping the leading edge, resulting in membrane tension (7). The membrane tension slows actin polymerization by pushing back on growing filaments (8–10).When adhesion to the substrate is weak or absent, membrane tension pushing back on the filaments also generates retrograde flow of the actin network (11–14). In some cells (including keratocytes and nerve growth cones), myosin II (which we refer to simply as myosin) also contributes to retrograde flow in the lamellipodium by contracting the actin network and disassembling it at the rear (11,15–17). This retrograde flow, balanced by leading-edge actin polymerization (4) and depolymerization throughout the network (18), creates a stationary lamellipodial treadmill. According to the adhesion clutch hypothesis (19–21), increased adhesion attenuates the retrograde flow, so that the leading-edge actin polymerization is not cancelled by the flow anymore, but rather produces net protrusion and resulting cell motility.
Mechanical components of the actin treadmill have been identified and many of their interactions characterized (22). This lays the groundwork for the challenging task of developing a quantitative understanding of the relative contributions of myosin, leading-edge tension, and actin turnover to the balance of forces underlying the treadmill. We seek to address this challenge in the context of the nerve growth cone, a sensory motile structure that guides axon growth (23). A growth cone is composed of two regions (22), a central (C) domain filled with organelles and microtubules and a peripheral (P) domain (Fig. 1 A). The P domain is composed of a fine veil network of actin filaments interspersed with tightly packed parallel actin bundles called filopodia (24) (Fig. 1 A). The P-domain actin network undergoes dynamic treadmilling, similar to the lamellipodial region of other motile cells. The boundary between the peripheral and central domains of the growth cone is known as the transition (T) zone (Fig. 1 A). Retrograde flow of veil and filopodial actin in the P domain slows dramatically when it reaches the T zone (25), perhaps in part because the microtubules and vesicles in the central domain create a physical barrier to continued flow. Although uniform veil F-actin depolymerization throughout the P domain produces a lower network density at the T zone than at the leading edge (26), the remaining actin network must be disassembled at the T zone to allow recycling of actin and continuous treadmilling.
Here, we develop a quantitative mechanical model of the actin treadmill in the P domain of nerve growth cones. Aplysia bag cell neurons are a convenient model system for understanding the mechanics of the steady-state lamellipodial treadmill, because when they are plated on poly-L-lysine-coated coverslips (17), adhesion of actin to the substrate is very weak, making the cones stationary with a rapidly treadmilling P domain. It is useful to analyze a system with rapidly treadmilling actin and negligible adhesion, because mechanical properties of adhesions are often complex (14,27) and the treadmill has to be understood and calibrated before attempting to quantify the adhesion clutch coupled with actin dynamics. Another advantage of this model system is the abundance of quantitative data (26,28,29), which offer the rare opportunity not only to fully constrain the model using part of the data but also to test the model predictions against the rest of the data within a single experimental system. The actin network components and characteristics are conserved across various cell types (2), and we expect that a growth cone model will also be relevant to other types of cells. Previous models of growth cone motility have focused primarily on chemical guidance (30–33), and one early model explored the mechanism for traction force generation (34). In contrast, the model presented here is designed to investigate the mechanical properties of the growth-cone lamellipodial treadmill. We model the P-domain actin array and use recent experiments in the growth cone to constrain the model and determine the balance of forces, movements, and actin turnover in the P domain.
A key outcome of the model is that the actin network rapidly adjusts to mechanical perturbations by transitioning into a new steady state with different P-domain width and retrograde flow speed, an adaptability that may contribute to robust growth-cone motility in varying biological conditions. We also determine numerical values for the myosin contractile stress and membrane tension force driving retrograde flow, and suggest that veil and filopodial filament breaking contribute equally to the resistance to retrograde flow. The model predicts exponential slowing of retrograde flow if depolymerization is inhibited, in good numerical agreement with experimental measurements (26). Finally, we use measurements of G-actin spatial profiles in Van Goor et al. (26) to estimate the forward-directed fluid flow in the P domain, and we find that it is on the same order of magnitude as actin retrograde flow.
Materials and Methods
One-dimensional model of the actin treadmill
We consider the P-domain actin network, which assembles at the leading edge and disassembles at a constant rate while undergoing retrograde flow. Actin retrograde flow in an Aplysia bag growth cone is in the radial direction (25), and considering a segment of the P domain a few microns wide allows a one-dimensional (1D) description (Fig. 1 A). We assume that the flow is driven by myosin motors pulling within the T zone and membrane tension pushing from the leading edge and that it is resisted by an effective drag force that depends on the density of filaments at the T zone. The P-domain width and retrograde flow speed are dynamic variables that depend on the mechanical properties of the growth cone and the balance of forces on the actin network (Fig. 1 B).
Below, we outline the biological assumptions and develop the mathematical details of the model.
Kinematics
The speed of protrusion in the lab coordinate system, vcell, is
| (1) |
where vg is the actin growth rate and vr is the retrograde flow rate. In the stationary P domain, vcell = 0 and vg = vr. The model illustrated in Fig. 1 B is based on the following force-speed relations.
Actin growth rate
A few recent studies have reported direct measurements of membrane tension in epithelial (35) and neutrophil (36) motile cells in the tens of pN range, as well as a lower tension in nerve growth cones (37), and have suggested that this tension slows actin growth. We assume that the leading-edge membrane is under tension and that the tension force/μm of the leading edge, fT, reduces the polymerization speed according to the force-velocity relation
| (2) |
where fs is the stall force/μm and is the free polymerization speed. Measurements (8,10) and theory (9) have confirmed the validity of Eq. 2 and have yielded the parameter ω > 1, such that the velocity is insensitive to tension at low loads. We assume that the membrane tension is proportional to the P-domain width rather than to the whole growth cone area, based on the observations discussed in detail in the Supporting Material.
Retrograde flow rate
Our main hypothesis is that resistance to buckling and breaking filaments in the T zone creates a drag opposing the myosin pulling, fm, and membrane pushing, fT, forces on the network. The balance of these three forces determines the retrograde flow. We suggest that the retrograde flow speed is determined by the force balance (Fig. 1 B),
| (3) |
Four assumptions underlie Eq. 3: 1), The veil-filopodia network deforms very little, so that no resistance to the retrograde flow comes from compression or shear in the front few microns of the network, and the forces pulling the network at the rear and pushing it at the front simply add. Data and previous modeling indicate that there is a small amount of compression and shear in the lamellipodium of other cells (38,39). However, there is little gradient in the symmetric retrograde flow speed from the growth cone leading edge to the T zone (26), suggesting that compression and shear can be neglected. 2), The adhesion force is negligible, which allows us to isolate the dynamics of the stationary treadmill from potentially complicated adhesion dynamics. 3), We treat myosin contractility as a constant external force, fm (per unit edge length), acting on the actin network in the P domain, based on the assumption (supported by the observation in Medeiros et al. (28)) that myosin is localized in the T zone and pulls the actin network inward. 4), Electron microscopy shows that the filaments and bundles bend, buckle, and break in the T zone (40) (Fig. 1 A), and we assume that this breaking force resisting the network flow is viscous-like in proportion to the flow rate (see Supporting Material for physical reasoning). The parameter ξbreak characterizes the resistance to flow associated with breaking actin filaments at the T zone.
We assume, and justify below by comparison with experiment, that ξbreak is proportional to the actin-filament density remaining at the T zone after partial network disassembly in the P domain, and that veil and filopodial filaments contribute equally to the force, which leads to the equation
| (4) |
Here the parameter Fbreak is proportional to the breaking force/filament, fbreak, and af and al are the filopodial and veil filament densities, respectively, at the boundary between the P domain and the T zone.
Actin disassembly
Based on experimental data (26), we assume a constant net rate, γ, of the veil filament network disassembly, which yields the following equation for the veil actin density:
| (5) |
We do not model the underlying molecular mechanism of network disassembly here. The steady-state veil actin distribution for the stationary treadmill is then
| (6) |
Here, x is the anterior-posterior coordinate; x = 0 refers to the T zone and x = L corresponds to the leading edge of the P domain (Fig. 1 B). In experiments, the observed distance between the T zone and the leading edge, L, depends on mechanical properties of the actin treadmill components; for example, reduced myosin density inhibits actin disassembly, producing a larger P domain (28). Therefore, L is a dynamic variable of our model. Parameter a0 characterizes a constant density of the veil actin filaments at the leading edge (number/μm). Using the same formulation for the filopodial actin density, afil(x), the total actin density in the P domain is given by
| (7) |
where af is the leading-edge filopodial density. Filopodial bundles have significantly slower turnover rates (estimated half-life ∼25 min) than veil F-actin (0.5–3 min) (41). The observed actin flow in the growth cone is such that a filament travels from the front to the T zone in just 1–3 min, allowing us to approximate the actin density along filopodia as constant from front to rear. This means that filopodia will not turn over significantly and must be recycled by other means, most likely by being mechanically broken.
G-actin spatial distribution
The G-actin concentration can be found from equations describing the balance of F- and G-actin, governed by disassembly and transport processes. The equation for the veil (lamellipodial) F-actin concentration, , has the same form as Eq. 5, , and has the same solution as Eq. 6 ( and Fl simply have different dimensions). The total F-actin density distribution in the steady state is then given by . The equation for the G-actin concentration, G, has the form
| (8) |
Here, the first term on the right-hand side corresponds to the net local source of G-actin due to lamellipodial F-actin disassembly, and we neglect the contribution of the filopodia. The second term describes the hypothetical flow of the fluid fraction of cytoplasm forward with speed . Such flow can be generated by myosin contraction at the rear and membrane permeability at the front, as observed in Keren et al. (5). The third term describes actin monomer diffusion. The boundary conditions at the leading edge (x = L) are that there is a finite G-actin concentration there, , necessary to maintain the protrusion with the observed speed, and that the outflux of the G-actin is equal to the influx of the F-actin: (all actin monomers assembling onto the filament tips at the front become F-actin), similar to Lan and Papoian (42). In this simple model, we have omitted separation of the G-actin pool into fractions characterized by binding with various proteins. More detailed models have been investigated (7,18), but qualitatively, the result described below regarding the gradient of the total G-actin is insensitive to these details. Model equations were solved as described in the Supporting Material.
Experimental constraints on the model
The actin treadmill model described by Eqs. 1–7 can be fully constrained by comparing model predictions with results from a set of experiments with the Aplysia bag nerve growth cone reported in three studies (26,28,29) in which P-domain width and retrograde flow speed were measured under several drug-treatment conditions (Fig. 2 and Table S1): 1), control conditions; 2), actin polymerization inhibited by cytochalasin B; 3), filopodia removed by treatment with low cytochalasin B; 4), myosin inhibited by blebbistatin + actin polymerization inhibited by cytochalasin B; 5), myosin contractile forces inhibited by blebbistatin; 6), actin depolymerization inhibited by jasplakinolide; and 7), actin depolymerization inhibited by jasplakinolide in cones pretreated with blebbistatin. We discuss the respective experimental results in the Supporting Material. Note that all of the experiments we consider were performed on the same experimental system, allowing us to constrain the model in a self-consistent way.
Figure 2.
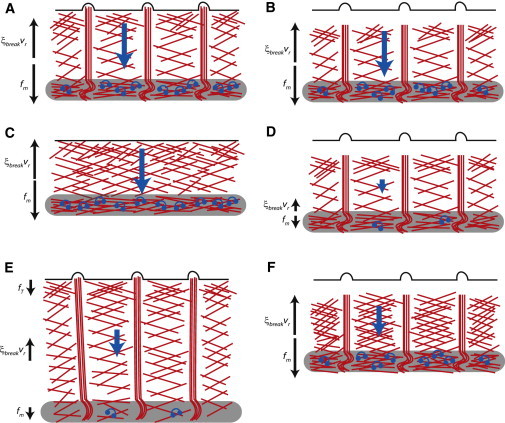
Schematics of growth-cone experiments used to constrain and test the model. (A) Under control conditions, myosin pulling is balanced by the actin breaking force. (B) When the leading-edge polymerization is inhibited by cytochalasin B, the force balance does not change. (C) When filopodia are removed with a low concentration of cytochalasin B, the force balance and flow do not change but the P domain shortens. (D) Inhibition of both polymerization (by cytochalasin B) and myosin (by blebbistatin) lowers both pulling and resistive forces and actin flow. (E) When myosin is inhibited by blebbistatin, the P domain widens and the remaining actin flow is driven by a combination of leading-edge tension and weakened myosin contractile force. (F) Inhibition of actin depolymerization by jasplakinolide increases the resistance of the actin network and slows the actin flow.
Results
Calibrating the model: roles of filopodia, myosin force, and membrane tension
Veil and filopodial filament breaking provides mechanical resistance to retrograde flow
A major assumption of the model is that there is a certain breaking force per actin filament at the T zone, and that this breaking force is the same for veil and filopodial filaments. We further assume that the effective drag force opposing retrograde actin flow is given by the amount of force required to break all the filaments. We can test these assumptions by comparing the predictions of the model with experimental measurements of the retrograde flow and P-domain width in the control case and when filopodia are absent (29). When filopodia were removed by treating the growth cone with low levels of cytochalasin B, the velocity of retrograde flow was unchanged from the control case, but the P-domain width decreased. Assuming that the myosin force, fm, does not change after filopodia removal, we can infer that the effective drag, ξbreak = fm/vr, is also unchanged. In other words, the location of the transition zone is determined by the distance from the leading edge at which F-actin density is low enough for myosin contractile forces to effectively break down the network; when filopodia are removed and no longer contribute to the F-actin density distribution, the P domain narrows such that the F-actin density at the T zone remains the same for a fixed myosin density. Setting the expression for ξbreak (Eqs. 4 and 7) under control conditions equal to the expression for the case without filopodia, we establish a relationship between the leading-edge veil and filopodial densities:
| (9) |
where L, vr, and γ are the control values for the P domain width, retrograde flow, and veil depolymerization rate, and Lnofil is the P-domain width after filopodial removal (Fig. S1 A). Measured values for these parameters (Table S2) allow us to estimate the right-hand side of Eq. 9, yielding af/a0 ≈ 0.08.
This prediction is consistent with experimental estimates of veil and filopodial actin filament densities: EM images of a growth-cone P domain show ∼20 filopodial bundles for every 30 μm in width along the leading edge (43). If each filopodial bundle is comprised of ≈25 individual filaments (44), the filopodial filament density is af ≈ 15/μm. Veil filament density is similar to the lamellipodial density of barbed ends at the leading edge of epithelial cells, which is of the order of a0 ≈ 200/μm (3,7), so af/a0 ≈ 0.075. The consistency between these measurements and the prediction of Eq. 9 supports the model assumption that filopodial and veil actin contribute equally to retrograde flow resistance.
The myosin contractile force, fm, exerted on the network is equal to the force/filament, fbreak, times the actin-filament density at the transition domain. Using experimentally measured values for P-domain width and retrograde flow speed (Table S1) and the leading-edge veil and filopodial densities (Table S2), and a theoretical estimate for fbreak (Table S2), we calculate fm = fbreak(af + a0exp(−γL/vr)) ≈ 1 nN/μm. A single myosin motor domain exerts forces on the order of 1 pN, suggesting that there are ∼1000 motors/μm exerting contractile force in the P domain, consistent with other cell data (45,46). According to our assumption that buckled filaments in the T zone exert an equal and opposite effective drag force on the P-domain network, the effective drag coefficient opposing retrograde flow under control conditions is ξbreak = fm/vr ≈ 170 pN × min/μm2.
P-domain width adapts to mechanical perturbations to maintain a balance of forces
When leading-edge polymerization and myosin forces are both inhibited (after treating growth cones with cytochalasin B and blebbistatin, the P-domain leading edge retreats from the membrane, nullifying potential membrane tension), the remaining retrograde flow is ≈20% of the control value (28). This observation suggests that the residual myosin forces under blebbistatin treatment are ≈20% of fm under control conditions, so . When growth cones are treated with blebbistatin alone, inhibiting myosin without interfering with actin polymerization, the retrograde flow, , is ≈50% of the control value and the P-domain width expands by ≈80% relative to control (28). In this case, the remaining retrograde flow is higher than what would be predicted if retrograde flow were still driven by myosin forces alone. The additional retrograde flow can be explained by two factors: reduced resistance to flow, because a larger P-domain width decreases the actin density at the boundary between the P domain and the T zone (Eq. 7), and hypothetical leading-edge tension that arises due to the expansion of the P-domain width. Indeed, cell protrusion requires membrane delivery to the front against a tension gradient (47) and is associated with increasing membrane tension (35). Using the P-domain width measurement Lb ≈ 13 μm under blebbistatin conditions (28), we can estimate the effective drag coefficient for blebbistatin-treated cells, (Eqs. 4 and 7), and find that the leading-edge tension, , in this case is . Using the steady-state condition for the blebbistatin-treated cells , we can determine the actin-network stall force, fs. According to the load-velocity relationship for actin-network polymerization (Eq. 2), (Fig. S1 B), where we have used ω = 6 based on experimental measurements (10). This stall force is lower than that measured for motile fish keratocyte cells (∼400 pN/μm) (8), but the order of magnitude is the same.
These results illustrate a key feature of the actin-network treadmill: the steady-state P-domain width adapts to maintain a balance of active forces (myosin and tension) and passive forces (resistance to filament breaking). Under control conditions, myosin forces alone drive retrograde flow quickly enough to keep up with leading-edge polymerization, thus alleviating leading-edge membrane tension. In this case, the P-domain width is determined by the distance from the leading edge at which the actin-network density provides enough resistance to balance the myosin forces driving the flow. When myosin is inhibited, this initially produces an imbalance between the leading-edge polymerization and the reduced retrograde flow speed. Initial increase of the P-domain width creates membrane tension, which in turn increases retrograde flow speed. The new steady-state treadmill is achieved when the P domain has expanded enough for the combination of membrane tension and remaining myosin forces to balance the passive force associated with filament breaking at the T zone. Our calculations suggest that myosin contractile forces still contribute significantly to the treadmill dynamics after blebbistatin treatment (, compared with ). This dynamic transition from the control steady-state treadmill to the steady-state treadmill under blebbistatin conditions is illustrated with numerical calculations based on Eqs. 1–7 (Fig. 3). Note that the values of fs and ω determine how quickly the system evolves to a new steady state, but do not affect the values of the steady-state retrograde flow speed or P-domain width (Fig. S2). The constrained values of the model parameters are summarized in Table S2. The model calibration, and the resulting qualitative insights, are relatively robust to variation in the measured values of vr and L that can be expected from one growth cone to the next (Supporting Material).
Figure 3.
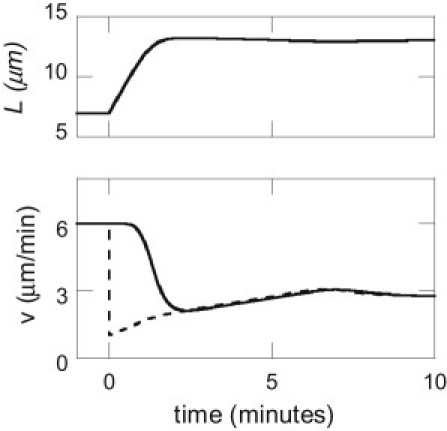
P-domain width adapts to mechanical perturbations to maintain treadmill. Numerical calculation of the P-domain width, L (upper), polymerization speed, vg (lower, solid line), and retrograde flow speed, vr (lower, dashed line), before and after blebbistatin treatment (at time t = 0), illustrating the transition to a new steady-state treadmill. Using calibrated values of the system parameters, the model reproduces experimental measurements of vr and L after blebbistatin treatment. Note that the steady-state values of L and vr are independent of the polymerization load-velocity parameter ω (Fig. S2).
Testing the model: role of actin turnover
F-actin disassembly throughout the P domain lowers effective drag force at the transition zone
Now that the F-actin treadmill model is fully constrained, with no remaining free parameters, additional experiments can be used to test the model assumptions. In particular, we consider experiments in which the role of actin turnover in P-domain dynamics was explored (26).
When leading-edge polymerization in the growth cone is inhibited by application of cytochalasin B, ongoing retrograde flow at a constant speed causes the network to retreat from the leading edge (28). We can simulate this experiment using reaction drift (Eq. 5) for veil actin density, al(t), in combination with the time-dependent retrograde flow speed, (Eqs. 3 and 4), where vr and L are the values measured under control conditions. In principle, this expression could predict the retrograde flow rate varying with time, because the veil actin density at the T zone could vary transiently. However, when we begin with the steady-state actin-density distribution in control (Eq. 7) as the initial condition, and then remove the boundary condition of constant leading-edge density, a0 + af, allowing the density distribution to evolve, we find that the resulting rate of retrograde flow balances exactly with the rate of depolymerization, such that the actin density at the T domain (x = 0) remains constant (Fig. 4 A). For this reason, the retrograde flow speed does not change, in agreement with the experimental observation.
Figure 4.
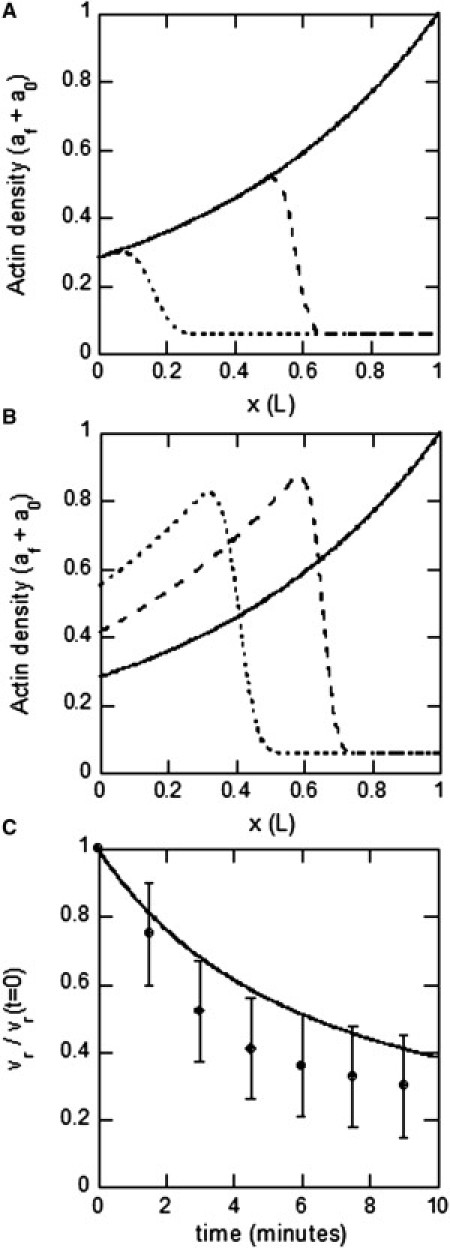
Model testing: role of actin turnover. (A) Actin density distribution calculated from Eq. 6 at several times after treatment with cytochalasin B, inhibiting leading-edge polymerization (t = 0, solid line; t = 3 min, dashed line; t = 6 min, dotted line). Because the actin density at the transition domain remains constant, the resulting vr is also constant. (B) Same as A, but with a lower depolymerization rate, γJ, corresponding to the case of jasplakinolide-treated growth cones. In this case, the actin density at the transition domain increases with time due to the slower rate of depolymerization in the network as it moves rearward. (C) Retrograde flow versus time after jasplakinolide treatment, resulting from the actin density calculations in B (solid line) and experimental measurements (data points).
On the other hand, when actin depolymerization throughout the P domain is inhibited by treating a growth cone with jasplakinolide (26), the pool of available G-actin is depleted, which essentially freezes the network actin turnover. As a result, the network is cleared from the P domain by continued myosin pulling at a retrograde flow speed that decreases exponentially with time (26). Fluorescent images and electron micrographs illustrate a buildup of actin filaments in the transition zone coincident with retrograde flow deceleration. We simulate this experiment by numerically calculating the time-dependent actin density distribution in the manner described in the previous paragraph, but this time using the smaller depolymerization rate, γJ, measured under jasplakinolide conditions (Table S2). In this case, the balance between depolymerization and retrograde flow rates is no longer maintained, and the actin density at the T zone increases with time, in agreement with the experimental observation (Fig. 4 B). This in turn causes retrograde flow speed to decrease exponentially with time, in good numerical agreement with the experimental data (Fig. 4 C). In these two cases, the model with no tunable parameters successfully reproduces experimentally observed behavior and illustrates the role of actin turnover in maintaining the balance of forces in the actin treadmill. This supports the assumption that retrograde flow is opposed by an effective drag force associated with actin filament disassembly at the T zone, and illustrates that constant depolymerization throughout the P domain is necessary to maintain a balance of forces on the actin network.
The decay rate of the retrograde flow speed after jasplakinolide treatment, relative to the initial speed, is only sensitive to the actin depolymerization parameters γ and γJ and does not depend on the initial values of vr and L. For instance, a lower initial value of vr produces a steeper initial actin-density gradient (Eq. 6), which in turn causes the T-domain actin density to increase more quickly after jasplakinolide treatment. However, the retrograde flow balances with the actin gradient so that the T-domain actin density changes by the same ratio for a given time interval. For this reason, vr(t)/vr(t = 0) is independent of the initial value of vr. Indeed, growth cones pretreated with blebbistatin (which alters the steady-state vr and L but has no significant effect on γ and γJ (26)) exhibit nearly the same retrograde flow decay rate after jasplakinolide treatment as the control cones (26), in agreement with this model prediction. For the same reason, the model predicts that vr(t)/vr(t = 0) is independent of the veil actin filament density at the leading edge, which decreases after jasplakinolide treatment (26).
Model predictions: role of G-actin concentration in treadmill and mechanism of G-actin recycling
P-domain width and retrograde flow are sensitive to leading-edge G-actin concentration
Now that the F-actin treadmill model (Eqs. 1–7) has been constrained and tested by published experimental data, we can use the calibrated model to illuminate the role of the G-actin distribution in the treadmill dynamics, and explore a hypothetical mechanism for recycling of G-actin to the leading edge. Note that our previous calculations of physical parameters for the F-actin treadmill do not depend in a detailed way on the G-actin distribution according to our assumptions that polymerization takes place primarily at the leading edge, and depolymerization is uniform throughout the P domain. However, we expect that the rate of actin polymerization will depend on the pool of available G-actin, and we assume for simplicity that the polymerization rate under zero load, v0, is directly proportional to the leading-edge G-actin concentration.
To address the question of how the treadmill dynamics depends on the available pool of G-actin, we begin by considering what would happen if the level of G-actin (and thus the unloaded actin polymerization rate v0) in the stationary growth cone were suddenly increased.
As discussed previously, under control conditions the membrane is not under tension (fT = 0), and thus, we have vg = v0 = vr = fm/ξbreak. If the unloaded polymerization speed is suddenly increased by a factor α, the initial imbalance between polymerization speed and retrograde flow speed will cause P-domain expansion, which produces leading-edge membrane tension (fT > 0). The leading-edge tension will increase the retrograde flow and decrease the polymerization speed until a new steady state is reached. In the Supporting Material, we find the relationship between the factor α, by which v0 was increased, and the resulting steady-state P-domain width . Numerical calculations show that if the G-actin concentration is at least doubled, the P-domain width will approximately double to , producing steady-state membrane tension on the order of fT ∼ 100 pN/μm (Fig. 5 A). The resulting steady-state retrograde flow is ∼ 7–8 μm/min (Fig. 5 B), an increase from the control value due to the added tension force on the network and the reduced resistance to flow associated with breaking forces (ξbreak decreases with because actin has more time to depolymerize before reaching the T zone).
Figure 5.
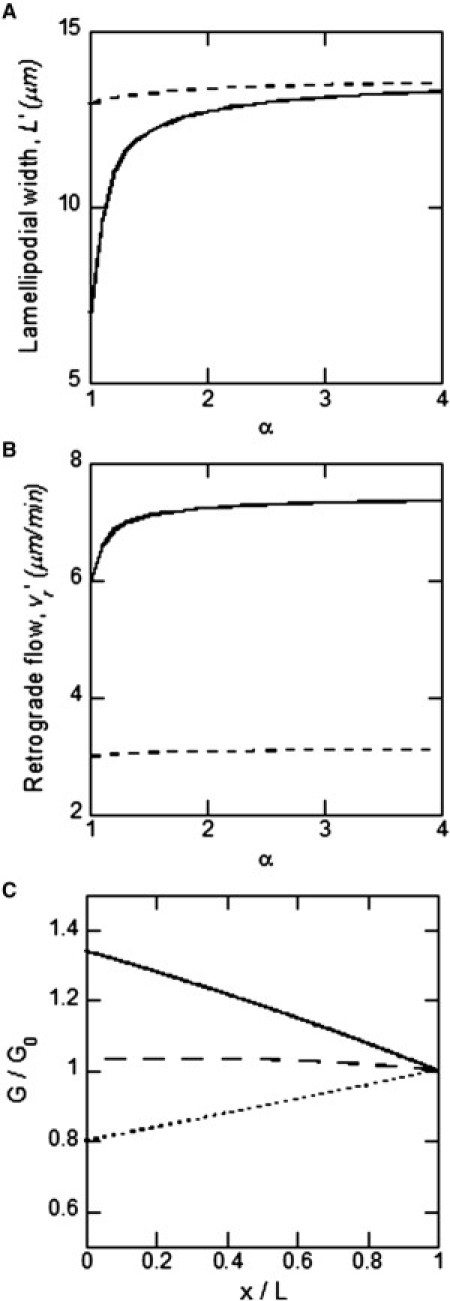
Model prediction for G-actin increase. (A) P-domain width as a function of G-actin increase factor α for control conditions (solid line) and for blebbistatin-treated growth cones (dashed line), based on expressions derived in the Supporting Material. (B) Retrograde flow rate versus α for the same conditions as in A. (C) G-actin spatial profiles (normalized by G0) predicted by Eq. 11 for = 0 μm/s (dotted line), 0.15 μm/s (dashed line), 0.3 μm/s (solid line). We used parameters L, γ, and vr measured in Van Goor et al. (26), D = 5 μm2/s (54), and the ratio = 2 (55).
We also consider a second hypothetical experiment in which a blebbistatin-treated growth cone is subjected to a sudden increase in G-actin concentration. The result, in the Supporting Material, shows that in this case, the steady-state P-domain width and retrograde flow speed are relatively insensitive to increase in G-actin concentration (Fig. 5, A and B). This is because even for control levels of G-actin (i.e., with α = 1), the blebbistatin-treated growth cone has leading-edge tension on the same order as the stall force (Table S2), such that only a small amount of actin-network expansion with increasing G-actin is possible. For saturating levels of G-actin, the retrograde flow speed is sensitive to myosin concentration, while the P-domain width is not.
Forward-directed fluid flow can account for observed distributions of G-actin
As discussed above, the actin dynamics in the P domain are sensitive to leading-edge G-actin concentration, and newly recycled G-actin must be delivered to the leading edge quickly enough to maintain the rapid treadmill. A recent experiment using DNasel labeling to track G-actin monomers demonstrated that the G-actin distribution in the P domain usually has a positive gradient, with G-actin concentration highest at the leading edge (26). Given that F-actin is disassembled and recycled to G-actin uniformly throughout the P domain, we now turn to the question of how G-actin is transported to the leading edge: Can the observed distributions be explained by diffusion alone, or is active transport in the form of forward-directed fluid flow necessary to achieve a positive gradient in the G-actin distribution?
We use the mechanical parameters determined from the calibration of the F-actin treadmill to predict the form of the G-actin distribution as a function of the hypothetical forward fluid flow, vf. The equation governing the G-actin distribution (Eq. 8) in the steady state has the form
| (10) |
which has the analytical solution (using the boundary conditions discussed for Eq. 8)
| (11) |
In the absence of forward-directed fluid flow, the predicted G-actin concentration decreases toward the leading edge (Fig. 5 C), in contrast to the experimentally observed positive G-actin gradient. On the other hand, in the presence of forward fluid flow of greater than vf ∼ 0.15 μm/s, the distribution increases toward the leading edge, and it compares well quantitatively with the experimentally measured G-actin distribution for vf ∼ 0.3 μm/s (Fig. 5 C) (26). Thus, we conclude that forward-directed fluid flow of magnitude 0–0.3 μm/s may actively transport G-actin toward the leading edge in the P domain of the growth cone. Such flow was observed and measured in other cells (5,48); here, for the first time to our knowledge we suggest its existence in the nerve growth cone. Flow of this magnitude can increase the G-actin concentration at the leading edge twofold compared to diffusion-based transport, which would significantly accelerate the actin treadmill.
Discussion
Using a model for the actin network in the peripheral region of stationary nerve growth cones, we have calibrated the balance of forces on the actin treadmill, demonstrating that retrograde actin flow under control conditions is driven primarily by myosin contractile forces. Our results support the assumption that the effective drag force resisting retrograde flow is proportional to filopodial and veil (lamellipodial) actin density at the transition domain, because filaments must be severed to maintain actin turnover. We show that when myosin contractile forces are inhibited, the system transitions to a new steady state in which retrograde flow is driven by membrane tension. Simulations of the model illustrate that a constant rate of actin depolymerization throughout the lamellipodial network is essential for maintaining a balance of forces with a constant rate of retrograde flow. Available experimental data allow estimates of all relevant forces.
After constraining and testing the F-actin treadmill model with published experimental data, we make a testable prediction that increasing the G-actin concentration would alter the force balance, increasing the contribution of leading-edge tension to the retrograde flow. This transition would be characterized by an increase in P-domain width and retrograde flow, a prediction that could in principle be tested experimentally by using drugs that alter the G-actin/F-actin balance. We also predict that the P-domain dynamics will be less sensitive to G-actin concentration in blebbistatin-treated cells, where myosin inhibition has already led to an increase in leading-edge tension.
We demonstrate that the experimentally observed positive G-actin gradient (increasing toward the leading edge) in the P domain can be maintained if rapid forward-directed fluid flow of the cytoplasm on the order of 10–20 μm/min exists in the P domain. This predicted flow would significantly increase the G-actin concentration at the leading edge, accelerating the actin treadmill. Forward-directed fluid flow has been directly observed in keratocytes (5). Further research will be needed to observe and measure fluid flow directly in growth cones. More detailed future models could also help distinguish the potential roles of forward-directed fluid flow and other hypothetical forms of active transport of G-actin, such as myosin transport along filopodia (49).
Another future extension for our model is to predict the behavior of the system when substrate adhesion increases in response to external guidance cues. A careful treatment of the question will require a submodel for adhesion dynamics, similar to that in Chan and Odde (27), but we can make some simple initial predictions based on the conclusions of the study described here. Assuming, according to previous modeling (10,11) and observations (12), that adhesion to the substrate generates viscous-like friction, Eq. 3, which describes the force balance on the P domain, can be rewritten as , where is the effective adhesion drag coefficient. When adhesion increases drastically, this equation says that the retrograde flow is almost canceled. In the treadmill stage, the polymerization rate at the front is balanced by the speed of the retrograde actin flow. This means that when the flow is canceled by the adhesion, the protrusion speed will be equal to the polymerization rate, and thus to the retrograde flow speed when the cell was stationary. The P-domain width after the adhesion increase, according to the model, will not change. Expanded to 2D, this model predicts that the cone can turn by establishing an asymmetric adhesion pattern, in which case asymmetric retrograde flow and protrusions will emerge, as suggested in Danuser and Oldenbourg (50). Note, however, that another study (51) proposes that the retrograde flow is symmetric, and instead, variations of the polymerization rate govern the turning behavior.
The importance of the nerve growth-cone mechanics in motility (52) and of mechanical cues in its guidance (53) is well established. Thus, the quantitative description of the growth-cone mechanics resulting from our study is an important step toward a more complete understanding of nervous system development. In the future, a more detailed mechanical model should incorporate the effects of compression and shear in the lamellipodium (52). Another future application of the model could be to analyze the role of microtubules and microtubule-based motors in the actin treadmill and growth-cone turning (54,55).
Acknowledgments
We thank C. Hyland for critical reading of the manuscript.
This work was supported by National Institutes of Health grants GM068952 to A.M. and NS28695 and NS51786 to P.F. and the Nikon Partners-in-Research Program.
Supporting Material
References
- 1.Bray D. Garland; New York: 2002. Cell Movements. [Google Scholar]
- 2.Pollard T.D., Borisy G.G. Cellular motility driven by assembly and disassembly of actin filaments. Cell. 2003;112:453–465. doi: 10.1016/s0092-8674(03)00120-x. [DOI] [PubMed] [Google Scholar]
- 3.Abraham V.C., Krishnamurthi V., Lanni F. The actin-based nanomachine at the leading edge of migrating cells. Biophys. J. 1999;77:1721–1732. doi: 10.1016/S0006-3495(99)77018-9. [DOI] [PMC free article] [PubMed] [Google Scholar]
- 4.Borisy G.G., Svitkina T.M. Actin machinery: pushing the envelope. Curr. Opin. Cell Biol. 2000;12:104–112. doi: 10.1016/s0955-0674(99)00063-0. [DOI] [PubMed] [Google Scholar]
- 5.Keren K., Yam P.T., Theriot J.A. Intracellular fluid flow in rapidly moving cells. Nat. Cell Biol. 2009;11:1219–1224. doi: 10.1038/ncb1965. [DOI] [PMC free article] [PubMed] [Google Scholar]
- 6.Bindschadler M., McGrath J.L. Relationships between actin regulatory mechanisms and measurable state variables. Ann. Biomed. Eng. 2007;35:995–1011. doi: 10.1007/s10439-007-9267-0. [DOI] [PubMed] [Google Scholar]
- 7.Mogilner A., Edelstein-Keshet L. Regulation of actin dynamics in rapidly moving cells: a quantitative analysis. Biophys. J. 2002;83:1237–1258. doi: 10.1016/S0006-3495(02)73897-6. [DOI] [PMC free article] [PubMed] [Google Scholar]
- 8.Prass M., Jacobson K., Radmacher M. Direct measurement of the lamellipodial protrusive force in a migrating cell. J. Cell Biol. 2006;174:767–772. doi: 10.1083/jcb.200601159. [DOI] [PMC free article] [PubMed] [Google Scholar]
- 9.Keren K., Pincus Z., Theriot J.A. Mechanism of shape determination in motile cells. Nature. 2008;453:475–480. doi: 10.1038/nature06952. [DOI] [PMC free article] [PubMed] [Google Scholar]
- 10.Heinemann F., Doschke H., Radmacher M. Keratocyte lamellipodial protrusion is characterized by a concave force-velocity relation. Biophys. J. 2011;100:1420–1427. doi: 10.1016/j.bpj.2011.01.063. [DOI] [PMC free article] [PubMed] [Google Scholar]
- 11.Lin C.H., Espreafico E.M., Forscher P. Myosin drives retrograde F-actin flow in neuronal growth cones. Neuron. 1996;16:769–782. doi: 10.1016/s0896-6273(00)80097-5. [DOI] [PubMed] [Google Scholar]
- 12.Vallotton P., Gupton S.L., Danuser G. Simultaneous mapping of filamentous actin flow and turnover in migrating cells by quantitative fluorescent speckle microscopy. Proc. Natl. Acad. Sci. USA. 2004;101:9660–9665. doi: 10.1073/pnas.0300552101. [DOI] [PMC free article] [PubMed] [Google Scholar]
- 13.Renkawitz J., Schumann K., Sixt M. Adaptive force transmission in amoeboid cell migration. Nat. Cell Biol. 2009;11:1438–1443. doi: 10.1038/ncb1992. [DOI] [PubMed] [Google Scholar]
- 14.Gardel M.L., Sabass B., Waterman C.M. Traction stress in focal adhesions correlates biphasically with actin retrograde flow speed. J. Cell Biol. 2008;183:999–1005. doi: 10.1083/jcb.200810060. [DOI] [PMC free article] [PubMed] [Google Scholar]
- 15.Schaub S., Bohnet S., Verkhovsky A.B. Comparative maps of motion and assembly of filamentous actin and myosin II in migrating cells. Mol. Biol. Cell. 2007;18:3723–3732. doi: 10.1091/mbc.E06-09-0859. [DOI] [PMC free article] [PubMed] [Google Scholar]
- 16.Wilson C.A., Tsuchida M.A., Theriot J.A. Myosin II contributes to cell-scale actin network treadmilling through network disassembly. Nature. 2010;465:373–377. doi: 10.1038/nature08994. [DOI] [PMC free article] [PubMed] [Google Scholar]
- 17.Forscher P., Smith S.J. Actions of cytochalasins on the organization of actin filaments and microtubules in a neuronal growth cone. J. Cell Biol. 1988;107:1505–1516. doi: 10.1083/jcb.107.4.1505. [DOI] [PMC free article] [PubMed] [Google Scholar]
- 18.Huber F., Käs J., Stuhrmann B. Growing actin networks form lamellipodium and lamellum by self-assembly. Biophys. J. 2008;95:5508–5523. doi: 10.1529/biophysj.108.134817. [DOI] [PMC free article] [PubMed] [Google Scholar]
- 19.Mitchison T., Kirschner M. Cytoskeletal dynamics and nerve growth. Neuron. 1988;1:761–772. doi: 10.1016/0896-6273(88)90124-9. [DOI] [PubMed] [Google Scholar]
- 20.Lin C.H., Forscher P. Growth cone advance is inversely proportional to retrograde F-actin flow. Neuron. 1995;14:763–771. doi: 10.1016/0896-6273(95)90220-1. [DOI] [PubMed] [Google Scholar]
- 21.Jay D.G. The clutch hypothesis revisited: ascribing the roles of actin-associated proteins in filopodial protrusion in the nerve growth cone. J. Neurobiol. 2000;44:114–125. doi: 10.1002/1097-4695(200008)44:2<114::aid-neu3>3.0.co;2-8. [DOI] [PubMed] [Google Scholar]
- 22.Lowery L.A., Van Vactor D. The trip of the tip: understanding the growth cone machinery. Nat. Rev. Mol. Cell Biol. 2009;10:332–343. doi: 10.1038/nrm2679. [DOI] [PMC free article] [PubMed] [Google Scholar]
- 23.Tessier-Lavigne M., Goodman C.S. The molecular biology of axon guidance. Science. 1996;274:1123–1133. doi: 10.1126/science.274.5290.1123. [DOI] [PubMed] [Google Scholar]
- 24.Lewis A.K., Bridgman P.C. Nerve growth cone lamellipodia contain two populations of actin filaments that differ in organization and polarity. J. Cell Biol. 1992;119:1219–1243. doi: 10.1083/jcb.119.5.1219. [DOI] [PMC free article] [PubMed] [Google Scholar]
- 25.Schaefer A.W., Schoonderwoert V.Th. G., Forscher P. Coordination of actin filament and microtubule dynamics during neurite outgrowth. Dev. Cell. 2008;15:146–162. doi: 10.1016/j.devcel.2008.05.003. [DOI] [PMC free article] [PubMed] [Google Scholar]
- 26.Van Goor D., Hyland C., Forscher P. The role of actin turnover in retrograde actin network flow in neuronal growth cones. PLoS ONE. 2012;7:e30959. doi: 10.1371/journal.pone.0030959. [DOI] [PMC free article] [PubMed] [Google Scholar]
- 27.Chan C.E., Odde D.J. Traction dynamics of filopodia on compliant substrates. Science. 2008;322:1687–1691. doi: 10.1126/science.1163595. [DOI] [PubMed] [Google Scholar]
- 28.Medeiros N.A., Burnette D.T., Forscher P. Myosin II functions in actin-bundle turnover in neuronal growth cones. Nat. Cell Biol. 2006;8:215–226. doi: 10.1038/ncb1367. [DOI] [PubMed] [Google Scholar]
- 29.Burnette D.T., Schaefer A.W., Forscher P. Filopodial actin bundles are not necessary for microtubule advance into the peripheral domain of Aplysia neuronal growth cones. Nat. Cell Biol. 2007;9:1360–1369. doi: 10.1038/ncb1655. [DOI] [PubMed] [Google Scholar]
- 30.Odde D.J., Buettner H.M. Autocorrelation function and power spectrum of two-state random processes used in neurite guidance. Biophys. J. 1998;75:1189–1196. doi: 10.1016/S0006-3495(98)74038-X. [DOI] [PMC free article] [PubMed] [Google Scholar]
- 31.Wang F.S., Liu C.-W., Jay D.G. Modeling the role of myosin 1c in neuronal growth cone turning. Biophys. J. 2003;85:3319–3328. doi: 10.1016/S0006-3495(03)74751-1. [DOI] [PMC free article] [PubMed] [Google Scholar]
- 32.Maskery S., Shinbrot T. Deterministic and stochastic elements of axonal guidance. Annu. Rev. Biomed. Eng. 2005;7:187–221. doi: 10.1146/annurev.bioeng.7.060804.100446. [DOI] [PubMed] [Google Scholar]
- 33.Mortimer D., Feldner J., Goodhill G.J. Bayesian model predicts the response of axons to molecular gradients. Proc. Natl. Acad. Sci. USA. 2009;106:10296–10301. doi: 10.1073/pnas.0900715106. [DOI] [PMC free article] [PubMed] [Google Scholar]
- 34.Li G.H., Qin C.D., Li M.H. On the mechanisms of growth cone locomotion: modeling and computer simulation. J. Theor. Biol. 1994;169:355–362. doi: 10.1006/jtbi.1994.1158. [DOI] [PubMed] [Google Scholar]
- 35.Gauthier N.C., Fardin M.A., Sheetz M.P. Temporary increase in plasma membrane tension coordinates the activation of exocytosis and contraction during cell spreading. Proc. Natl. Acad. Sci. USA. 2011;108:14467–14472. doi: 10.1073/pnas.1105845108. [DOI] [PMC free article] [PubMed] [Google Scholar]
- 36.Houk A.R., Risca V., Weiner O. Mechanical tension spatially restricts signals to the leading edge during neutrophil migration. Cell. 2012;148:175–188. doi: 10.1016/j.cell.2011.10.050. [DOI] [PMC free article] [PubMed] [Google Scholar]
- 37.Hochmuth F.M., Shao J.Y., Sheetz M.P. Deformation and flow of membrane into tethers extracted from neuronal growth cones. Biophys. J. 1996;70:358–369. doi: 10.1016/S0006-3495(96)79577-2. [DOI] [PMC free article] [PubMed] [Google Scholar]
- 38.Kruse K., Joanny J.F., Prost J. Contractility and retrograde flow in lamellipodium motion. Phys. Biol. 2006;3:130–137. doi: 10.1088/1478-3975/3/2/005. [DOI] [PubMed] [Google Scholar]
- 39.Rubinstein B., Fournier M.F., Mogilner A. Actin-myosin viscoelastic flow in the keratocyte lamellipod. Biophys. J. 2009;97:1853–1863. doi: 10.1016/j.bpj.2009.07.020. [DOI] [PMC free article] [PubMed] [Google Scholar]
- 40.Schaefer A.W., Kabir N., Forscher P. Filopodia and actin arcs guide the assembly and transport of two populations of microtubules with unique dynamic parameters in neuronal growth cones. J. Cell Biol. 2002;158:139–152. doi: 10.1083/jcb.200203038. [DOI] [PMC free article] [PubMed] [Google Scholar]
- 41.Mallavarapu A., Mitchison T. Regulated actin cytoskeleton assembly at filopodium tips controls their extension and retraction. J. Cell Biol. 1999;146:1097–1106. doi: 10.1083/jcb.146.5.1097. [DOI] [PMC free article] [PubMed] [Google Scholar]
- 42.Lan Y., Papoian G.A. The stochastic dynamics of filopodial growth. Biophys. J. 2008;94:3839–3852. doi: 10.1529/biophysj.107.123778. [DOI] [PMC free article] [PubMed] [Google Scholar]
- 43.Burnette D.T., Ji L., Forscher P. Myosin II activity facilitates microtubule bundling in the neuronal growth cone neck. Dev. Cell. 2008;15:163–169. doi: 10.1016/j.devcel.2008.05.016. [DOI] [PMC free article] [PubMed] [Google Scholar]
- 44.Sheetz M.P., Wayne D.B., Pearlman A.L. Extension of filopodia by motor-dependent actin assembly. Cell Motil. Cytoskeleton. 1992;22:160–169. doi: 10.1002/cm.970220303. [DOI] [PubMed] [Google Scholar]
- 45.Oliver T., Dembo M., Jacobson K. Separation of propulsive and adhesive traction stresses in locomoting keratocytes. J. Cell Biol. 1999;145:589–604. doi: 10.1083/jcb.145.3.589. [DOI] [PMC free article] [PubMed] [Google Scholar]
- 46.Galbraith C.G., Sheetz M.P. Keratocytes pull with similar forces on their dorsal and ventral surfaces. J. Cell Biol. 1999;147:1313–1324. doi: 10.1083/jcb.147.6.1313. [DOI] [PMC free article] [PubMed] [Google Scholar]
- 47.Dai J., Sheetz M.P. Axon membrane flows from the growth cone to the cell body. Cell. 1995;83:693–701. doi: 10.1016/0092-8674(95)90182-5. [DOI] [PubMed] [Google Scholar]
- 48.Zicha D., Dobbie I.M., Dunn G.A. Rapid actin transport during cell protrusion. Science. 2003;300:142–145. doi: 10.1126/science.1082026. [DOI] [PubMed] [Google Scholar]
- 49.Zhuravlev P.I., Papoian G.A. Protein fluxes along the filopodium as a framework for understanding the growth-retraction dynamics: the interplay between diffusion and active transport. Cell Adhes. Migr. 2011;5:448–456. doi: 10.4161/cam.5.5.17868. [DOI] [PMC free article] [PubMed] [Google Scholar]
- 50.Danuser G., Oldenbourg R. Probing f-actin flow by tracking shape fluctuations of radial bundles in lamellipodia of motile cells. Biophys. J. 2000;79:191–201. doi: 10.1016/S0006-3495(00)76283-7. [DOI] [PMC free article] [PubMed] [Google Scholar]
- 51.Betz T., Koch D., Käs J.A. Stochastic actin polymerization and steady retrograde flow determine growth cone advancement. Biophys. J. 2009;96:5130–5138. doi: 10.1016/j.bpj.2009.03.045. [DOI] [PMC free article] [PubMed] [Google Scholar]
- 52.Betz T., Koch D., Käs J.A. Growth cones as soft and weak force generators. Proc. Natl. Acad. Sci. USA. 2011;108:13420–13425. doi: 10.1073/pnas.1106145108. [DOI] [PMC free article] [PubMed] [Google Scholar]
- 53.Franze K., Gerdelmann J., Käs J. Neurite branch retraction is caused by a threshold-dependent mechanical impact. Biophys. J. 2009;97:1883–1890. doi: 10.1016/j.bpj.2009.07.033. [DOI] [PMC free article] [PubMed] [Google Scholar]
- 54.Myers K.A., Tint I., Baas P.W. Antagonistic forces generated by cytoplasmic dynein and myosin-II during growth cone turning and axonal retraction. Traffic. 2006;7:1333–1351. doi: 10.1111/j.1600-0854.2006.00476.x. [DOI] [PubMed] [Google Scholar]
- 55.Nadar V.C., Ketschek A., Baas P.W. Kinesin-5 is essential for growth-cone turning. Curr. Biol. 2008;18:1972–1977. doi: 10.1016/j.cub.2008.11.021. [DOI] [PMC free article] [PubMed] [Google Scholar]
Associated Data
This section collects any data citations, data availability statements, or supplementary materials included in this article.