

Abstract
The main impairment to tissue maintenance during aging is the reduced capacity for stem cell self-renewal over time due to senescence, the irreversible block in proliferation. We have previously described that the basic helix-loop-helix (bHLH) transcription factor Twist-1 can greatly enhance the life span of bone marrow-derived mesenchymal stem/stromal cells (MSCs). In the present study, we show that Twist-1 potently suppresses senescence and the Ink4A/Arf locus with a dramatic decrease in the expression of p16 and to some extent a decrease in p14. Furthermore, the polycomb group protein and histone methyltransferase Ezh2, which suppresses the Ink4A/Arf locus, was found to be induced by Twist-1, resulting in an increase in H3K27me3 along the Ink4A/Arf locus, repressing transcription of both p16/p14 and senescence of human MSCs. Furthermore, Twist-1 inhibits the expression of the bHLH transcription factor E47, which is normally expressed in senescent MSCs and induces transcription of the p16 promoter. Reduced Twist-1 wild-type expression and function in bone cells derived from Saethre-Chotzen patients also revealed an increase in senescence. These studies for the first time link Twist-1 to histone methylation of the Ink4A/Arf locus by controlling the expression of histone methyltransferases as well as the expression of other bHLH factors.
INTRODUCTION
Clonogenic bone marrow (BM)-derived mesenchymal stem/stromal cells (BMSCs) are a heterogeneous mix of stem cells and committed progenitors that vary in their morphology, proliferation, and differentiation potential (9–12, 18, 23). This is attributed to the existence of a developmental hierarchy of stromal cellular differentiation, comprised largely of committed progenitor cells and a minor population of self-renewing multipotent stem cells capable of differentiating into adipocytes, osteoblasts (OB), chondrocytes, and myocytes (6, 21).
Adult somatic stem cells including BMSCs exhibit an increased propensity for cellular senescence during ex vivo expansion, which is accompanied by a reduction in self-renewal and multidifferentiation potential. Senescence is a “fail-safe” mechanism which is activated in response to various stresses such as DNA damage, oxidative damage, and oncogene activation (13, 24). During senescence, cells fail to respond to mitogenic stimuli, undergo dramatic changes in chromatin structure and gene expression, become enlarged and flattened, and remain viable yet nondividing. The Ink4A/Arf locus (the locus of p14Arf and p16) is central to cellular senescence as it signals via p53 and retinoblastoma (Rb) to inhibit proliferation. p14ARF activates p53 by sequestering Mdm2, an E3 ubiquitin ligase, to the nucleolus, thereby preventing the Mdm2-mediated targeting of p53 to proteolytic degradation (16). p53 subsequently activates p21 CIP1/WAF1, which inhibits the cell cycle. Moreover, when activated, p16 inhibits the cyclin-dependent kinases CDK4/6 and leads to the hypophosphorylation of Rb, which in turn represses E2F-mediated cell cycle progression (2, 22).
Transcriptional regulation of the Ink4A/Arf locus is therefore pivotal to the process of cellular senescence. The p16 promoter is both positively and negatively controlled by many transcription factors, including the Ets family and the basic helix-loop-helix (bHLH) transcription factors Id-1 and E2A. Ets1/2 has been shown to activate p16 by binding to its promoter, while Id-1 can inhibit this effect by binding Ets1/2, leading to the prolongation of the cell's life span (20). In contrast, Id-1 has been shown to repress p16 promoter activity in NIH 3T3 cells by binding to two E-box motifs in the proximal promoter. Since Id-1 lacks a DNA binding domain, it has been postulated that it heterodimerizes with an as-yet-unknown E-box binding protein, thereby inhibiting its ability to activate p16. Further studies have shown that E47, the class 1 bHLH factor encoded together with E12 as part of the E2A gene, binds the proximal promoter of p16 via the E-box motif, while Id-1 binds E47 and inhibits its ability to activate p16 in young healthy cells (28). Therefore, the interplay of the activating and repressing bHLH transcription factors is critical in determining the onset of senescence and hence the life span of cells.
Recent studies suggest that the Arf/Ink4A locus is epigenetically controlled by the polycomb repressor proteins (PcG) and histone demethylases (HDM) (5). PcG proteins are transcriptional repressors and can be functionally segregated into two complexes: polycomb repressor complex 2 (PRC2), which consists of Ezh2, EED, and SUZ12; and PRC1, which consists of Bmi1, PC, and RNF2. Ezh2 is a SET domain containing histone methyltransferase specific for histone H3K27 and H1K26 (17). The binding of PRC1 to chromatin and its ability to maintain transcriptional repression is dependent on histone H3 being methylated on K27 by PRC2 (14). The Ink4A locus is occupied by the PcG group proteins including Bmi-1 and Ezh2, and in healthy cells, this locus is heavily methylated on H3K27. Repression of the locus is dependent on Ezh2 and H3K27 methylation. During senescence, the levels of Ezh2 decrease, leading to a decrease in H3K27 (5). More recently, the histone demethylase KDM6B was shown to be recruited to the INK4A locus in response to oncogenic stress and to remove the H3K27 methylation mark, leading to p16 transcriptional activation and senescence (1). In addition, the histone H3K36me2 and K4me3 demethylase KDM2B has recently been shown to be recruited to the Arf/Ink4A locus, interact with Ezh2, and repress transcription (26).
In the present study, we investigated the mechanisms by which Twist-1 inhibits cellular senescence in human BMSCs at the epigenetic level and show that Twist-1 influences the epigenetic modification of the Ink4A/Arf locus via the regulation of Ezh2 expression and recruitment to the INK4A/Arf locus. Furthermore, we explored whether Twist-1 directly inhibits the bHLH factor E47, a known activator of p16 expression, as a potential mechanism leading to a decrease in cellular senescence and prolongation of the life span of BMSCs.
MATERIALS AND METHODS
Cell culture and antibodies.
Human bone marrow stromal/stem cells were derived from bone marrow aspirates from posterior iliac crest of normal adult volunteers after obtaining informed consent according to procedures approved by the Human Ethics Committee of the Royal Adelaide Hospital, South Australia. Saethre-Chotzen (SC) cells were derived from parietal bone (cranium) with informed consent by the Human Ethics Committee of the Women's and Children's Hospital, South Australia.
BMSCs and Saethre-Chotzen cells were cultured as previously described (15).
Generation of constructs.
pRUF green fluorescent protein (GFP) and pRUF Twist-1 constructs have previously been described (15). pGL3 was purchased from Promega. pGL3 p16-399, pGL3 p16-870, and pGL3 p16-2070 were kindly provided by Xiaowei Zhang, Beijing University, Health Science Center, Beijing, China.
RNA extractions, cDNA synthesis, and real-time PCR.
RNA from approximately 1.5 × 10⁵ human BMSCs was isolated using TRIzol (Invitrogen, Carlsbad, CA) according to the manufacturer's instructions. cDNA and real-time PCR was performed as previously described in triplicate (15). Changes in gene expression were calculated relative to β-actin using the 2-ΔCT method.
Western blotting.
Whole-cell lysates were prepared from transduced BMSC lines (2 × 10⁶ to 3 × 10⁶ cells). Western blotting was performed as previously described (15). Primary antibodies (1 μg/ml) 1:1,000 anti-p16 (SC-81613; Santa Cruz), 1:1000 phospho-Rb (ser780) (cst 9307S; Cell Signaling), 1:1,000 anti-E47 (SC-763X; Santa Cruz), and 1:10,000 anti-β-actin were used. Secondary detection antibodies were anti-mouse Ig–alkaline phosphatase conjugate (Chemicon Australia Pty. Ltd., Melbourne, Australia) used at 1:10,000 or anti-rabbit IgG–alkaline phosphatase conjugate (Chemicon International, Temecula, CA). Blots were developed with ECF substrate (GE Healthcare by Europa Bio Products) and analyzed on a Typhoon 9410 variable-mode imager (GE Healthcare UK Ltd., Buckinghamshire, England).
Senescence.
BMSCs (5 × 10⁴) were cultured in six-well dishes for 48 h. The β-galactosidase (β-Gal) staining kit was used (Cell Signaling Technology) for senescence assays according to the manufacturer's specifications. Cells were scored for senescence (blue) by visualization using light microscopy at ×40 to ×200 magnification.
Ki67 staining.
BMSCs were subcultured into 8-chamber slides (2 × 10⁴ cells/well). The cells were fixed in 4% formalin and then reacted with saturating levels of mouse anti-Ki67 antibody (Dako Corp., Carpinteria, CA) followed by incubation with peroxidase-conjugated rabbit anti-mouse IgG secondary antibody. Immunodetection was performed using a Zymed broad-spectrum immunoperoxidase kit (Vector Laboratories) according to the manufacturer's specifications.
Retroviral transduction and overexpression studies.
Retroviral transductions were performed as previously described using 5 μg of pRUF internal ribosome entry site (IRES) GFP control or pRUF IRES GFP hTwist-1 (15). Stably transduced GFP-positive MSCs were selected by fluorescence-activated cell sorting (FACS) using a Beckman Coulter Epics Ultra cell sorter (Beckman Coulter).
Transfection and luciferase assays.
Human osteosarcoma cells (HOS) (5 × 10⁵) were seeded in six-well plates and transfected with 1 μg of pGL3, pGL3 p16-399, pGL3 p16-870, and pGL3 p16-2070 together with 0.5 μg of pRUF GFP, pRUF hTwist-1, and pEF β-galactosidase. Transfections were performed with Lipofectamine according to the manufacturer's instructions (Invitrogen). β-Galactosidase enzyme assay system with reporter lysis buffer (catalog number [cat#] E2000; Promega) was used according to the manufacturer's instructions using 40 μg of protein. Luciferase activity was measured as previously described (7).
Oligonucleotides and primers.
The following primers were used for real-time PCR: E47 forward (F) 5′GTCCCTGGAGGAGAAAGACC3′, reverse (R) 5′AAAGGCCTCGTTGATGTCAC3′; KDM2B F 5′AGAAAACGGTCCCACTCTCA3′, R 5′TGTTTCCACAGCGTTTGAAG3′; human p16 F 5′GAAGGTCCCTCAGACATCCCC3′, R 5′GAAGGTCCCTCAGACATCCCC3′; human p14 F 5′CCCTCGTGCTGATGCTACTG3′, R 5′ACCTGGTCTTCTAGGAAGCGG3′; human Bmi1 F 5′CAGCAATGACTGTGATGCACT3′, R 5′GCCTTGTCACTCCCAGAGTC3′; human KDM6B F 5′TGATCAAGTTCTGCCTGCTG3′, R 5′GCTGCCATTCTCACTTGTCA3′; human EZH2 F 5′GGGACAGTAAAAATGTGTCCTGC3′, R 5′TGCCAGCAATAGATGCTTTTTG3′; human SUZ12 F 5′TGGGAGACTATTCTTGATGG3′, R 5′GGAGCCGTAGATTTATCATT3′; human EED F 5′TCTTACGTGGATGCTGATGC3′, R 5′ATAGCATTTCCATGGCCAAC3′; and human p21 F 5′ATTAGCAGCGGAACAAGGAG, R 5′CTGTGAAAGACACAGAACAG.
The following primers were used for chromatin immunoprecipitation (ChIP): p16 Ebox −2130, F 5′GAGAGGTACCCCGAGGAAAA3′, R 5′TGCTCAGACTTTGCTGATGC3′; Ebox −1670, F 5′CAAGCCCCGCTAATTTTGTA3′, R 5′GGAGGCAGAGGTTGCAGTAA3′; Ebox −1330, F 5′CACCATGGCCAGCTAATTTT3′, R 5′TGGCTTGCAATCTTGTTTTG3′; p16 TSS, F 5′ACCCCGATTCAATTTGGCAG3′, p16 TSS R 5′AAAAAGAAATCCGCCCCCG3′; p16 3′UTR, F 5′AGAGGGTCTGCAGCGG3′, p16 3′UTR, R 5′TCGAAGCGCTACCTGATTCC3′; human periostin (POTN), F 5′CTCTGGAAAGGATTGCAGAAT3′, hPOTN R, 5′AGTTGTGGGAGGGAACACTG3′; human p14 TSS F 5′GTGGGTCCCAGTCTGCAGTTA3′, p14 TSS R 5′CCTTTGGCACCAGAGGTGAG3′; human p14 3′ UTR F 5′GGAGCGATGTGATCCGTTATC3′, p14 3′UTR R 5′TGAAATCCCAATCGTCTTCCAC3′; human GAPDH (glyceraldehyde-3-phosphate dehydrogenase) exon1, F 5′GAAGGTGAAGGTCGGAGTCA3′, R 5′CCCATACGACTGCAAAGACC3′; and human albumin TSS F 5′CAGGGATGGAAAGAATCCTATGCC, R 5′CCATGTTCCCATTCCTGCTGT.
ChIP.
Human BMSCs (2 × 10⁶) were passaged until reaching approximately 70% confluence, and chromatin immunoprecipitation (ChIP) was performed using the Magna ChIP kit (Millipore Corporation, Billerica, MA) and carried out according to the manufacturer's instructions. Purified DNA was then used in real-time PCR.
Statistics.
Statistical P value differences between the Twist-1 and control MSC lines were determined using the Student unpaired t test.
RESULTS
Twist-1 prevents cellular senescence in human stromal cell populations.
Isolated cultures of human BMSCs were serially passaged until they reached senescence. BMSC senescence was assessed by measuring the activity of β-galactosidase (β-Gal+), an enzyme expressed in cells undergoing senescence. While few β-Gal+ senescent cells were evident in early-passage cultures, by passage 7 (P7) to P11, appreciable numbers of BMSCs exhibited the hallmarks of senescence, including a flattened cell morphology and expression of β-galactosidase (data not shown).
We have previously reported that the bHLH transcription factor Twist-1 can increase the life span of BMSCs and is highly expressed in BMSCs when first isolated from BM but is rapidly downregulated following ex vivo expansion. In order to determine the role of Twist-1 during primary BMSC senescence, BMSC senescence was compared between Twist-1-overexpressing BMSCs and vector control BMSC lines during ex vivo expansion. Both Twist-1 and control BMSC cultures exhibited few β-Gal+ cells during early passage (P3); however, by passage 11 most control cultures ceased to proliferate, expressed β-Gal, and were senescent (Fig. 1A and B). Conversely, overexpression of another bHLH family member, Id-1, had no effect on the proliferation or senescence of BMSCs over time (unpublished data). Furthermore, overexpression of an irrelevant gene, Dact3 (Dapper 3), had no effect on BMSC senescence (data not shown). The senescence-associated irreversible block in proliferation was further evident as control cells showed minimal staining for proliferation antigen Ki67, previously shown to decrease with the onset of senescence, whereas Twist-overexpressing cells displayed robust levels of Ki67 (data not shown). In contrast, by passage 11, Twist-1-overexpressing BMSCs exhibited significantly reduced numbers of β-Gal+ senescent cells and continued to proliferate normally. As shown in Fig. 1B, by passage 7, 20% of control BMSCs were β-Gal+, and this rapidly increased to 65% by passage 11. In contrast, at passage 7, only 6% of the Twist-1-overexpressing BMSCs were β-Gal+ (P < 0.001, n = 3, unpaired Student test) and increased to only 13% by passage 11 (P < 0.001, n = 3, unpaired Student test) (Fig. 1B).
Fig 1.

Twist-1 reduces cellular senescence of human BMSCs. (A) Human BMSC lines overexpressing Twist-1 or vector controls were subjected to serial passages (P). Cell samples (5 × 10³/cm2) at P2, P3, P5, P7, P9, and P11 were seeded in triplicate into six-well dishes for 48 h then stained for β-galactosidase activity (blue). Images were taken using visible light microscope Olympus CKX41 and an Olympus DP20 camera at ×20 magnification. Representative P3 and P11 images depict blue (arrows) senescent cells. (B) Twist-1-overexpressing and vector control BMSCs from multiple donors (n = 3) were seeded in duplicate, and the number of β-galactosidase-positive cells was expressed as a percentage of the total cell population counted. Statistical P value differences of <0.05 (*), <0.01 (**), and <0.001 (***) between the Twist-1 and control MSC lines were determined using the unpaired t test. (C) Passage 5 Saethre-Chotzen (SC) cells derived from a single patient or parietal bone cells from a wild-type (WT) sex- and age-matched individual were seeded in triplicate cultures (5 × 10³/cm2 cells per well) under osteogenic inductive conditions for 3 weeks. Mineralized deposits were stained with Alizarin Red. (D) Extracellular calcium was quantitated following treatment with 0.6 N HCl and normalized to total DNA per replicate well. (E) Saethre-Chotzen cells or wild-type parietal bone cells were seeded in six-well dishes in the presence of either normal growth medium (−) or osteogenic differentiation (Diff.) medium (+) for 7 and 14 days. Total RNA was used to generate cDNA for real-time PCR. Levels of Twist-1 transcript were measured in triplicate using Sybr green and expressed relative to the internal housekeeping gene, β-actin. (F) Saethre-Chotzen cells or wild-type bone cells were seeded in quadruplicate into 96-well plates with bromodeoxyuridine (BrdU) for 48 h to determine the level of BrdU incorporation. (G) Saethre-Chotzen cells or normal parietal bone cells were cultured until P11, when senescence was reached. Images were taken using a visible light microscope at ×20 magnification. A representative image is shown at P7 of β-galactosidase-positive blue (arrows) senescent cells. (H) Saethre-Chotzen cells or normal parietal bone cells were seeded in six-well dishes, serially passaged, and assessed for β-galactosidase activity. Each donor was seeded in triplicate and analyzed for percentage of β-galactosidase-positive cells. Error bars represent standard error of the mean (SEM).
The role played by Twist-1 in inhibiting cellular senescence was examined in naturally occurring Twist-1 loss-of-function mutant osteoblasts (OB) derived from patients with Saethre-Chotzen (SC). As shown in Fig. 1C and D, SC patient-derived OB exhibited a profound capacity to generate mineralized nodules in vitro compared to control cranial OB (P < 0.01, unpaired Student test). Real-time PCR analysis revealed that SC bone cells cultured under either normal growth conditions or osteogenic induction media exhibited reduced Twist-1 expression compared to the normal control OB (Fig. 1E) (P < 0.001, unpaired Student test).
OB from SC patients exhibited a significantly reduced capacity to proliferate compared with age- and sex-matched cranial OB derived from healthy subjects (Fig. 1F) (P < 0.001, n = 3, unpaired Student test). Furthermore, following continuous subculture, the SC patient-derived OB exhibited increased numbers of β-Gal+ senescent cells at passage 7 compared with cultures of control OB (Fig. 1G). As shown in Fig. 1H, close to 70% of SC OB cultures were senescent by passage 10 compared to 5% for the wild-type (WT) control OB cells.
Twist-1 reduces p14 and p16 expression and induces phosphorylation of retinoblastoma.
In order to determine the mechanism by which Twist-1 mediated the suppression of senescence, we examined the expression of the Ink4A/Arf locus given its central role in senescence. p14Arf and p16 gene expression levels were assessed by real-time PCR. At passage 3, p14 transcript levels were dramatically repressed in Twist-1-overexpressing BMSCs compared to the control BMSC cultures (Fig. 2A) (unpaired Student test, P < 0.01, n = 3). The same was evident at passage 5 (unpaired Student test, P < 0.001, n = 3). By passage 10, however, the levels of p14 were comparable between the control cells and Twist-1-overexpressing BMSCs. p16 transcript levels were low during the early cell passage (P3) in control BMSCs, and the levels increased dramatically, reaching maximum at passage 10 (P10) (Fig. 2B) when these cells were undergoing senescence. In contrast, the levels of p16 transcript were dramatically reduced in Twist-1-overexpressing BMSCs for all passages examined (Fig. 2B) (unpaired Student test, P < 0.001, n = 3). As a positive control, we examined a known target of Twist-1, p21, a cell cycle inhibitor known to be associated with senescence; p21 expression levels were drastically reduced in Twist-1-overexpressing cells compared to control cells at later passages (data not shown). Notably, the Twist-1-overexpressing cells displayed low levels of senescence and normal levels of cell proliferation.
Fig 2.

Twist-1 inhibits p14/p16 expression in human stromal cell. (A and B) Twist-1-overexpressing human BMSC and vector control BMSC lines were seeded (5 × 10³/cm2) in six-well dishes from passage 3 (P3) to P10 until confluent (n = 3 donors). Total RNA was isolated at each cell passage and prepared for real-time PCR to examine the gene expression levels of p14 (A) and p16 (B). Levels of transcript were measured in triplicate using Sybr green and expressed relative to the internal housekeeping gene, β-actin. Error bars represent standard error of the mean (SEM). Statistical P value differences of <0.05 (*), <0.01 (**), and <0.001 (***) between the Twist-1 and control MSC lines were determined using the unpaired t test. (C and D) Representative Western blots are shown depicting differential levels of p16 (C) and hyperphosphorylated Rb (pRb) proteins (D) in Twist-1-overexpressing BMSCs compared to the vector control BMSC line. Protein loading for each filter was evaluated by assessing β-actin expression.
Western blot analysis confirmed the decrease in protein expression of p16 in Twist-1-overexpressing BMSCs compared to the vector control BMSC line (Fig. 2C). Moreover, the decreased p16 protein expression in Twist-1-overexpressing BMSCs was associated with increased hyperphosphorylation of the p16 target, Rb (Fig. 2D).
Twist-1 enhances histone H3K27me3 along the Ink4A/Arf locus and increases recruitment of Ezh2.
Since Twist-1 represses both p14 and p16, we postulated that Twist-1 might alter histone 3 K27 and lysine 4 methylation along the Ink4A/Arf locus, given their roles in gene repression and activation, respectively. Using chromatin immunoprecipitation experiments, we assessed the levels of H3K27me3 along the Ink4A/Arf locus. In vector control BMSCs, there was detectable H3K27me3 along the p14 transcription start site (p14 TSS) compared to the IgG control antibody. This increased dramatically in Twist-1-overexpressing BMSCs (Fig. 3A) (P < 0.05, n = 3, unpaired Student test). In vector control BMSCs, there was specific H3K27me3 detected along the p16 transcription start site (p16 TSS) compared to the IgG control antibody. This increased in Twist-1-overexpressing BMSCs (Fig. 3B) (P < 0.05, n = 3, unpaired Student test). This increase in Twist-1-mediated H3K27 methylation was specific to p16 as H3K27 methylation along the transcription start site of the negative control gene, albumin, was not found to be increased in the Twist-1-overexpressing cells (data not shown). The increased H3K27 methylation in Twist-1-overexpressing BMSCs correlates with the decreased transcription of both p14 and p16 in Twist-1-overexpressing BMSCs. The Ink4A/Arf locus is tightly controlled by the polycomb repressor complexes (PRC). We therefore postulated that some of the PRC components might be targeted by Twist-1, thereby repressing p14/p16. The most critical component of PRC2 is the enzyme histone H3K27 methyltransferase, Ezh2. Examination of Ezh2 transcript levels revealed a gradual increase in Ezh2 from passage 3 to 10 in vector control-expressing BMSCs (Fig. 3C). The levels of Ezh2 transcript were significantly increased in Twist-1-overexpressing BMSCs from passage 3 (unpaired Student test, P < 0.05, n = 3) with the greatest increase evident at passage 10 (Fig. 3C) (unpaired Student test, P < 0.001, n = 3). We also examined gene expression levels of KDM2B, KDM6B, Bmi1, and PRC2 components SUZ12 and EED; however, no significant differences were evident when comparing control cells and Twist-1-overexpressing BMSCs (data not shown).
Fig 3.

Twist-1 enhances histone H3K27me3 along the Ink4A/Arf locus and increases recruitment of EZH2. (A) Twist-1-overexpressing human BMSC and vector control BMSC lines were seeded (1 × 10⁶) at passage 5 until confluent (n = 3 donors) and used for chromatin immunoprecipitation (ChIP). ChIP was performed using either the IgG control antibody or histone H3K27me3-specific antibody. Enriched genomic DNA was used to amplify the p14 transcription start site (p14 TSS). (B) ChIP assays were performed as described above on passage 5 BMSC overexpressing Twist-1 or vector alone. Enriched genomic DNA was used to amplify the p16 transcription start site (p16 TSS). (C) Twist-1-overexpressing human BMSC and vector control BMSC lines were seeded (5 × 10³/cm2) in six-well dishes from passage 3 (P3 to P10) until confluent (n = 3 donors). Total RNA was isolated at each cell passage and prepared for real-time PCR to examine the gene expression levels of Ezh2. Levels of transcript were measured in triplicate using Sybr green and expressed relative to the internal housekeeping gene, β-actin. Error bars represent standard error of the mean (SEM). Statistical P value differences of <0.05 (*), <0.01 (**), and <0.001 (***) between the Twist-1 and control MSC lines were determined using the unpaired t test. (D) In parallel studies, 1 × 10⁶ BMSCs overexpressing Twist-1 or vector alone were seeded at passage 10 for ChIP analysis using either the IgG control antibody or EZH2-specific antibody. Enriched genomic DNA was used to amplify the p14 transcription start site (p14 TSS), the p16 transcription start site (p16 TSS), or exon 1 of GAPDH. Fold enrichment was calculated by measuring the levels of enriched genomic DNA using Sybr green/real-time PCR and comparing the levels to the input genomic DNA. PCR was performed in triplicate, and error bars represent standard error of the mean (SEM). Statistical P value differences of <0.05 (*), <0.01 (**), and <0.001 (***) between the Twist-1 and control MSC lines were determined using the unpaired t test.
Given the increased expression of Ezh2 by Twist-1 and increased H3K27me3 along the Ink4A/Arf locus, we examined the recruitment of EZH2 along the Ink4A/Arf locus in late-passage BMSCs. In vector control BMSCs, there was no specific detectable EZH2 along the p14 and p16 TSS compared to the negative GAPDH exon 1 control (Fig. 3D). Conversely, EZH2 recruitment was significantly elevated along the p14 and p16 TSS in Twist-1-overexpressing BMSCs (unpaired Student test, P < 0.05, n = 2).
Twist-1 does not alter the levels of histone H3 K4me3 along the Ink4A/Arf locus.
Since H3K4me3 is associated with transcriptional activation, we next assessed the levels of H3K4me3 along the Ink4A/Arf locus affected by Twist-1. Specific enrichment of H3K4me3 was detected along the p14 TSS in vector control BMSCs compared to the IgG control antibody, with no significant differences in Twist-1-overexpressing BMSCs (Fig. 4A). Very low levels of H3K4me3 were evident along the p16 TSS compared to the IgG control antibody in control BMSCs (Fig. 4B). Compared to the IgG control antibody, the levels of H3K4me3 along the p16 TSS did not change in Twist-1-overexpressing BMSCs (Fig. 4B).
Fig 4.
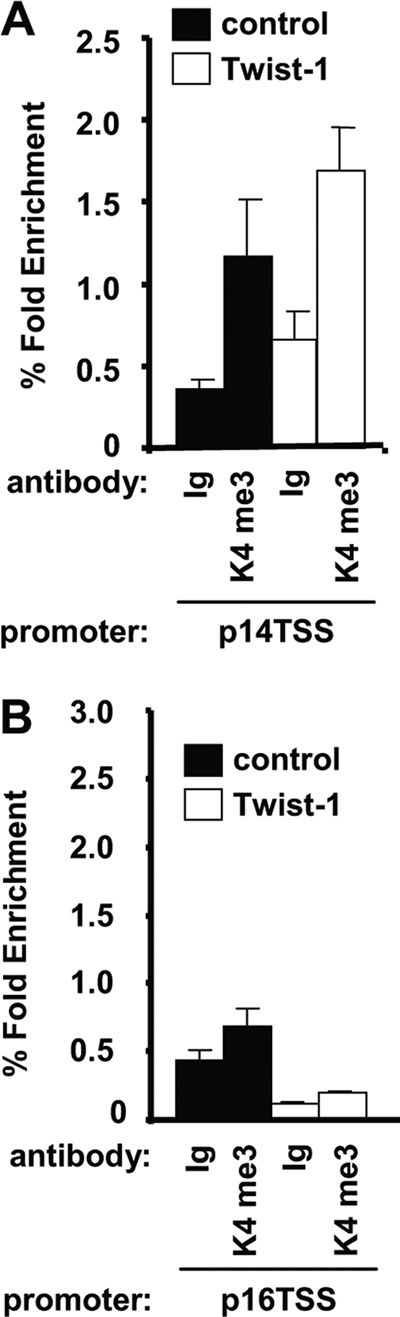
Twist-1 does not affect histone H3K4me3 along the Ink4A/Arf locus. (A) Twist-1-overexpressing human BMSC and vector control BMSC lines were seeded (1 × 10⁶) at passage 5 until confluent (n = 2 donors) for each chromatin immunoprecipitation (ChIP). ChIP was performed using either the IgG control antibody or histone H3K4me3-specific antibody. Enriched genomic DNA was used to amplify the p14 transcription start site (p14 TSS). (B) ChIP assays were performed as described above on passage 5 BMSCs overexpressing Twist-1 or vector alone. Enriched genomic DNA was used to amplify the p16 transcription start site (p16 TSS). Fold enrichment was calculated by measuring the levels of enriched genomic DNA using Sybr green/real-time PCR and comparing the levels to the input genomic DNA. Error bars represent standard error of the mean (SEM). Statistical P value differences of <0.05 (*), <0.01 (**), and <0.001 (***) between the Twist-1 and control MSC lines were determined using the unpaired t test.
The HLH transcription factor E47 activates p16 transcription and its expression is repressed by Twist-1.
Twist-1-mediated repression is more evident for p16 than for p14, implying that apart from histone lysine 27 methylation, multiple mechanisms are employed by Twist-1 to repress p16 transcription. Analysis of the p16 promoter revealed 5 E-box motifs in the first 2 kb of the p16 promoter, while the p14 promoter lacked any obvious E-box motifs. Given that the p16 promoter has 5 E-box motifs, it is possible that bHLH transcription factors bind the promoter and are possibly regulated by Twist-1. It has previously been shown in fibroblasts and transformed cell lines that the bHLH transcription factor E47 can bind the p16 promoter and induce transcription, promoting senescence (28). In view of this, we analyzed the kinetics of E47 expression in BMSCs during ex vivo expansion and senescence. The levels of E47 transcript were low when low-passage-number BMSCs were examined; however, the levels increased as BMSCs were serially passaged and reached cellular senescence (Fig. 5A) (P < 0.05, n = 4, unpaired Student test). Given that we have previously reported that Twist-1 expression decreases as BMSCs are serially passaged (15), this prompted us to examine whether Twist-1 could repress the transcription of E47. Analysis of E47 transcript levels in vector control and Twist-1-overexpressing BMSCs showed low levels of E47 in nonsenescent cells (Fig. 5B). At late cell passage (P10) when the vector control BMSCs were undergoing senescence, the levels of E47 transcript were highly expressed in these cultures, whereas E47 expression remained repressed in Twist-1-overexpressing BMSCs (Fig. 5B) (P < 0.05, n = 3, unpaired Student test). Western blot analysis demonstrated decreased levels of E47 protein in Twist-1-overexpressing BMSCs (Fig. 5C). To confirm that E47 could induce p16 transcription, we used a p16 luciferase reporter assay that was transfected into human osteosarcoma cells. A fragment containing the 2,070 bp of the p16 proximal promoter (pGL3 p16-2070, containing the 5 E-box motifs) was sufficient for activation of the reporter by E47 (Fig. 5D) (P < 0.01, unpaired Student test). Deletion of the 2,070-bp proximal promoter abolished E47-mediated activation of the p16 promoter reporter, revealing that the increased transcription by E47 was mediated between the region of 2,070- and 870-bp p16 promoter fragments. Last of all, we examined whether Twist-1 could repress the 2-kb p16 promoter reporter construct and found no significant effect (data not shown). We also investigated whether Twist-1 can be recruited to the p16 promoter using the ChIP assay. The two E-boxes in the proximal promoter did not reveal specific recruitment (data not shown). Compared to the GAPDH exon 1 negative control, the E-box 3 at position −2130 showed minimal recruitment (P < 0.05, unpaired Student test), and E-box 4 at position −1670 (relative to the translation start site) showed the most specific recruitment (P < 0.01, unpaired Student test), with E-box 5 at position −1330 showing no specific recruitment (Fig. 5B) compared to the GAPDH exon 1 negative control (Fig. 5E).
Fig 5.

E47 activates the p16 promoter reporter and Twist-1 inhibits E47 expression. (A) Human BMSCs were seeded (5 × 10³/cm2) in six-well dishes from passage 3 (P3) to P9 until confluent (n = 3 donors). cDNA was prepared and used in real-time PCR to examine the levels of E47. Levels of transcript were measured in triplicate using Sybr green and expressed relative to the internal housekeeping gene, β-actin. Error bars represent standard error of the mean (SEM). (B) Twist-1-overexpressing human BMSC and vector control lines were seeded (5 × 10³/cm2) in six-well dishes at passage 3 to 10 (A) and passage 10 until confluent (n = 3 donors). cDNA was prepared and used in real-time PCR to examine the levels of E47. (C) A representative Western blot is shown depicting differential levels of E47 protein in Twist-1-overexpressing BMSCs in comparison to the vector control. Protein loading for the filter was evaluated by assessing β-actin expression. (D) Human osteosarcoma cells (HOS) were seeded (2 × 10⁵) in triplicate in six-well plates and transfected with either the empty luciferase reporter (pGL3) or the luciferase reporter with either the 399 bp, 870 bp, or 2,070 bp of the proximal p16 promoter (pGL3 p16-399, -870, -2070). Vectors expressing either Twist-1, E47, or β-galactosidase were also cotransfected as indicated. Forty micrograms of lysate was used in luciferase and β-galactosidase activity assays. Luciferase levels were measured as counts per minute and normalized to β-galactosidase levels (relative counts). Error bars represent standard error of the mean (SEM). Statistical P value differences of <0.05 (*), <0.01 (**), and <0.001 (***) between the Twist-1 and control MSC lines were determined using the unpaired t test. (E) BMSCs (1 × 10⁶) were seeded at passage 5 for each chromatin immunoprecipitation (ChIP) until confluent (n = 2 donors). ChIP was performed using either the IgG control antibody or Twist-1-specific antibody. Enriched genomic DNA was used to amplify E-box sites at positions 2130 (E-box 3), 1670 (E-box 4), and 1330 (E-box 5) of the p16 promoter relative to the translation start site or exon 1 of GAPDH. Fold enrichment was calculated by measuring the levels of enriched genomic DNA using Sybr green/real-time PCR and comparing the levels to the input genomic DNA. Error bars represent standard error of the mean (SEM). Statistical P value differences of <0.05 (*), <0.01 (**), and <0.001 (***) between the Twist-1 and control MSC lines were determined using the unpaired t test DNA.
DISCUSSION
In this study, we established that overexpression of the bHLH transcription factor Twist-1 can suppress the senescence of BMSCs, leading to increased cellular proliferation and extended life span. Conversely, a loss-of-function mutation within exon 1 of Twist-1 in Saethre-Chotzen patient cells resulted in accelerated senescence and a decreased life span compared with control cells. The ability of Twist-1 to suppress senescence has been documented in previous studies using other cell types (19, 25). Twist-1 is frequently activated in cancer cells, and its induction is sufficient to override oncogene-induced senescence in both human and murine cells. Twist-1 has been shown to cooperate with ras to transform mouse embryo fibroblasts (MEFs) mainly due to its ability to inhibit senescence (3). We have previously shown that levels of Twist-1 decrease dramatically during ex vivo expansion of BMSCs (15). Given that the Ink4A locus, consisting of the genes p16 and p14Arf, is central to the induction of senescence, we found that cultured BMSCs undergoing senescence exhibit elevated levels of both p14Arf and p16. Furthermore, our studies suggest that the ability of Twist-1 to inhibit senescence was associated with a decrease in p16 transcription and delayed p14 transcription. The greater repressive effect on p16 suggests that Twist-1 regulates this gene differently from p14Arf. Our studies confirm these observations, since there are no obvious E-box binding sites along the p14Arf promoter, whereas 5 E-box motifs are present along the first 2 kb of the p16 promoter, indicating that p16 and not p14 is a direct target of HLH transcription factors. We showed direct binding of Twist-1 to the E-box at position −1670 relative to the translation start site. Suppression of p16 protein was also observed in BMSCs overexpressing Twist-1, which led to increased levels of hyperphosphorylated Rb, a known target of p16. In agreement with p16 being the major target of Twist-1-mediated repression, Saethre-Chotzen cells express high levels of p16 at the time of senescence and not p14 (data not shown). Studies conducted in other cell types have found that Twist-1 can repress both p16 or p14 transcription depending on the cell type (3, 19) and the nature in which senescence is induced.
Previously published reports examining transcription of the p16 promoter have shown that another bHLH transcription factor, E47, can bind to the p16 promoter at positions −354 and −620 relative to the translation start site in diploid fibroblasts (28). The investigators found that Id-1, a bHLH factor that lacks a DNA binding domain, when bound to E47, inhibited its ability to activate p16 transcription. Id-1 was expressed at high levels in healthy diploid fibroblasts; however, upon senescence, the levels decreased dramatically. In our study, we demonstrated that E47 is rapidly induced in senescent BMSCs, while Id-1 levels remain constant and overexpression of Id-1 has no effect on the growth rate or life span of BMSCs (unpublished observations). Similarly, overexpression of an irrelevant gene, DACT3, had no effect on the senescence of BMSCs. We also showed that E47 can activate the p16 luciferase reporter between the regions bp −2070 and bp −870. In BMSCs, overexpression of Twist-1 dramatically suppressed the levels of E47 transcript, and the kinetics of twist-1 and E47 had an inverse correlation, suggesting that in healthy early-passage cells, high Twist-1 levels repress E47 transcription, which in turn keeps the p16 gene silent. Unfortunately, we were unable to convincingly demonstrate E47 binding to the p16 promoter in ChIP assays due to the inability of the available antibodies to immunoprecipitate endogenous E47. The absence of E-box motifs in the p14 promoter would partly explain why p14 transcription was delayed only in Twist-1-overexpressing cells and not suppressed through all passages, as p14 is not directly targeted by Twist-1 or E47.
The Ink4A locus has been demonstrated in previous studies to be heavily regulated at the epigenetic level (5). In our study, Ezh2 levels were induced by Twist-1, and Twist-1 overexpression resulted in a dramatic increase in Ezh2 recruitment to the p14 and p16 transcription start site. In accord with this, Saethre-Chotzen cells which have a loss-of-function mutation in Twist-1 were found to have higher levels of p16 and lower levels of Ezh2 (data not shown). To our knowledge, this is the first time that Twist-1 has been shown to regulate epigenetic modifiers. Currently, we do not know if Twist-1 directly or indirectly regulates expression of Ezh2; however, there are no obvious E-box motifs in its promoter region, implying indirect regulation. Also, Twist-1 increased the expression of Ezh2 2-fold, yet the recruitment of Ezh2 to the p14 and p16 promoters was much greater, implying that Twist-1 enhances the recruitment of Ezh2 to the promoter. This could possibly occur by Twist-1 increasing expression of other factors in the complex, inducing other transcription factors which recruit Ezh2 to the promoter or inducing expression of a noncoding RNA that directs Ezh2 to the promoter. Various transcription factors and noncoding RNA molecules have been shown in many instances to recruit Ezh2 to different promoters (8, 27). In agreement with increased Ezh2 recruitment to the promoter, we also demonstrated that Twist-1 enhanced the levels of H3K27me3 along the Ink4A locus at both the p14 and p16 transcription start sites. Although H3K27me3 is generally concentrated around the TSS of genes, spreading along 5 to 10 kb of DNA has been shown to be frequent (4). We observed this spreading of the H3K27me3 to the 3′UTR of both p14 and p16 genes (data not shown).
Overall, the increased H3K27me3 epigenetically programs the Ink4A locus for repression, which is evident when looking at the transcript levels of p14/p16. It should be noted that the H3K27me3 levels along the p16 TSS are higher than the levels along the p14 TSS, possibly contributing to the increased repression on p16 transcription.
Our data reveal a novel mechanism of Twist-1 regulating the Ink4A locus in BMSC cells by regulating the expression and recruitment of Ezh2. In this model, early-passage BMSCs have high levels of Twist-1, which normally increases the levels of Ezh2 and recruitment to the p14, p16 TSS, and the levels of H3K27me3 are elevated keeping the Ink4A/Arf locus repressed. Twist-1 directly binds the p16 promoter and also represses E47 expression, a known transcriptional activator of the p16 promoter (Fig. 6). As the cells senesce, the levels of Twist-1 decrease, and the levels of Ezh2 also decrease, leading to reduced H3K27me3 along the Ink4A/Arf locus. The levels of E47 increase, and E47 binds the p16 promoter, resulting in an active p16 transcription. When Twist-1 is overexpressed, this results in increased Ezh2 and reduced E47, which represses the Ink4A/Arf locus, hence repressing senescence and increasing the life span of BMSCs.
Fig 6.

A model for Twist-1 regulation of the Ink4A/Arf locus. In this model, early-passage BMSCs have high levels of Twist-1, which normally increases the levels of EZH2 and recruitment to the p14, p16 transcription start site (TSS). This corresponds to increased levels of H3K27me3 along the Ink4A/Arf locus, leading to repression. Twist-1 also reduces the levels of E47 and binds the p16 promoter, aiding in repression. As the cells senesce, the levels of Twist-1 decrease, leading to a reduction in H3K27me3 along the Ink4A/Arf locus. This coincides with an increase in E47, resulting in transcriptional activation of p14/p16. When Twist-1 is overexpressed, this results in increased EZH2 and reduced E47, which represses the Ink4A/Arf locus, hence repressing senescence and increasing the life span of BMSCs.
ACKNOWLEDGMENT
This work was supported by National Health and Medical Research Council of Australia grant 626910.
Footnotes
Published ahead of print 30 January 2012
REFERENCES
- 1. Agger K, et al. 2009. The H3K27me3 demethylase JMJD3 contributes to the activation of the INK4A-ARF locus in response to oncogene and stress-induced senescence. Genes Dev. 23: 1171–1176 [DOI] [PMC free article] [PubMed] [Google Scholar]
- 2. Alcorta DA, et al. 1996. Involvement of the cyclin dependent kinase inhibitor p16 (Ink4A) in replicative senescence of normal human fibroblasts. Proc. Natl. Acad. Sci. U. S. A. 93: 13742–13747 [DOI] [PMC free article] [PubMed] [Google Scholar]
- 3. Ansieau S, et al. 2008. Induction of EMT by Twist proteins as a collateral effect of tumor-promoting inactivation of premature senescence. Cancer Cell 14: 79–89 [DOI] [PubMed] [Google Scholar]
- 4. Bernstein BE, et al. 2006. A bivalent chromatin structure marks key developmental genes in embryonic stem cells. Cell 125: 315–326 [DOI] [PubMed] [Google Scholar]
- 5. Bracken AP, et al. 2007. The polycomb group proteins bind throughout the INK4A-ARF locus and are disassociated in senescent cells. Genes Dev. 21: 525–530 [DOI] [PMC free article] [PubMed] [Google Scholar]
- 6. Bruder SP, Fink DJ, Caplan AI. 1994. Mesenchymal stem cells in bone development, bone repair and skeletal regeneration therapy. J. Cell. Biochem. 56: 283–294 [DOI] [PMC free article] [PubMed] [Google Scholar]
- 7. Cakouros D, Daish T, Martin D, Baehrecke EH, Kumar S. 2002. Ecdysone-induced expression of the caspase DRONC during hormone-dependent programmed cell death in Drosophila is regulated by Broad-Complex. J. Cell Biol. 157: 985–995 [DOI] [PMC free article] [PubMed] [Google Scholar]
- 8. Caretti G, Di Padova M, Micales B, Lyons GE, Sartorelli V. 2004. The polycomb Ezh2 methyltransferase regulates muscle gene expression and skeletal muscle differentiation. Genes Dev. 18: 2627–2638 [DOI] [PMC free article] [PubMed] [Google Scholar]
- 9. Friedenstein A. 1980. Stromal mechanocytes of bone marrow: cloning in vitro and retransplantation in vivo, p 19–29 In Thiernfelder S. (ed), Immunology of bone marrow transplantation. Springer-Verlag, Berlin, Germany: [DOI] [PubMed] [Google Scholar]
- 10. Friedenstein A, Chailakhyan R, Lalykina K. 1970. The development of fibroblast colonies in monolayer cultures of guinea pig bone marrow and spleen cells. Cell Tissue Kinet. 3: 393–403 [DOI] [PubMed] [Google Scholar]
- 11. Friedenstein AJ, Chailkahyan RK, Gerasimov UV. 1987. Bone marrow osteogenic stem cells: in vitro cultivation and transplantation in diffusion chambers. Cell Tissue Kinet. 20: 263–272 [DOI] [PubMed] [Google Scholar]
- 12. Gronthos S, et al. 2003. Molecular and cellular characterisation of highly purified stromal cells derived from human bone marrow. J. Cell Sci. 116: 1827–1835 [DOI] [PubMed] [Google Scholar]
- 13. Hayflick L, Moorhead PS. 1961. The serial cultivation of human diploid strains. Exp. Cell Res. 25: 585–621 [DOI] [PubMed] [Google Scholar]
- 14. Hernandez-Munoz I, Taghavi P, Kuijl C, Neefles J, Van Lohuizen M. 2005. Association of Bmi1 with polycomb bodies is dynamic and requires PRC2/EZH2 and the maintenance DNA methyltransferase DNMT1. Mol. Cell. Biol. 25: 11047–11058 [DOI] [PMC free article] [PubMed] [Google Scholar]
- 15. Isenmann S, et al. 2009. Twist family of basic-helix-loop-helix transcription factors mediate human mesenchymal stem cell growth and commitment. Stem Cells 27: 2457–2468 [DOI] [PubMed] [Google Scholar]
- 16. Kulju KS, Lehman JM. 1995. Increased p53 protein associated with aging in human diploid fibroblasts. Exp. Cell Res. 217: 336–345 [DOI] [PubMed] [Google Scholar]
- 17. Kuzmichev A, Jenuwein T, Tempst P, Reinberg D. 2004. Different EZH2 containing complexes target methylation of histone H1 or nucleosomal histone H3. Mol. Cell 14: 183–193 [DOI] [PubMed] [Google Scholar]
- 18. Kuznetsov SA, et al. 1997. Single-colony derived strains of human marrow stromal fibroblasts form bone after transplantation in vivo. J. Bone Miner. Res. 12: 1335–1347 [DOI] [PubMed] [Google Scholar]
- 19. Kwok WK, Ling MT, Yuen HF, Wong YC, Wang X. 2007. Role of p14ARF in TWIST-mediated senescence in prostate epithelial cells. Carcinogenesis 28: 2467–2475 [DOI] [PubMed] [Google Scholar]
- 20. Ohtani N, et al. 2001. Opposing effects of Ets and Id proteins on p16INK4a expression during cellular senescence. Nature 409: 1067–1070 [DOI] [PubMed] [Google Scholar]
- 21. Owen M, Friedenstein A. 1988. Marrow-derived osteogenic precursors. Ciba Found. Symp. 136: 42–60 [DOI] [PubMed] [Google Scholar]
- 22. Palmero I, et al. 1997. Accumulation of p16INK4A in mouse fibroblasts as a function of replicative senescence and not of retinoblastoma gene status. Oncogene 15: 495–503 [DOI] [PubMed] [Google Scholar]
- 23. Pittenger MF, et al. 1999. Multilineage potential of adult human mesenchymal stem cells. Science 284: 143–147 [DOI] [PubMed] [Google Scholar]
- 24. Serrano M, Blasco MA. 2001. Putting the stress on senescence. Curr. Opin. Cell Biol. 13: 748–753 [DOI] [PubMed] [Google Scholar]
- 25. Tsai CC, et al. 2011. Hypoxia inhibits senscence and maintains mesenchymal stem cell properties through down-regulation of E2A-p21 by HIF-Twist. Blood 117: 459–469 [DOI] [PubMed] [Google Scholar]
- 26. Tzatsos A, Pfau R, Kampranis SC, Tsichlis PN. 2009. Ndy1/KDM2B immortalizes mouse embryonic fibroblasts by repressing the Ink4A/Arf locus. Proc. Natl. Acad. Sci. U. S. A. 106: 2641–2646 [DOI] [PMC free article] [PubMed] [Google Scholar]
- 27. Zhao J, et al. 2010. Genome-wide identification of polycomb-associated RNAs by RIP-seq. Mol. Cell 40: 939–953 [DOI] [PMC free article] [PubMed] [Google Scholar]
- 28. Zheng W, Wang H, Xue L, Zhang Z, Tong T. 2004. Regulation of cellular senescence and p16(INK4A) expression by Id-1 and E47 proteins in human diploid fibroblasts. J. Biol. Chem. 279: 31524–31532 [DOI] [PubMed] [Google Scholar]
- 29. Zhou S, et al. 2008. Age-related intrinsic changes in human bone marrow-derived mesenchymal stem cells and their differentiation to osteoblasts. Aging Cell 7: 335–343 [DOI] [PMC free article] [PubMed] [Google Scholar]