Background: The structure and function of the Vibrio fischeri O-antigen were unknown.
Results: The O-antigen structure was determined using an O-antigen ligase mutant.
Conclusion: This mutant had a motility defect, and comparison of its LPS with wild-type LPS showed that the O-antigen contains some unusual sugars.
Significance: The O-antigen mutation results in a significantly slower rate of bacterial colonization of the squid light organ.
Keywords: Lipopolysaccharide (LPS), Mass Spectrometry (MS), NMR, Structural Biology, Symbiosis, O-antigen, Vibrio fischeri, Bacterial Colonization
Abstract
Vibrio fischeri exists in a symbiotic relationship with the Hawaiian bobtail squid, Euprymna scolopes, where the squid provides a home for the bacteria, and the bacteria in turn provide camouflage that helps protect the squid from night-time predators. Like other Gram-negative organisms, V. fischeri expresses lipopolysaccharide (LPS) on its cell surface. The structure of the O-antigen and the core components of the LPS and their possible role in colonization of the squid have not previously been determined. In these studies, an O-antigen ligase mutant, waaL, was utilized to determine the structures of these LPS components and their roles in colonization of the squid. WaaL ligates the O-antigen to the core of the LPS; thus, LPS from waaL mutants lacks O-antigen. Our results show that the V. fischeri waaL mutant has a motility defect, is significantly delayed in colonization, and is unable to compete with the wild-type strain in co-colonization assays. Comparative analyses of the LPS from the wild-type and waaL strains showed that the V. fischeri LPS has a single O-antigen repeat composed of yersiniose, 8-epi-legionaminic acid, and N-acetylfucosamine. In addition, the LPS from the waaL strain showed that the core structure consists of l-glycero-d-manno-heptose, d-glycero-d-manno-heptose, glucose, 3-deoxy-d-manno-octulosonic acid, N-acetylgalactosamine, 8-epi-legionaminic acid, phosphate, and phosphoethanolamine. These studies indicate that the unusual V. fischeri O-antigen sugars play a role in the early phases of bacterial colonization of the squid.
Introduction
One of the best studied examples of bacterial-eukaryotic host symbiosis is the relationship between Vibrio fischeri and the Hawaiian bobtail squid, Euprymna scolopes. V. fischeri is a luminescent bacterium that colonizes the light organ of the squid and provides it with camouflage from nocturnal predators. Colonization occurs early in life with populations of V. fischeri filling the host crypts between 12 and 18 h post-hatching (1, 2). A remarkable characteristic of this interaction is that V. fischeri is culled by the squid from the entire microbiota of seawater of which V. fischeri is a relatively minor constituent (∼0.1%). Alterations in the anatomy of the squid light organ, which serve to preserve this monobacterial state, are induced during initial colonization and completed within 96–120 h after hatching (3). These alterations include the loss of a ciliated field of epithelial cells that expedite the transit of the bacterial cells to the light organ during the colonization process (4). These changes in morphogenesis within the light organ are orchestrated by lipid A and peptidoglycan components released by V. fischeri (4, 5).
V. fischeri is a Gram-negative bacterium and expresses lipopolysaccharide (LPS) on its cell surface. LPS is composed of three regions as follows: lipid A, which anchors the structure to the outer membrane; the core, and the O-antigen, which typically consists of repeating saccharide units. A recent publication from our group showed that V. fischeri expresses a heterogeneous mixture of lipid A structures with varying lengths of acyl groups, ranging from tetra- to octa-acylated structures (6). In addition to the lipid A studies, our group also examined the whole LPS structure by silver-stained SDS-PAGE. These data demonstrated that unlike traditional LPS, which generates a ladder-like banding pattern on the gel due to the O-antigen repeat units, the V. fischeri LPS migrated as two low molecular weight bands, likely corresponding to the core and the core plus one O-antigen repeat unit as observed previously (7).
This study was initiated to elucidate the components of the V. fischeri LPS core and O-antigen and to determine what role they may play in colonization of the squid. A waaL mutant was utilized to help discern which components of the LPS were O-antigen and which were core sugars. WaaL is an enzyme that ligates the O-antigen to the lipid A-core of LPS as shown in Pseudomonas aeroginosa (8, 9). Therefore, a waaL mutant, which eliminates the function of this ligase, is expected to express an LPS structure that lacks the O-antigen. A combination of experimental approaches, including mass spectrometry, GC-MS, and NMR were utilized to study the V. fischeri LPS structures from both wild-type and waaL mutant strains. In addition, motility and colonization studies were performed to determine whether the V. fischeri O-antigen plays a role in initiating colonization of the squid.
EXPERIMENTAL PROCEDURES
Bacterial Strains and Culture Conditions
Strains and vectors used in this study are shown in Table 1. Wild-type strain ES114, which was previously isolated from E. scolopes (10), was used in this study. All V. fischeri strains were grown in either LBS medium (11) or seawater-based tryptone medium (12) made with Instant Ocean (Aquarium Systems, Mentor, OH). The V. fischeri ES114 waaL mutant strain, MB06859, was grown on selective medium containing 5 μg/ml erythromycin and was screened for lack of growth on media containing 100 μg/ml kanamycin.
TABLE 1.
Bacterial strains and plasmids
| Description | Ref. or source | |
|---|---|---|
| Strains | ||
| V. fischeri | ||
| ES114 | Sequenced wild-type E. scolopes light organ isolate | 71 |
| MB06859 | ES114 waaL::Tnerm | This work |
| BK111 | MB06859 harboring pVSV105 | This work |
| BK110 | MB06859 harboring pBK01 | This work |
| MB24439 | ES114 flaD::Tnerm | Footnote 3 |
| MJM1575 | ES114 harboring pVSV103 | This work |
| E. coli | ||
| DH5α-λpir | Cloning vector | 72 |
| MJM534 | CC118λpir, carries pEVS104 for E. coli to V. fischeri conjugation | 73 |
| Plasmidsa | ||
| pVSV105 | pES213-based plasmid used for complementation, CamR | 15 |
| pBK01 | pVSV105 containing waaL ORF and upstream region | This work |
| pVSV103 | pES213-based plasmid containing LacZ used for marking strains, KanR | 15 |
| pEVS104 | pRK2013-based plasmid, helper for E. coli to V. fischeri conjugation, KanR | 73 |
| pVSV208 | pES213-based plasmid containing rfp, CamR | 15 |
a Abbreviations used are as follows: Kan, kanamycin; Cam, chloramphenicol.
Generation of waaL Mutant and Complement Strains
V. fischeri ES114 was mutagenized by conjugation with Tn5 delivery vector pMJM10,3 a derivative of pEVS170 (13). The resulting transconjugants were selected for erythromycin resistance (transposon integration), arrayed in a 96-well format, and screened for kanamycin sensitivity (loss of donor plasmid). The resulting arrayed library was screened in 96-well format for motility defects in LBS 0.3% agar.3 A semi-arbitrarily primed PCR procedure was used to map transposon insertion junctions using a previously published protocol (14). High quality sequence of the junctions indicated that one strain, MB06859, contained a Tn5 insertion in the 5′ half of waaL (VF_0151). This strain displayed growth comparable with the wild-type parent, stably maintained the transposon insertion, and was subsequently designated ES114 waaL. Next, a complemented strain was generated. The V. fischeri waaL gene and ∼50 bp of upstream region, included to incorporate a ribosomal binding site, were PCR-amplified from bacterial chromosomal DNA. The primer sequences used were GCGCATGCATATGGCGATGATTAATAAGTAGATTT (forward primer) and GCGGTACCTTATGACCTGATATCTTTTGTCGAG (reverse primer), with underlined text indicating SphI and KpnI restriction sites, respectively. The amplified product was cut with the restriction enzymes indicated above and ligated into the cloning region of the vector pVSV105 (15). Both this construct, termed pBK01, and the parent vector pVSV105 were conjugated from Escherichia coli into the ES114 waaL mutant, MB06859, as described previously (16), yielding strains designated BK110 (waaL complement) and BK111 (empty vector control), respectively.
V. fischeri Motility Studies
Bacterial cultures were grown in LBS medium (11) to an A600 of 0.3. Then 3 μl of these cultures were inoculated into plates containing seawater-based tryptone medium (12) with 0.3% agar, in triplicate. These plates were incubated at 28 °C for 11 h before photographing them and measuring the diameters of the motility fronts.
E. scolopes Light Organ Colonization Studies
Adult E. scolopes were collected, maintained, and bred as described previously (17). Hatchling animals were collected as in previous experiments (18). To colonize, animals were exposed overnight to artificial seawater containing ∼4000 colony-forming units (CFU)/ml of a V. fischeri strain (see Fig. 2 for strains used; a description of these strains is in Table 1). Luminescence was evaluated with a TD 20/20 luminometer at 24 and 44 h after the initial exposure to V. fischeri. In a confirmatory experiment, after luminescence was quantified at 24 h, animals were rinsed, homogenized, and plated on LBS medium as described previously (19) to determine the number of CFU of bacteria in the light organ.
FIGURE 2.
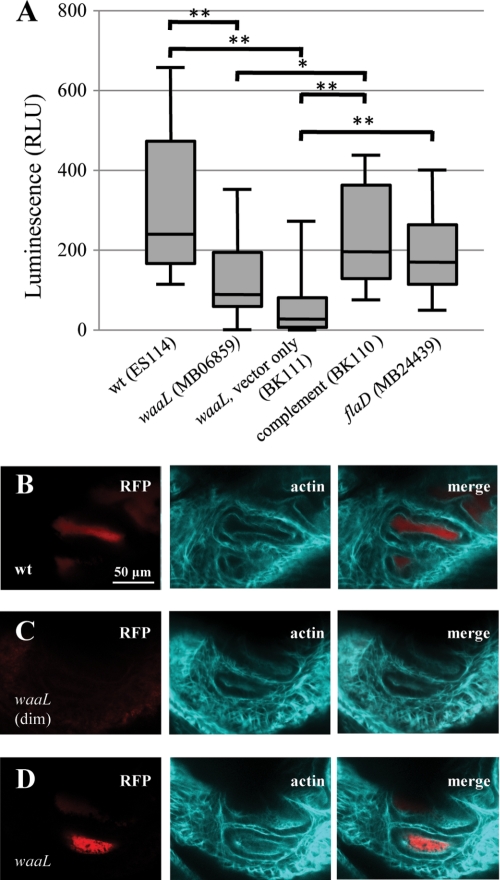
Animal colonization by waaL mutant. A, box-whisker plot of luminescence, in relative luminescence units (RLU), of animals colonized with different bacterial strains 24 h into exposure. n = 10 animals for each treatment except n = 20 for MB06859. Statistical comparison of treatments is by Mann-Whitney U test, following Kruskal-Wallis test for all data. Any two treatments not marked with an asterisk were not found to be significantly different (*, p < 0.05; **, p < 0.01). B–D, confocal microscopy of light organ crypts (actin cytoskeleton, shown in teal) in animals colonized with red fluorescent protein-labeled V. fischeri (red) at 24 h into exposure. B shows an animal exposed to wild-type bacteria, and C and D show animals exposed to the waaL mutant. The animal in C had no appreciable luminescence (dim) at the time of fixation (defined as relative luminescence units <2), but the animal in D was noticeably luminescent.
In the competition experiment V. fischeri strain MJM1575, a wild-type strain carrying the plasmid pVSV103 (15), was used. The pVSV103 plasmid, which was introduced to ES114 using the same conjugation methods that were used for pVSV105 and pBK01, carries the E. coli lacZ gene, causing the strain to appear blue when exposed to X-gal. Animals in the competition experiment were exposed to ∼7000 CFU/ml each of MJM1575 and an unlabeled strain, as indicated in Fig. 3. The precise ratio of the unlabeled strain to MJM1575 was determined by plating water from the inoculum on LBS medium containing 100 μg/ml of X-gal and counting blue (MJM1575) and white (unlabeled strains) colonies. The ratio of unlabeled strain to MJM1575 was in the range of 0.97 to 1.02 for all inoculations. At 48 h after the beginning of exposure to bacteria, homogenates of the animals were plated on the same medium as above, and blue and white colonies were counted to determine the ratio of the two strains in light organ tissues.
FIGURE 3.
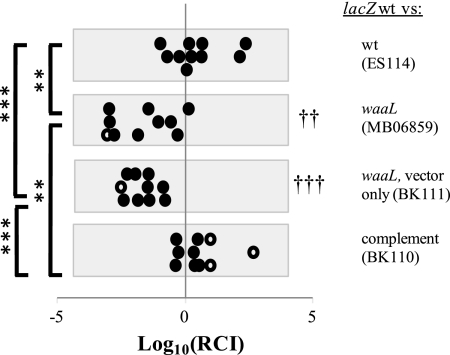
Colonization of the light organ competition assays of the various strains compared with the wild-type strain. Competition between wild type or waaL strains and MJM1575 (lacZ-labeled wild-type V. fischeri) is shown. The RCI is calculated as the ratio of (unlabeled strain/MJM1575) colonies from each animal plated, divided by the ratio of those strains in the original inoculum (20). Log10(RCI) <0 indicates that MJM1575 is more prevalent than the unlabeled strain, and log10(RCI) >0 indicates the opposite. Closed circles represent individual animals in which both strains were detected, and open circles indicate animals in which only one strain was detected; the value of log10(RCI) for these points represents a limit of detection. n = 10 animals for each treatment. Treatments for which mean log10(RCI) was significantly different from 0 by one sample t test are indicated by †† or ††† (p < 0.01 and p < 0.001, respectively). One-way analysis of variance and unpaired t tests were also used to compare log10(RCI) between competitions, with significant differences shown in figure (**, p < 0.01; ***, p < 0.001).
Visualization of V. fischeri in E. scolopes Light Organ
Using the protocol described above, animals were colonized with V. fischeri ES114 or ES114 waaL (MB06859), both of which had been transformed with the plasmid pVSV208 (15), enabling them to produce red fluorescent protein. After their luminescence was read 24 h into exposure, animals were fixed and then visualized by confocal microscopy according to a protocol described previously (20). Prior to visualization, animals were exposed overnight to Alexa Fluor 633 phalloidin from Invitrogen (dissolved in methanol per manufacturer's recommendations) and then used at a 1:40 dilution in marine phosphate-buffered saline (PBS) (20) as a counterstain for actin.
Isolation and SDS-PAGE of LPS
Bacterial cultures were centrifuged, and cell pellets were washed once with PBS. Proteinase K-digested, phenol-extracted LPS was then isolated from the cells using a modified hot phenol/water method as described previously (21). SDS-PAGE analysis was performed as described by Lesse et al. (22). The gel was stained with ProQ Emerald glycostain per the manufacturer's instructions (Invitrogen).
Isolation of LPS O-antigen-Core Free of Lipid A
For NMR studies, the LPS from V. fischeri ES114 (wild-type) and ES114 waaL (∼8 mg) was hydrolyzed in 1 ml of 1% acetic acid at 100 °C for 2 h. Each sample was then centrifuged at 4 °C for 30 min, and the supernatant was aspirated, buffered to pH 7.4, and subjected to further purification with a size exclusion column. The purified product was then repeatedly lyophilized and rehydrated in deuterium oxide three times prior to NMR analysis.
Compositional Analyses
LPS isolated from the wild-type and the waaL mutant V. fischeri strains was treated with 2% acetic acid at 100 °C for 2 h to liberate the polysaccharide (PS)4 from the lipid. The samples were centrifuged at 14,000 rpm for 5 min, and the supernatants containing the PS were lyophilized. The precipitates were suspended in water, lyophilized, and kept for fatty acid analysis. PS samples were further processed with 48% aqueous HF at 4 °C for 48 h, followed by removal of acid by cold water dialysis for 2 days to generate dephosphorylated PS. Intact LPS samples were also treated with anhydrous hydrazine to obtain O-deacylated LPS (O-LPS). Briefly, the samples were treated with anhydrous hydrazine at 40 °C for 1 h, followed by precipitation of the modified LPS by cold acetone (−70 °C). The precipitate was washed with cold acetone twice and lyophilized.
Composition analyses of intact LPS, PS, O-LPS, and dephosphorylated PS were done by GC-MS as their trimethylsilyl-methylglycoside derivatives. Briefly, the samples were methanolized with 1 m methanolic HCl at 80 °C for 18 h, followed by re-N-acetylation using 4:1:1 methanol/pyridine/acetic anhydride at 100 °C for 1 h. Finally, trimethylsilylation was done using Tri-Sil reagent at 80 °C for 30 min. GC-MS was done on a Resteck-5Sil (MS) column (15 m × 0.25 μm × 0.2 μm, length × inner diameter × film thickness) and loaded with a split injector using a 1:25 split. Samples were run at 100 °C for a 5-min hold, and then the temperature was ramped up at a rate of 4 °C/min until the temperature reached 260 °C. Data were collected in the electron impact mode at 70 eV and scanned within the range of 50–600 atomic mass units.
MALDI-MS Analyses of LPS
To generate LPS more amendable to mass spectrometric analyses, O-LPS samples were prepared by treating ∼50 μg of LPS with 50 μl of anhydrous hydrazine followed by acetone precipitation as described previously (23). The PS was liberated from the lipid, and phosphate groups were removed from the PS by treatment with 48% aqueous HF for 16–24 h at 4 °C. HF was removed and neutralized by drying the sample with nitrogen gas under vacuum and over sodium hydroxide, as described previously (24). All samples were desalted by drop dialysis using 0.025-μm pore size nitrocellulose membranes (Millipore, Bedford, MA) and were subsequently lyophilized. Samples were reconstituted in 5–20 μl of HPLC grade H2O; 1 μl was loaded onto the target, allowed to dry, and then overlaid with 1 μl of matrix (50 mg/ml 2,5-dihydroxybenzoic acid (Laser Biolabs, Sophia-Antipolis Cedex, France) in 70% acetonitrile). Samples were subsequently analyzed using matrix-assisted laser desorption ionization mass spectrometry (MALDI-MS) on an LTQ linear ion trap mass spectrometer coupled to a vMALDI ion source (MALDI-LIT) (Thermo Fisher, Waltham, MA). The vMALDI source uses a nitrogen laser that operates at 337.1-nm wavelength, 3-ns pulse duration, and 60-Hz repetition rate. Data were collected in either the positive or negative ion mode using the automated gain control and the automatic spectrum filter settings. Tandem mass spectrometry (MSn) data were collected using a precursor ion selection window of 2–3 m/z and normalized collision energy of 35–40%.
NMR Spectroscopy
Wild-type and waaL V. fischeri oligosaccharides were lyophilized and dissolved in 100% D2O at ∼0.5 mm concentration for NMR studies. 1H homonuclear two-dimensional DQF-COSY (25), TOCSY (26), ROESY (26), and NOESY (27) experiments and 1H/13C two-dimensional heteronuclear HMQC, HMBC (28), H2BC (29, 30), and selective-TOCSY-HSQC experiments (31) were collected at 25 and/or 35 °C on a Bruker Avance II 800 MHz spectrometer equipped with a cryoprobe. The 31P/1H COSY spectra (32) were acquired at 25 °C on a Bruker Avance II 500 MHz spectrometer. The 1H and 31P chemical shifts were referenced to 2,2-dimethyl-2-silapentane-5-sulfonate and external 2% H3PO4 in D2O (33), respectively. NMR spectra were processed with the NMRPipe package (34) and analyzed using NMRView (35).
RESULTS
Generation and Confirmation of waaL Mutant and Complement Strains
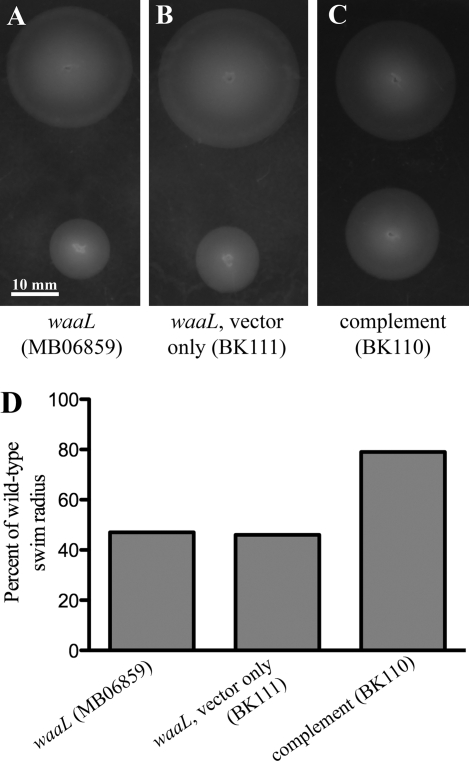
In an effort to find genes involved in V. fischeri motility, random mutagenesis was performed on the wild-type strain ES114. Motility was tested using a soft agar test where a thin metal replicating tool containing bacteria was inserted into the center of a plate, and the migration of the organisms from this central spot was mapped over time. One of the transconjugants, MB06859, isolated from the random mutagenesis showed a defect in its motility (supplemental Fig. S1), whereas the wild-type strain and a strain harboring a similar antibiotic resistance cassette in a different gene showed no motility defect. Sequencing of the transposon insertion site determined that the cassette inserted into the 5′ end of the gene was predicted to be waaL (VF_0151). A BLASTP query of VF_0151 revealed that it had highest sequence homology with waaL from Vibrionales bacterium SWAT-3 with an expectation value of 3 × 10⁻³⁵. The second highest match for this search was with waaL from Vibrio cholerae, with an expectation value of 1 × 10⁻³¹. To ensure that the phenotype observed in the waaL mutant was not due to a polar effect on a neighboring gene, we generated a complemented strain. The V. fischeri waaL gene was successfully cloned into the plasmid pVSV105, transformed into the waaL mutant strain, and subsequently designated as BK110. After generation of the complement strain, the plasmid DNA was isolated from BK110 and BK111 (the vector only control strain), and the cloning region was sequenced to verify the correct insertion (data not shown). In motility assays, expression of waaL in trans restored motility to the waaL mutant, indicating that the defects associated with transposon insertion in waaL are not merely polar effects. Colonies of the ES114 waaL mutant (MB06859) and the empty vector control (BK111) averaged 47 and 46% of wild-type swim diameter, respectively, whereas the complement strain, BK110, averaged 79% of wild-type swim diameter (Fig. 1). Complementation was also verified in the context of animal colonization (see below).
FIGURE 1.
Motility studies of waaL mutant bacteria and complementation constructs. A–C, representative images of motility assays comparing wild-type V. fischeri (at top of each plate) to the strain indicated. D, comparison of diameter between each strain and the wild-type culture spotted on the same plates.
E. scolopes Light Organ Colonization Studies
In an effort to determine how the motility defect of the waaL mutant impacts interactions with E. scolopes, light organ colonization studies were conducted. Luminescence was significantly higher for wild-type colonized animals than waaL mutant-colonized animals at 24 h, and complementation reversed the decrease in luminescence associated with the waaL mutant (Fig. 2A). To control for the waaL mutant's defect in motility, a symbiosis-associated trait (36), we exposed 10 squid in this experiment to V. fischeri MB24439, a strain that carries a mutation in the flaD gene and has similar motility behavior to the waaL mutant strain MB06859,3 but it is not predicted to have the cell surface abnormalities of MB06859. Animals colonized with the flaD mutant did not show significantly different luminescence at 24 h than either wild-type- or waaL mutant-colonized animals (Fig. 2A). Luminescence readings for the same animals were taken at 44 h, at which point all animals had detectable luminescence (defined as >2 relative luminescence units), and a significant, but not highly significant, difference was found between colonizing strains; mean luminescence remained higher for wild-type-colonized animals than waaL mutant-colonized animals (p = 0.037 for comparison of wild-type-colonized and waaL mutant-colonized animals) (supplemental Fig. S2). These data suggest that waaL mutant bacteria are slow to colonize the E. scolopes light organ, a phenotype that may be attributable to their motility defect.
We verified that low animal luminescence at 24 h was not due to a defect in bacterial luminescence, and in fact it resulted from low levels of bacterial colonization. In wild-type-colonized animals (all of which had detectable luminescence) and in three of four waaL mutant-colonized animals that had detectable luminescence, fluorescently labeled bacteria could be detected in the light organ crypt spaces (Fig. 2, B and D). This result was not seen with those waaL mutant-colonized animals that had insignificant levels of luminescence at 24 h (Fig. 2C). In a confirmatory experiment comparing animal colonization by either ES114 (wild-type) or MB06859 (waaL mutant) alone, wild-type-colonized animals were shown (via homogenization and plating at 24 h) to harbor significantly more V. fischeri CFUs than those colonized by the waaL mutant (supplemental Fig. S3).
Since it has previously been shown that a V. fischeri strain that shows a subtle defect or no defect in colonization when presented alone may be deficient when competed against a wild-type strain in colonization (37), we performed competition experiments using the strains generated in this study. For competition experiments (Fig. 3), in which two strains are co-incubated in the animal, a convention has been developed in which results for each strain are expressed in terms of relative competitive index (RCI) (19). Details for how this value is calculated are given in the legend of Fig. 3. For this experiment, evaluation of RCI values indicated that the waaL mutant and empty vector control, but not the complemented strain or the unlabeled wild-type strain, were outcompeted by the labeled wild-type strain. These results show that mutation of waaL renders V. fischeri less competitive than wild-type bacteria in colonizing the light organ.
SDS-PAGE of LPS
The LPS from V. fischeri strains ES114 wild-type, ES114 waaL (MB06859), ES114 waaL vector only control (BK111), and ES114 waaL complemented with waaL (BK110) were analyzed by SDS-PAGE (Fig. 4). These data showed that the wild-type LPS migrated as a major band containing one O-antigen subunit and a second faster migrating faint core band (Fig. 4, lane 2). The waaL LPS had a fast migrating lower major band consistent with a core region without O-antigen (Fig. 4, lane 3), clearly indicating that the waaL strain expresses a truncated LPS structure. The waaL-complemented strain, BK110, had a banding pattern that corresponded to the wild-type LPS (Fig. 4, lane 4), and the waaL vector only control (BK111) LPS migrated in a similar fashion as the waaL LPS (lane 5). These results demonstrate that the differences seen in the waaL strain were due to a mutation in waaL.
FIGURE 4.
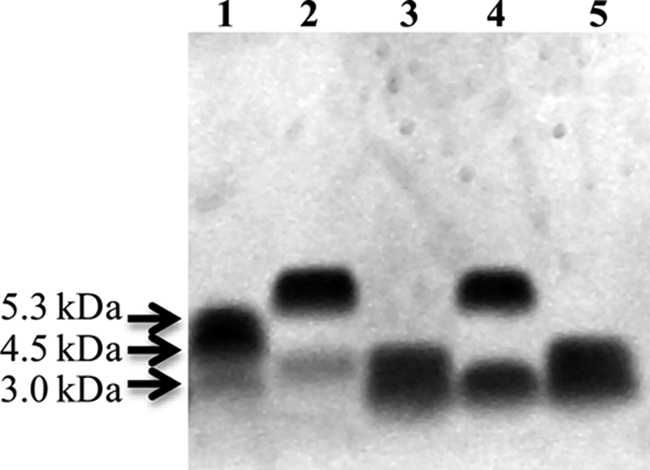
SDS-PAGE analyses of V. fischeri LPS. LPS was isolated from Neisseria gonorrhoeae strain PID2 and included as a molecular weight marker (lane 1). Lanes 2–5 are ES114 wild-type, ES114 waaL (MB06859), ES114 waaL complemented with waaL (BK110), and ES114 waaL vector only control (BK111), respectively. The gel was stained with ProQ Emerald glycostain.
Composition Analysis of the LPS by GC-MS
Composition analysis, by GC-MS, of the wild-type LPS showed the presence of Glc, Kdo, FucNAc, l-glycero-d-mannoheptose (ld-Hep), GalNAc, and GlcNAc as the major sugars (supplemental Figs. S4–S7). In addition, there were several peaks eluting at retention times 14.07, 14.98, and 15.13 min that had identical electron impact fragmentation patterns, which we proposed to be from the sugar yersiniose (Yer) (supplemental Figs. S4–S7). A small amount of ribose was also detected, which is most likely a contaminant from RNA co-extracted with the LPS. The composition analysis of the LPS from the waaL mutant strain showed the presence of Glc, Kdo, ld-Hep, GlcNAc, and GalNAc (supplemental Figs. S4–S7); however, the amount of GalNAc detected appeared lower in the mutant compared with the wild-type LPS. In addition, both FucNAc and Yer were not clearly detected in the waaL LPS samples, suggesting that these sugars were absent from the waaL LPS. Both the wild-type and waaL LPS samples contained C14:0, 3-OH C12:0, 3-OH C14:0, and C16:0 fatty acids along with several unsaturated fatty acids, consistent with the recently elucidated V. fischeri lipid A structure (6). Analyses of the O-deacylated LPS from both strains indicated that 3-OH C14:0 was the only amide-linked fatty acid (supplemental Fig. S5), which was also consistent with the proposed V. fischeri lipid A structure (6).
The PS from both strains were liberated from the LPS by mild acid hydrolysis and further treated with HF to dephosphorylate the PS. The PS and dephosphorylated PS from both strains were analyzed by GC-MS. The wild-type PS consisted of Glc, dd-Hep, ld-Hep, FucNAc, and GalNAc (supplemental Figs. S6A and S7A). Small peaks in the wild-type sample were detected at 14.06, 14.16, 14.96, and 15.12 min and had fragmentation patterns consistent with those predicted for Yer. The composition of the waaL PS was determined to be Glc, dd-Hep, ld-Hep, and GalNAc (supplemental Figs. S6B and S7B). Kdo was also detected in both the wild-type and waaL samples. These data demonstrated that the wild-type PS contains FucNAc, whereas the waaL PS does not. In addition, the level of GalNAc was higher in the wild-type PS than the waaL PS (supplemental Fig. S7). The putative Yer peaks at 14.06, 14.16, 14.96, and 15.12 min were not detected in the waaL PS. The absence of GlcNAc in both PS samples suggests that the GlcNAc detected in the LPS samples originates from the lipid A structure. The appearance of dd-Hep only after HF treatment clearly indicated the presence of a phosphate group on the dd-Hep residue in the PS from both strains (supplemental Fig. S7). A small amount of ribose, most likely originating from RNA, was detected in all PS samples.
MS Analyses of LPS
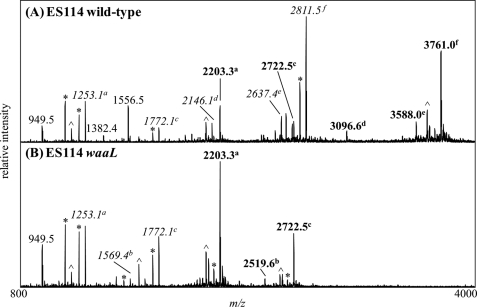
To make the LPS more amendable to MS analyses, the LPS samples were O-deacylated, using anhydrous hydrazine, to generate O-LPS as described previously (23). Initial evaluation of the O-LPS by MALDI-MS analyses demonstrated a clear difference between the wild-type and waaL samples (Fig. 5). The main glycoform observed in the wild-type O-LPS was at m/z 3761 (Fig. 5A). Minor glycoforms were detected at m/z 3588, 3096, 2722, and 2203. Examination of the waaL O-LPS showed that the major glycoforms were at m/z 2203 and 2722 (Fig. 5B). Both of the glycoforms detected in the waaL sample were also detected as minor glycoforms in the wild-type samples. These results demonstrated that the waaL O-LPS has a truncated structure compared with the wild-type O-LPS. Mass spectrometric analyses of the LPS from the waaL vector only control strain (BK111) and the waaL complement strain (BK110) showed spectra that were consistent with the waaL and wild-type data, respectively (supplemental Fig. S8), further confirming that the differences seen in the wild-type and waaL strains are due to a mutation in waaL.
FIGURE 5.
Negative ion vMALDI-LIT mass spectra of O-LPS from ES114 wild-type (A) and ES114 waaL (B) strains. Masses labeled in boldface correspond to the predominant glycoforms present in the samples. OS prompt fragments are labeled in italic. The superscript letters a–f correlate the OS prompt fragments with their intact O-LPS masses. Masses labeled with an asterisk designate major masses minus water or CO2. The neutral loss of phosphoric acid, H3PO4, from major masses are indicated with a [caret].
To investigate the waaL and wild-type LPS structures further, the O-LPS samples were treated with HF to dephosphorylate the LPS and liberate the PS from the lipid A. The PS was subsequently analyzed by MALDI-MS in both the positive or negative ion mode (supplemental Figs. S9 and S10).
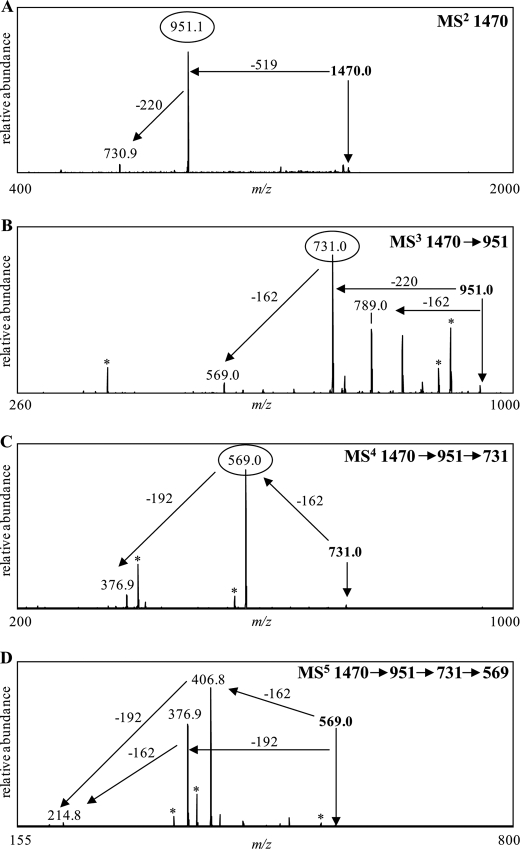
To determine the individual components of the LPS structures, multistage mass spectrometric (MSn) analyses of the dephosphorylated waaL PS was carried out in the positive ion mode. The PS corresponding to the major waaL glycoform was observed in its sodiated form at m/z 1470 (supplemental Fig. S9). MS/MS analyses of the sodiated monoisotopic mass [M + Na]+ = 1470 Da generated one major fragment at m/z 951, corresponding to a loss of 519 Da (Fig. 6A). Based on composition analyses, the loss of 519 Da would correspond to the loss of one GalNAc (203 Da) and one 316-Da component. MS3 fragmentation of the m/z 951 peak resulted in two major fragments at m/z 789 and 731, corresponding to a loss of 162 Da (Glc) and 220 Da (Kdo), respectively. MS4 fragmentation of the precursor ion at m/z 731 generated one major fragment at m/z 569 (−162 Da), corresponding to the loss of Glc (Fig. 6C). MS5 fragmentation of the precursor ion at m/z 569 produced two major fragments at m/z 406 and 377, corresponding to the loss of one Glc (−162 Da) or one Hep (−192 Da), respectively (Fig. 6D). These fragments subsequently lost either Hep or Glc, resulting in the generation of a fragment at m/z 215 that corresponds to the sodiated monoisotopic mass of Hep. These data demonstrated that the dephosphorylated waaL PS or the “core” consists of two Hep, one Kdo, one GalNAc, two Glc, and one unknown 316-Da component. We compared these data with the waaL OS prompt fragments, which contain phosphate groups, to determine what the phosphate components are. Fig. 5B shows the negative ion MALDI-MS data from waaL O-LPS. The deprotonated OS prompt fragment observed at m/z 1772 corresponds to the intact structure seen at m/z 2722. The 326-Da mass difference between the PS (M = 1447 Da) and OS prompt fragment (M = 1773 Da) indicates that the phosphorylated waaL PS contained phosphate (80 Da) and two phosphoethanolamine (2 PEA, 246 Da) groups.
FIGURE 6.
Positive-ion vMALDI-LIT mass spectra of HF-treated waaL O-LPS (dephosphorylated PS). After HF treatment, the sodiated monoisotopic mass corresponding to the major glycoform present in waaL was observed at m/z 1470.0 (supplemental Fig. S9). MALDI-MSn analyses were subsequently performed on this dephosphorylated PS. The parent ion at m/z 1470 was fragmented to yield the product ion at m/z 951 (A). Product ions at m/z 951 (B), m/z 731 (C), and m/z 569 (D) were sequentially fragmented to determine the composition of the parent mass. These analyses showed that the glycoform corresponding to the ion at m/z 1470 is composed of 1 Kdo, 2 Hep, 2 Hex, and two sugars with a combined mass of 519 Da. Masses labeled with an asterisk designate major masses minus water or CO2.
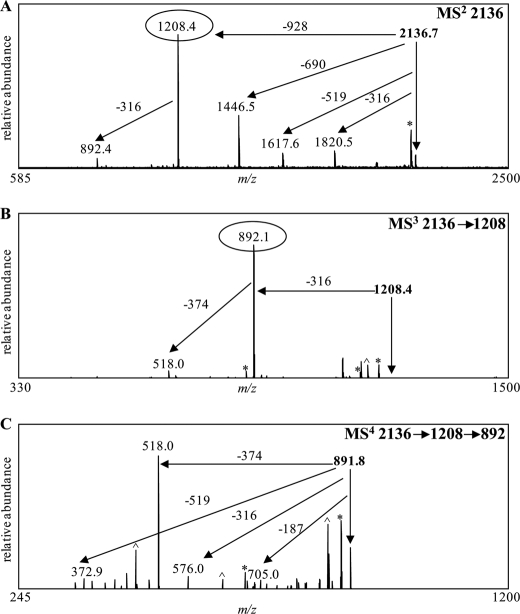
Similarly, MSn analyses of the dephosphorylated wild-type PS were carried out in the negative ion mode. The major deprotonated ion in the wild-type PS sample was observed at m/z 2136 (supplemental Fig. S10). The expected dephosphorylated PS ion at m/z 2485, corresponding to the major glycoform observed in the wild-type O-LPS sample (at m/z 2811) minus 326 Da from phosphate components, was not observed in our experiments. Instead the major ion observed in the dephosphorylated wild-type PS (at m/z 2136) corresponded to a structure that was 348 Da less than the structure observed in the wild-type O-LPS spectrum. Composition analyses suggested that the components missing from the wild-type PS after HF treatment were two Yer residues with a nominal mass of 174 Da each. It was previously reported that Yer is acid-labile, and this could account for the absence of these sugars after treatment with HF (38). Subsequently, the major ion observed in the dephosphorylated wild-type PS at m/z 2136 was investigated by MSn analyses (Fig. 7). MS/MS fragmentation of this precursor ion generated one major fragment ion at m/z 1208, corresponding to the loss of part of the core (−928 Da), consisting of Kdo, 2 Hep, and 2 Glc (Fig. 7A). Three minor fragment ions were also observed at m/z 1446, 1617, and 1820. MS3 fragmentation of the peak at m/z 1208 resulted in one major fragment ion at m/z 892, corresponding to a loss of the same unknown 316-Da moiety noted previously (Fig. 7B). MS4 fragmentation of the precursor ion at m/z 892 generated one major deprotonated fragment ion at m/z 518, corresponding to the loss of 374 Da (Fig. 7C). Composition analyses suggested that the loss of 374 Da was most likely due to the loss of two FucNAc sugars that have a nominal mass of 187 Da each. The remaining 519-Da component was determined to consist of GalNAc and a 316-Da component.
FIGURE 7.
Negative ion vMALDI-LIT mass spectra of HF-treated wild-type O-LPS. After HF treatment, the predominant deprotonated monoisotopic mass observed in the wild-type sample was at m/z 2136 (supplemental Fig. S10). MALDI-MSn analyses were performed on the parent ion at m/z 2136 (A). Fragment ions at m/z 1208 and 892 were sequentially fragmented to determine the composition of the parent mass as shown in B and C, respectively. Masses labeled with an asterisk designate major masses minus water or CO2.
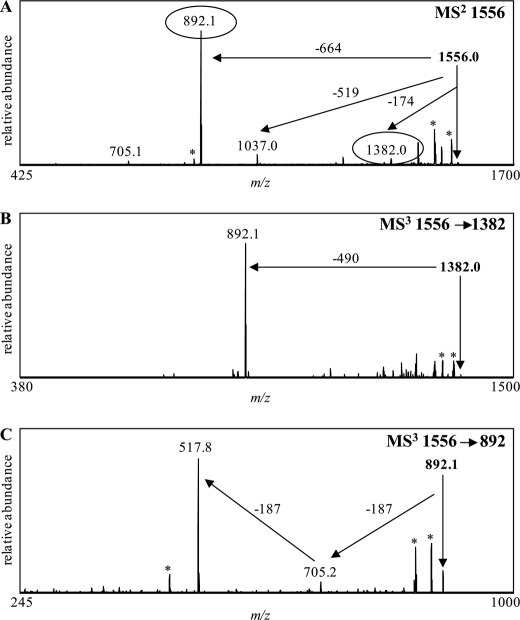
These data indicated that the wild-type dephosphorylated PS consists of the core plus two FucNAc residues and one 316-Da component. The 316-Da component was determined to be 8-epi-legionaminic acid by NMR analyses (see below). In addition, comparisons of the dephosphorylated PS with the O-LPS indicated that two Yer sugars (174 Da each) were components of the wild-type O-antigen. GC-MS and NMR (see below) both confirmed the presence of Yer in the O-antigen of the wild-type LPS. To lend additional support to the presence of the Yer residues, we targeted an OS prompt fragment, at m/z 1556 (Fig. 8), generated from the wild-type O-LPS. MS/MS analysis of this m/z 1556 precursor showed a loss of 174 Da (Yer) at m/z 1382 (Fig. 8A). Fragmentation of this latter ion generated one major fragment ion at m/z 892, corresponding to the loss of 490 Da due one 316 Da sugar (8-epi-legionaminic acid) and one 174 Da sugar (Yer) (Fig. 8B). Further fragmentation of the ion observed at m/z 892 resulted in a loss of two consecutive FucNAc residues (187 Da, each) (Fig. 8C). These data further confirmed the presence of two FucNAc and two Yer residues on the wild-type LPS structure.
FIGURE 8.
Negative-ion vMALDI-LIT mass spectra of the OS prompt fragment, from wild-type O-LPS, at m/z 1556. MALDI-MSn analyses of the parent ion at m/z 1556 generated a number of fragment ions (A). Further fragmentation of these products at m/z 1382 (B) and 892 (C) was performed. Masses labeled with an asterisk designate major masses minus water or CO2.
Assignment of Yer Residues F and G
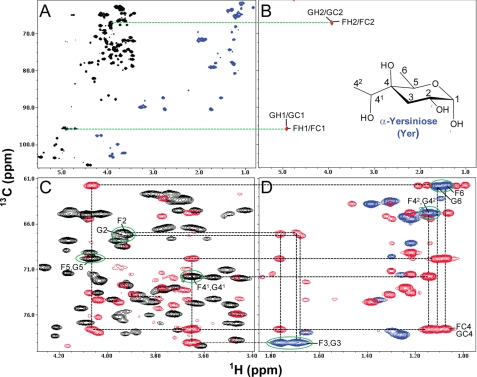
Fig. 9A shows the HMQC spectrum of the wild-type V. fischeri PS. Using selective-TOCSY-HSQC experiments (31) with a TOCSY mixing time of 120 ms for coherence transfer, spin systems were identified for the sugar residues F and G at the 1st and 2nd positions (Fig. 9B) where the peaks are labeled hereafter with the 1st letter referring to the sugar subunit and the rest of the label referring to the position on that sugar residue (could be a proton position (e.g. H1), a carbon position (e.g. C1), or just a number (e.g. 1, referring to position 1)). By comparing the HMQC and HMBC spectra (Fig. 9, C and D), the 2nd carbon of the residues F and G, whose cross-peaks are labeled as F2 and G2, was found to be connected to the H3 protons of a CH2 group with 13C chemical shift at 32.16 ppm and 1H chemical shifts at 1.76eq and 1.68–1.70ax ppm (Table 2). The 4th carbon of the residues F and G (labeled as FC4 and GC4) was a quaternary carbon with a chemical shift at 77.59 ppm (Table 2) and was found to be connected with the protons of H6 (a CH3 group), H42 (another CH3 group), H3 (a CH2 group), H41 (a CHOH group), and H5 (another CHOH group) in the HMBC spectrum. The 5th carbon of the residues F and G, whose cross-peaks are labeled as F5 and G5, was connected with the protons H6, H3, and H41. Therefore, these spin systems as traced in Fig. 9 uniquely identify α-Yer as the sugar residue whose structure and numbering are indicated in Fig. 9B. These assignments were further confirmed in the conventional two-dimensional 1H/1H DQF-COSY, TOCSY, and NOESY spectra. The chiral center of the group attached at the 4th carbon (i.e. 41 position) was not determined from the current data. The 1H and 13C chemical shifts of the Yer residues assigned in this study were consistent with the previous report in which a series of Yer analogs were synthesized and tested by NMR (39).
FIGURE 9.
HMQC (A) and selective-TOCSY-HSQC (B) as well as HMQC and HMBC overlays (C and D) of the heteronuclear NMR spectra of the wild-type V. fischeri O-antigen oligosaccharide. These data illustrate the assignments of the spin systems for the sugar residues F and G of Yer. A, HMQC spectrum is shown in black for the positive peaks and blue for the folded negative peaks. B, selective-TOCSY-HSQC spectrum, shown in red, was obtained using a selective excitation pulse at the H1 positions of the sugar residues F and G with a selective TOCSY mixing time of 120 ms. C and D, HMQC spectrum is shown in black for the positive peaks and blue for the folded negative peaks, and the HMBC spectrum is shown in red. The peaks are labeled with the following convention, i.e. the 1st letter in the labels refers to sugar subunit, and the rest of the labels refers to the position on that sugar residue. The green circled peaks in C and D indicate the HMQC cross-peaks derived from the sugar residues F and G of Yer. The dotted lines indicate the spin connectivities for these residues. F41 (or G41) and F42 (or G42) indicate the first and second positions, respectively, of the group attached to the 4th carbon on the sugar residue F (or G). FC4 and GC4 indicate the cross-peaks derived from the C4 carbon of the residues F and G, respectively. The α-Yer structure and the position labeling are indicated in B.
TABLE 2.
1H and 13C NMR chemical shifts (ppm) of the O-antigen of V. fischeri at 25 °C
| Sugar residues |
13C/1H (ppm) |
||||||||||
|---|---|---|---|---|---|---|---|---|---|---|---|
| 1 | 2 | 3 | 4 | 5 | 6 | 7 | 8 | 9 | NAc | NAc | |
| A →8)-α-8eLeg5Ac7Ac-(2→ | 176.60 | 103.01 | 43.58 | 71.04 | 55.36 | 74.26 | 56.48 | 73.79 | 16.71 | 24.88a | 24.73b |
| 2.75eq | 3.51 | 3.67 | 3.98 | 3.89 | 3.89 | 1.31 | 1.92a | 2.03b | |||
| 1.74ax | 176.58a | 176.35b | |||||||||
| B →3)-α-d-GalNAc-(1→ | 95.38 | 50.73 | 79.37 | 71.34 | 73.27 | 63.31 | 24.94c | ||||
| 4.96 | 4.23 | 3.61 | 4.16 | 3.77 | 3.68 | 2.01c | |||||
| 3.73 | 176.95c | ||||||||||
| C →3)-β-l-FucNAc-(1→ | 105.50 | 54.05 | 78.50 | 72.96 | 73.03 | 18.26 | 24.64c | ||||
| 4.38 | 3.95 | 3.78 | 3.72 | 3.77 | 1.24 | 1.95c | |||||
| 176.67c | |||||||||||
| D →3)-β-l-FucNAc-(1→ | 101.24 | 50.60 | 76.25 | 73.59 | 69.15 | 18.55 | 24.78c | ||||
| 5.00 | 4.15 | 3.96 | 4.04 | 4.07 | 1.22 | 2.01c | |||||
| 176.90c | |||||||||||
| E →4,8)-α-8eLeg5Ac7Ac-(2→ | 174.99 | 105.90 | 40.51 | 74.26 | 52.98 | 75.25 | 56.14 | 74.53 | 16.98 | 24.71a | 24.60b |
| 2.79eq | 3.56 | 3.79 | 4.11 | 3.95 | 3.82 | 1.39 | 1.88a | 1.96b | |||
| 1.54ax | 176.55a | 176.70b | |||||||||
| F α-Yer-(1→4) | 95.68 | 66.92 | 32.16 | 77.59 | 69.83 | 14.87 | 71.78d | 17.90e | |||
| 4.89 | 3.94 | 1.76eq | 4.07 | 1.08 | 3.65d | 1.15e | |||||
| 1.70ax | |||||||||||
| G α-Yer-(1→8) | 95.75 | 67.28 | 32.16 | 77.59 | 69.83 | 14.89 | 71.78d | 17.90e | |||
| 4.91 | 3.93 | 1.76eq | 4.07 | 1.11 | 3.65d | 1.15e | |||||
| 1.68ax | |||||||||||
| Minor form | |||||||||||
| A α-8eLeg5Ac7Ac-(2→ | 176.17 | 103.42 | 43.38 | 71.24 | 55.36 | 75.72 | 55.67 | 71.50 | 21.24 | 25.03a | 24.78b |
| 2.77eq | 3.51 | 3.64 | 3.94 | 3.90 | 4.06 | 1.22 | 1.92a | 2.01b | |||
| 1.76ax | 176.70a | 176.81b | |||||||||
a For 5NAc.
b For 7NAc.
c For 2NAc.
d For the first position of the group attached to the 4th carbon on the sugar ring, i.e. 41 position or the —CHOH– group.
e For the second position of the group attached to the 4th carbon on the sugar ring, i.e. 42 position or the CH3– group.
Assignment of 8-Epi-legionaminic Acid Residues A and E
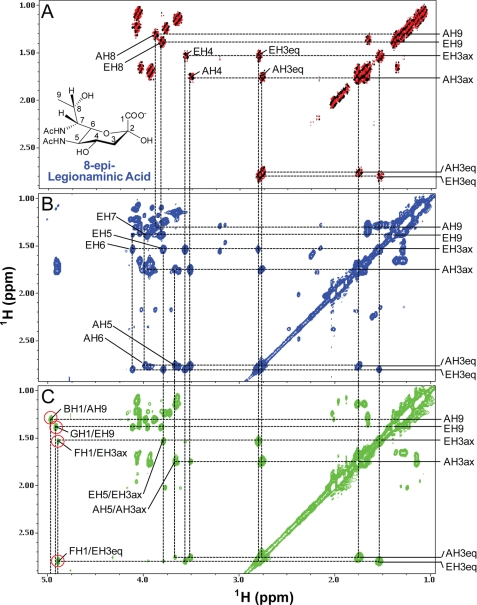
Fig. 10A shows the DQF-COSY spectrum of the wild-type V. fischeri PS. Clearly, a CH2 group at the 3rd position of the residues A and E (confirmed by the HMQC spectrum shown in Fig. 11) was assigned with the Hax (labeled as AH3ax and EH3ax) and Heq (labeled as AH3eq and EH3eq) protons that were well resolved from each other, and only the Hax proton gave a cross-peak to its vicinal proton H4. The H9 protons gave COSY cross-peaks to the H8 proton. Moreover, the H3 protons gave TOCSY cross-peaks to H4, H5, and H6, whereas H9 protons gave TOCSY cross-peaks to H8 and H7 protons (Fig. 10B). From a series of NOESY experiments with different mixing times, it was found that only the H3 axial proton (not the equatorial proton) gave strong NOEs to H5 proton (Fig. 10C), indicating that H5 was in axial position or the 5-N-acetyl group was in equatorial position. These data indicated that the chiral center at the position 5 of this residue was different from that of the previously reported structure of N-acetyl-pseudaminic acid (40). These NMR assignments were consistent with the structure of 8-epi-legionaminic acid as shown in Fig. 10A.
FIGURE 10.
DQF-COSY (A), TOCSY (B), and NOESY (C) spectra of the wild-type V. fischeri O-antigen oligosaccharide. These data illustrate the assignments of the spin systems for the sugar residues A and E of 8-epi-legionaminic acids. The DQF-COSY spectrum (A) is shown in black and red, and the TOCSY (B) and NOESY (C) spectra are shown in blue and green, respectively. Some of the diagonal peaks of residues A and E are labeled along the right side of the panels. Some of the off-diagonal cross-peaks of the residues A and E are also labeled. The 1st letter in the labels refers to sugar subunit and the rest in the labels refers to the position on that sugar residue. The inter-glycosidic NOESY cross-peaks are indicated by red circles in C. The TOCSY spectrum was collected with a mixing time of 103 ms, and the NOESY spectrum was acquired with a mixing time of 160 ms. The structure and position labeling of the 8-epi-legionaminic acid are indicated in A.
FIGURE 11.
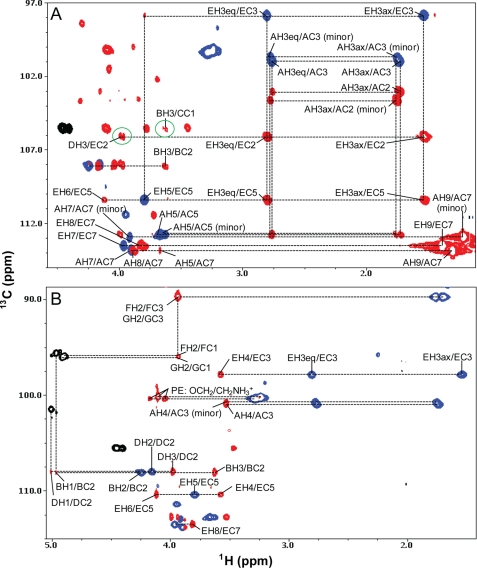
Overlays of HMQC and HMBC heteronuclear NMR spectra (A) and HMQC and H2BC heteronuclear NMR spectra (B) of the V. fischeri O-antigen oligosaccharide. These data illustrate the assignments of the spin systems for the sugar residues A and E of 8-epi-legionaminic acids, as well as for the sugar residues B, D, F, and G. In both A and B, the HMQC spectra are shown in black for the positive peaks and blue for the folded negative peaks. The HMBC spectrum in A and the H2BC spectrum in B are shown in red. A, some of the cross-peaks belonging to the spin systems of the residues A and E are labeled, and the observed inter-glycosidic cross-peaks are also indicated by green circles. The dotted lines indicate the spin connectivities. The 1st letter in the labels refers to sugar subunit, and the rest in the labels refers to the position on that sugar residue.
The spin systems of the residues A and E of 8-epi-legionaminic acid were further confirmed from a combination of the 1H/13C two-dimensional heteronuclear HMQC, HMBC, and H2BC (29, 30) spectra (Fig. 11). For example, the 7th carbon of residue A (AC7) (with the attached AcNH group) gave a strong HMBC cross-peak to a methyl group H9 (AH9/AC7) and medium/weak HMBC cross-peaks to H8 and H5 (AH8/AC7 and AH5/AC7, respectively) (Fig. 11A), whereas the 7th carbon of residue E gave a strong HMBC cross-peak to another methyl group H9 (EH9/EC7) and medium HMBC cross-peaks to H8 (EH8/EC7) (Fig. 11A). The 5th carbon of residue E gave 2JCH couplings to H4 (EH4/EC5) and H6 (EH6/EC5) in the H2BC spectrum (Fig. 11B), 3JCH couplings to H3eq and H3ax (EH3eq/EC5 and EH3ax/EC5, respectively), and 2JCH couplings to H6 (EH6/EC5) in the HMBC spectrum (Fig. 11A). Furthermore, the H3 protons of the residues A and E showed HMBC cross-peaks to the carbon atoms of C1 (data not shown), C2 (EH3ax/EC2, EH3eq/EC2, AH3ax/AC2), and C5 (EH3ax/EC5) (Fig. 11A). The 3rd carbon of the residues A and E clearly gave 2JCH H2BC connectivity to H4 proton (EH4/EC3 and AH4/AC3) (Fig. 11B).
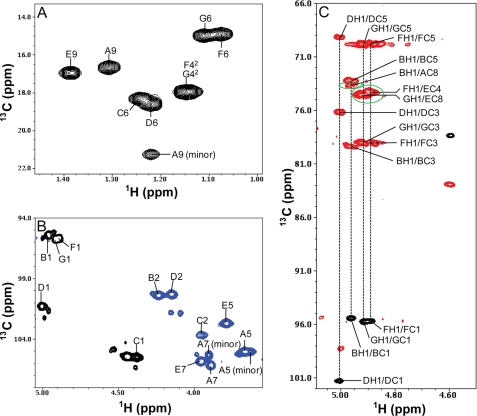
Interestingly, during the NMR assignments, another set of peaks corresponding to 8-epi-legionaminic acid was identified (designated as residue A minor form, in ∼40% quantity). As shown clearly in Fig. 11, residue A minor form exhibited slightly different chemical shifts from the major form of residue A. For example, the cross-peaks AH3ax/AC3 (minor) and AH3ax/AC2 (minor) were clearly shifted away from AH3ax/AC3 and AH3ax/AC2, respectively (Fig. 11A). Moreover, the detected HMBC cross-peak of AH9/AC7 (minor) showed a very large chemical shift change from the cross-peak of AH9/AC7 (Fig. 11A). Most importantly, the 13C chemical shift of the methyl group A9 (minor) was very different and shifted downfield by 4.53 ppm from the corresponding peak A9 of the major form (Fig. 12A). The 1H and 13C chemical shifts of the 8-epi-legionaminic acid residue A minor form assigned in this study were in good agreement with those reported previously for the chemically synthesized 8-epi-legionaminic acid (41).
FIGURE 12.
HMQC spectrum in the methyl region (A) and the C1H and CHNHAc region (B), and the overlay of HMQC and HMBC heteronuclear NMR spectra (C) of the wild-type V. fischeri O-antigen oligosaccharide. The HMQC spectrum is shown in black for the positive peaks and blue for the folded negative peaks. The HMBC spectrum is shown in red. C illustrates the interglycosidic linkage assignments between residues A and B, residues E and F, and residues E and G. The cross-peaks are labeled, and the interglycosidic cross-peaks are circled in green. The 1st letter in the labels refers to sugar subunit, and the rest in the labels refers to the position on that sugar residue.
Assignment of Other Sugar Residues
Fig. 12, A and B, shows the assignments in the methyl region and the C1H and CHNHAc region of the HMQC spectrum of the O-antigen oligosaccharide of V. fischeri. Parts of the spin systems of residue B of GalNAc and the residues C and D of FucNAc are shown in Figs. 11 and 12. The complete assignments of the O-antigen residues of V. fischeri are listed in Table 2.
O-antigen Structure
The sugar residues F and G of Yer are linked via α1–4 and α1–8 glycosidic linkages to the 4th and 8th carbons of residue E of 8-epi-legionaminic acid as evidenced by the observed HMBC cross-peaks FH1/EC4 and GH1/EC8, respectively (Fig. 12C). These glycosidic linkage assignments were consistent with the observed strong NOEs between the H1 proton of residue F and the CH2 group (at the 3rd position) of residue E (FH1/EH3ax and FH1/EH3eq) (Fig. 10C), and between the H1 proton of residue G and the H9 methyl protons of residue E (GH1/EH9) (Fig. 10C).
The presence of the HMBC cross-peak BH1/AC8 (Fig. 12C) demonstrated that residue B of GalNAc is linked via an α1–8 glycosidic linkage to the 8th carbon of residue A of 8-epi-legionaminic acid. This assignment was also supported by the observed strong NOE between the H1 proton of residue B and the H9 methyl proton of residue A (BH1/AH9) (Fig. 10C).
Residue E of 8-epi-legionaminic acid is linked via an α2–3 glycosidic linkage to the 3rd carbon of residue D of FucNAc as revealed by the detected DH3/EC2 cross-peak in the HMBC spectrum (Fig. 11A). The observed BH3/CC1 cross-peak in the HMBC spectrum demonstrated that residue C of FucNAc is connected to residue B via a β1–3 glycosidic linkage (Fig. 11A). The observed HMBC cross-peak DH1/CC3 at a lower contour level indicated that residue D is connected to residue C via a β1–3 glycosidic linkage. This assignment was consistent with the observed strong inter-residue NOE between the H1 proton of residue D and the H3 proton of residue C.
Residues A and E had chemical shifts of 16.71 and 16.98 ppm for the C9 carbon, respectively (Table 2). However, residue A minor form had a chemical shift of 21.24 ppm for the same carbon. This large chemical shift perturbation (Δδ = ∼4.5 ppm) likely reflects the differences in the attachment at the 8th carbon. The 21.24 ppm of the C9 carbon of residue A minor form was consistent with having no attachment at the 8th carbon because the chemically synthesized 8-epi-legionaminic acid monosaccharide also has a C9 chemical shift at ∼20.0 ppm (41).
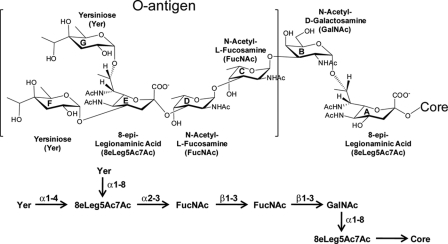
Therefore, the NMR data indicated that the oligosaccharide sample from the wild-type V. fischeri contains a major form (∼60%) consisting of the O-antigen and the core component, and a minor form (∼40%) composed of 8-epi-legionaminic acid (residue A) linked to the core. The assignments of sugar residues to the core or O-antigen components were based on differences observed, using NMR, MS, and GC-MS, in the wild-type and waaL LPS samples. Because attachment of the O-antigen to the LPS core is dependent on the O-antigen ligase WaaL, mutants that lack a functional O-antigen ligase would express an LPS consisting of only the core. The detection, by NMR and MS, of GalNAc (residue B) and one 8-epi-legionaminic acid component (residue A) in the waaL sample indicated that these were components of the core. Therefore, these data suggested that the O-antigen ligase of V. fischeri ligates the O-antigen to the 3rd carbon of residue B and that the O-antigen is composed of residues C–G. The final oligosaccharide structure of the O-antigen as well as some of the core components are shown in Fig. 13.
FIGURE 13.
Determined structure of the O-antigen plus some of the core components of V. fischeri. The sugar subunits are labeled A–G. The linear representation of the oligosaccharide structure is shown in the lower panel.
PS from the waaL Mutant
Extensive NMR data were also collected on the PS sample from the V. fischeri waaL O-antigen ligase mutant. The supplemental Figs. S11 and S12 show the one-dimensional 31P NMR spectra and two-dimensional 31P/1H COSY spectra, respectively, of the PS samples from the wild-type and waaL mutant strains of V. fischeri. The one-dimensional 31P NMR spectra of the wild-type and mutant samples were comparable, and both had two peaks with similar chemical shifts, although the peak centered at −0.8 ppm was much more heterogeneous in the mutant sample than the wild-type sample. The 31P/1H COSY spectra indicated that there were two PEA groups with their phosphate groups showing J-couplings to the ethanolamine protons as well as to the core residues in both the wild-type and mutant samples (supplemental Fig. S12). Therefore, these data clearly indicated that the PEA groups were attached to the core component. However, because of the sample heterogeneity, further details of the core structure were not determined in this NMR study.
DISCUSSION
In this study we compared the LPS structures of V. fischeri wild-type strain ES114 to the LPS O-antigen ligase mutant, ES114 waaL. Because an O-antigen ligase mutant cannot ligate the O-antigen to the LPS core, the LPS structure present in the waaL mutant strain should consist of only the core structure linked to the lipid A. By comparing the LPS structures of the waaL mutant to the wild type, it is possible to elicit which components of the LPS are part of the core structure and which are constituents of the O-antigen.
The core structure of V. fischeri strain ES114 was determined utilizing GC-MS, MALDI-MS, and NMR analyses of both the wild-type and waaL mutant strains. These data showed that the core consists of two PEA, one phosphate, two Hep (one ld-Hep and one dd-Hep), two Glc, one Kdo, one GalNAc, and one 8-epi-legionaminic acid. Most of the components (Hep, Glc, Kdo, GalNAc, PEA, and phosphate) seen in the core are prototypical constituents of core components found in numerous Gram-negative bacteria, including other Vibrio spp. (24, 42–48). In addition to these typical components, the V. fischeri core also contains the unusual sugar 8-epi-legionaminic acid. Derivatives of this sugar have also been observed in the LPS, capsule, and/or flagellin from Vibrio vulnificus, Rhizobium sp. NGR234, Aeromonas caviae, Helicobacter pylori, and Campylobacter jejuni (40, 45, 49–52). Moreover, glycosylation of the flagella of H. pylori and C. jejuni with derivatives of legionaminic acid (53) was shown to be necessary for proper motility (51, 54).
Despite the heterogeneity of the oligosaccharide samples that prevented us from completely determining the core structure, NMR analyses of the wild-type PS sample did show that the core components of GalNAc and 8-epi-legionaminic acid are connected via an α1–8 linkage (Fig. 13). MALDI-MSn analyses suggested that Glc is the next sugar in the core structure, where it is linked to 8-epi-legionaminic acid at the reducing terminus. Because the core structures from a number of Gram-negative organisms have been determined, some predictions regarding the structural layout of the remainder of the core can be made. It is well established that Kdo links the LPS core to the lipid A. Previous studies from Vibrio spp. demonstrated that the LPS contained a single phosphorylated Kdo (46, 55, 56). The presence of a single phosphorylated Kdo has also been reported in the LPS from other Gram-negative bacteria, such as Bordetella pertussis, Haemophilus ducreyi, and Haemophilus influenzae (24, 46, 57, 58), suggesting that the phosphate we detected is attached to the Kdo in the core. Further information is needed to elucidate the structural arrangement of the remaining core components.
Using NMR, MS, and GC-MS, the V. fischeri O-antigen was determined to be a pentasaccharide consisting of two FucNAc, one 8-epi-legionaminic acid, and two Yer residues (Fig. 13). The two FucNAc residues are consecutively linked and serve as the attachment point between the core components and the remainder of the O-antigen. The two Yer residues are the terminal sugars of the O-antigen structure and are linked to the 4th and 8th positions of 8-epi-legionaminic acid. Thus, the O-antigen contains two unusual sugars, 8-epi-legionaminic acid, which was also present in the core, and Yer. Yer has been previously found in the O-antigen from other bacteria, including Burkholderia brasiliensis, Legionella spp., Rhizobium spp., and Yersinia spp (38, 40, 59, 60). Both MS and GC-MS analyses demonstrated that neither FucNAc nor Yer was found in any of the spectra from the waaL LPS indicating that FucNAc and Yer are O-antigen-specific components in V. fischeri ES114 LPS.
Analysis of the LPS samples from both the wild-type and waaL mutant by SDS-PAGE showed that the typical ladder-like banding pattern traditionally associated with the O-antigen repeat unit was absent in both V. fischeri strains. Instead, the wild-type LPS appeared as one predominant band containing core plus O-antigen, whereas the waaL LPS appeared as a faster migrating, lower molecular weight band containing only the core. The absence of the O-antigen ladder from the LPS, when examined by SDS-PAGE, has been previously observed for V. fischeri strain HMK as well as other Vibrio spp. (7, 46, 57, 61–63). In addition, both NMR and MS analyses (data not shown) suggested that the LPS from V. fischeri strain ES114 lacks repeating units of the O-antigen. It is unclear why some of the Vibrio spp. lack O-antigen repeat units. It is possible that these bacteria lack the O-antigen polymerase, Wzy; however, because the polymerase genes are not well conserved across bacterial species, identifying a wzy homologue has proven difficult.
Prior to this study, the role that the V. fischeri O-antigen plays in colonization of the squid E. scolopes was unknown. In this study, we examined the colonization properties of the ES114 wild-type, waaL mutant, and waaL complement strains. Our studies demonstrated that the waaL mutant strain of V. fischeri has an animal colonization defect that can be restored through complementation. When luminescence levels were low in animals colonized by the waaL mutant (Fig. 2A), it was due to decreased colonization by the symbiont, as visualized by confocal microscopy (Fig. 2C) or verified by plating animal light organs for CFUs. These data are consistent with the established finding that luminescence levels correlate with CFUs, with the exception of colonization by bacterial mutants defective in light production (64).
Defects in V. fischeri colonization of E. scolopes may be described in terms of initiation, accommodation, or persistence (65). Mutants in these three behaviors consequently fail to establish symbiosis with the animal (or are delayed in that establishment), fail to fully colonize the light organ at wild-type levels, or fail to persist indefinitely in the light organ, respectively. We detected significant differences in wild-type and waaL mutant luminescence 24 h into symbiosis (Fig. 2A). At 44 h, the difference remained significant, but all animals, including waaL mutant-colonized animals, had detectable luminescence (supplemental Fig. S2). Our results are consistent with a defect in the initiation phase. In animals exposed to both wild-type and waaL mutant bacteria, the wild-type bacteria appear to establish early, during the period when the waaL mutant is defective, and subsequently remain dominant (Fig. 3). From our experiments, we cannot rule out the possibility that the waaL mutant's defect in animal colonization is simply a result of a motility defect, as luminescence at 24 h was not significantly different between waaL mutant-colonized animals and those colonized by the flaD mutant (Fig. 2A). The flaD mutant is thought to be a “pure” motility mutant, without a predicted LPS biogenesis defect.3 The precise structural effect of the flaD mutation is not known, but it could result in fewer or shorter flagellin filaments, without altering flagellar rotation (36, 66).
These results prompt the question of why a mutation affecting a surface antigen affects bacterial motility. In fact, mutation of waaL has been shown in several studies to cause defects in swarming behavior, without the swimming motility defects seen in our study of V. fischeri (Fig. 1). For Salmonella enterica serovar Typhimurium, it has been suggested that the swarming phenotype is due to surfactant properties of the O-antigen (67). It is notable that whatever LPS was discharged from wild-type V. fischeri in our competition experiment did not rescue the waaL mutant's colonization defect (Fig. 3). In Proteus mirabilis, a mutation in waaL affects regulation of flagellar gene synthesis (flhDC genes), perhaps through the Rcs system. The resulting swarming defect can be reversed by overexpressing flhDC, without restoring the O-antigen itself (68). The Rcs system and flhDC have also been implicated in swarming and swimming deficiencies associated with mutation of LPS core synthesis genes in E. coli (69). Apart from flagellum-mediated motility, defects in O-antigen synthesis have been associated with reduction of social “gliding” motility in Myxococcus xanthus (70). The relevance of these data to the V. fischeri swimming defect is unclear at this time, as V. fischeri has not been reported to utilize swarming or gliding motility, and the data from E. coli mentioned above involve other portions of the LPS molecule than the O antigen. Finally, because V. fischeri has a sheathed flagellum (64), we speculate that the waaL mutant's altered LPS structure may affect flagellar function. Further experiments are necessary to verify this hypothesis.
Supplementary Material
Acknowledgment
Mass spectrometric instrumentation for this study was provided by the mass spectrometry core facility at the Buck Institute for Research on Aging.
This work was supported, in whole or in part, by National Institutes of Health Grants PO1 AI44642 and RO1 AI24616 (to B. W. G. and M. A. A.), R01 AI50661 (to M. M.-N.), and R01 RR 12294 and IOS 0817232 (to E. G. R. and M. M.-N.). This work was also supported by University of Wisconsin Medical Scientist Training Program (to the M. M.-N. laboratory).

This article contains supplemental Figs. S1–S12.
C. A. Brennan, M. J. Mandel, and E. G. Ruby, manuscript in preparation.
- PS
- polysaccharide
- O-LPS
- O-deacylated LPS
- HF
- hydrofluoric acid
- LIT
- linear ion trap
- RCI
- relative competitive index
- Kdo
- 2-keto-3-deoxyoctonate
- Hep
- heptose
- Yer
- yersiniose
- FucNAc
- N-acetylfucosamine
- PEA
- phosphoethanolamine.
REFERENCES
- 1. McFall-Ngai M. J., Ruby E. G. (1991) Symbiont recognition and subsequent morphogenesis as early events in an animal-bacterial mutualism. Science 254, 1491–1494 [DOI] [PubMed] [Google Scholar]
- 2. Nyholm S. V., Stabb E. V., Ruby E. G., McFall-Ngai M. J. (2000) Establishment of an animal-bacterial association. Recruiting symbiotic Vibrios from the environment. Proc. Natl. Acad. Sci. U.S.A. 97, 10231–10235 [DOI] [PMC free article] [PubMed] [Google Scholar]
- 3. Nyholm S. V., McFall-Ngai M. J. (2004) The winnowing. Establishing the squid-Vibrio symbiosis. Nat. Rev. Microbiol. 2, 632–642 [DOI] [PubMed] [Google Scholar]
- 4. Foster J. S., Apicella M. A., McFall-Ngai M. J. (2000) Vibrio fischeri lipopolysaccharide induces developmental apoptosis, but not complete morphogenesis, of the Euprymna scolopes symbiotic light organ. Dev. Biol. 226, 242–254 [DOI] [PubMed] [Google Scholar]
- 5. Koropatnick T. A., Engle J. T., Apicella M. A., Stabb E. V., Goldman W. E., McFall-Ngai M. J. (2004) Microbial factor-mediated development in a host-bacterial mutualism. Science 306, 1186–1188 [DOI] [PubMed] [Google Scholar]
- 6. Phillips N. J., Adin D. M., Stabb E. V., McFall-Ngai M. J., Apicella M. A., Gibson B. W. (2011) The lipid A from Vibrio fischeri lipopolysaccharide. A unique structure bearing a phosphoglycerol moiety. J. Biol. Chem. 286, 21203–21219 [DOI] [PMC free article] [PubMed] [Google Scholar]
- 7. Pupo E., Phillips N. J., Gibson B. W., Apicella M. A., Hardy E. (2004) Matrix-assisted laser desorption/ionization-time of flight-mass spectrometry of lipopolysaccharide species separated by slab-polyacrylamide gel electrophoresis. High resolution separation and molecular weight determination of lipooligosaccharides from Vibrio fischeri strain HMK. Electrophoresis 25, 2156–2164 [DOI] [PubMed] [Google Scholar]
- 8. Abeyrathne P. D., Daniels C., Poon K. K., Matewish M. J., Lam J. S. (2005) Functional characterization of WaaL, a ligase associated with linking O-antigen polysaccharide to the core of Pseudomonas aeruginosa lipopolysaccharide. J. Bacteriol. 187, 3002–3012 [DOI] [PMC free article] [PubMed] [Google Scholar]
- 9. Abeyrathne P. D., Lam J. S. (2007) WaaL of Pseudomonas aeruginosa utilizes ATP in in vitro ligation of O-antigen onto lipid A-core. Mol. Microbiol. 65, 1345–1359 [DOI] [PubMed] [Google Scholar]
- 10. Stabb E. V., Reich K. A., Ruby E. G. (2001) Vibrio fischeri genes hvnA and hvnB encode secreted NAD(+)-glycohydrolases. J. Bacteriol. 183, 309–317 [DOI] [PMC free article] [PubMed] [Google Scholar]
- 11. Dunlap P. V. (1989) Regulation of luminescence by cyclic AMP in cya-like and crp-like mutants of Vibrio fischeri. J. Bacteriol. 171, 1199–1202 [DOI] [PMC free article] [PubMed] [Google Scholar]
- 12. Boettcher K. J., Ruby E. G. (1990) Depressed light emission by symbiotic Vibrio fischeri of the sepiolid squid Euprymna scolopes. J. Bacteriol. 172, 3701–3706 [DOI] [PMC free article] [PubMed] [Google Scholar]
- 13. Lyell N. L., Dunn A. K., Bose J. L., Vescovi S. L., Stabb E. V. (2008) Effective mutagenesis of Vibrio fischeri by using hyperactive mini-Tn5 derivatives. Appl. Environ. Microbiol. 74, 7059–7063 [DOI] [PMC free article] [PubMed] [Google Scholar]
- 14. O'Toole G. A., Pratt L. A., Watnick P. I., Newman D. K., Weaver V. B., Kolter R. (1999) Genetic approaches to study of biofilms. Methods Enzymol. 310, 91–109 [DOI] [PubMed] [Google Scholar]
- 15. Dunn A. K., Millikan D. S., Adin D. M., Bose J. L., Stabb E. V. (2006) New rfp- and pES213-derived tools for analyzing symbiotic Vibrio fischeri reveal patterns of infection and lux expression in situ. Appl. Environ. Microbiol. 72, 802–810 [DOI] [PMC free article] [PubMed] [Google Scholar]
- 16. Mandel M. J., Wollenberg M. S., Stabb E. V., Visick K. L., Ruby E. G. (2009) A single regulatory gene is sufficient to alter bacterial host range. Nature 458, 215–218 [DOI] [PMC free article] [PubMed] [Google Scholar]
- 17. Montgomery M. K., McFall-Ngai M. J. (1993) Late postembryonic development of the symbiotic light organ of Euprymna scolopes (Cephalopoda: Sepiolidae). Biol. Bull. 184, 296–308 [DOI] [PubMed] [Google Scholar]
- 18. Altura M. A., Stabb E., Goldman W., Apicella M., McFall-Ngai M. J. (2011) Attenuation of host NO production by MAMPs potentiates development of the host in the squid-Vibrio symbiosis. Cell. Microbiol. 13, 527–537 [DOI] [PMC free article] [PubMed] [Google Scholar]
- 19. Wollenberg M. S., Ruby E. G. (2011) Phylogeny and fitness of Vibrio fischeri from the light organs of Euprymna scolopes in two Oahu Hawaii populations. ISME J. 6, 352–362 [DOI] [PMC free article] [PubMed] [Google Scholar]
- 20. Lee P. N., McFall-Ngai M. J., Callaerts P., de Couet H. G. (2009) Confocal immunocytochemistry of embryonic and juvenile Hawaiian bobtail squid (Euprymna scolopes) tissues. Cold Spring Harbor Protoc. [DOI] [PubMed] [Google Scholar]
- 21. Apicella M. A. (2008) Isolation and characterization of lipopolysaccharides. Methods Mol. Biol. 431, 3–13 [DOI] [PubMed] [Google Scholar]
- 22. Lesse A. J., Campagnari A. A., Bittner W. E., Apicella M. A. (1990) Increased resolution of lipopolysaccharides and lipooligosaccharides utilizing tricine-sodium dodecyl sulfate-polyacrylamide gel electrophoresis. J. Immunol. Methods 126, 109–117 [DOI] [PubMed] [Google Scholar]
- 23. Allen S., Zaleski A., Johnston J. W., Gibson B. W., Apicella M. A. (2005) Novel sialic acid transporter of Haemophilus influenzae. Infect. Immun. 73, 5291–5300 [DOI] [PMC free article] [PubMed] [Google Scholar]
- 24. Phillips N. J., Apicella M. A., Griffiss J. M., Gibson B. W. (1992) Structural characterization of the cell surface lipooligosaccharides from a nontypable strain of Haemophilus influenzae. Biochemistry 31, 4515–4526 [DOI] [PubMed] [Google Scholar]
- 25. Rance M., Sørensen O. W., Bodenhausen G., Wagner G., Ernst R. R., Wüthrich K. (1983) Improved spectral resolution in cosy 1H NMR spectra of proteins via double quantum filtering. Biochem. Biophys. Res. Commun. 117, 479–485 [DOI] [PubMed] [Google Scholar]
- 26. Bax A., Davis D. G. (1985) MLEV-17-based two-dimensional homonuclear magnetization transfer spectroscopy. J. Magn. Reson. 65, 355–360 [Google Scholar]
- 27. Wuthrich K. (1986) NMR of Proteins and Nucleic Acids, John Wiley & Sons, Inc., New York [Google Scholar]
- 28. Bax A., Summers M. F. (1986) Proton and carbon-13 assignments from sensitivity-enhanced detection of heteronuclear multiple-bond connectivity by 2D multiple quantum NMR. J. Am. Chem. Soc. 108, 2093–2094 [Google Scholar]
- 29. Nyberg N. T., Duus J. O., Sørensen O. W. (2005) Heteronuclear two-bond correlation. Suppressing heteronuclear three-bond or higher NMR correlations while enhancing two-bond correlations even for vanishing 2J(CH). J. Am. Chem. Soc. 127, 6154–6155 [DOI] [PubMed] [Google Scholar]
- 30. Petersen B. O., Vinogradov E., Kay W., Würtz P., Nyberg N. T., Duus J. Ø., Sørensen O. W. (2006) H2BC. A new technique for NMR analysis of complex carbohydrates. Carbohydr. Res. 341, 550–556 [DOI] [PubMed] [Google Scholar]
- 31. Sato H., Kajihara Y. (2005) An unambiguous assignment method by two-dimensional selective-TOCSY-HSQC and selective-TOCSY-DQFCOSY and structural analysis by selective-TOCSY-NOESY experiments of a biantennary undecasaccharide. Carbohydr. Res. 340, 469–479 [DOI] [PubMed] [Google Scholar]
- 32. Chary K. V., Rastogi V. K., Govil G. (1993) An efficient 2D NMR technique HELCO for heteronuclear [31P-1H] long-range correlation. J. Magn. Reson. Series B 102, 81–83 [Google Scholar]
- 33. Olsson U., Lycknert K., Stenutz R., Weintraub A., Widmalm G. (2005) Structural analysis of the O-antigen polysaccharide from Escherichia coli O152. Carbohydr. Res. 340, 167–171 [DOI] [PubMed] [Google Scholar]
- 34. Delaglio F., Grzesiek S., Vuister G. W., Zhu G., Pfeifer J., Bax A. (1995) NMRPipe. A multidimensional spectral processing system based on UNIX pipes. J. Biomol. NMR 6, 277–293 [DOI] [PubMed] [Google Scholar]
- 35. Johnson B. A., Blevins R. A. (1994) NMR View: A computer program for the visualization and analysis of NMR data. J. Biomol. NMR 4, 603–614 [DOI] [PubMed] [Google Scholar]
- 36. Millikan D. S., Ruby E. G. (2004) Vibrio fischeri flagellin A is essential for normal motility and for symbiotic competence during initial squid light organ colonization. J. Bacteriol. 186, 4315–4325 [DOI] [PMC free article] [PubMed] [Google Scholar]
- 37. Studer S. V., Mandel M. J., Ruby E. G. (2008) AinS quorum sensing regulates the Vibrio fischeri acetate switch. J. Bacteriol. 190, 5915–5923 [DOI] [PMC free article] [PubMed] [Google Scholar]
- 38. Mattos K. A., Todeschini A. R., Heise N., Jones C., Previato J. O., Mendonça-Previato L. (2005) Nitrogen-fixing bacterium Burkholderia brasiliensis produces a novel yersiniose A-containing O-polysaccharide. Glycobiology 15, 313–321 [DOI] [PubMed] [Google Scholar]
- 39. Zubkov V. A., Gorshkova R. P., Ovodov Y. S., Sviridov A. F., Shashkov A. S. (1992) Synthesis of 3,6-dideoxy-4-C-(4(1)-hydroxyethyl)hexopyranoses (yersinioses) from 1,6-anhydro-β-d-glucopyranose. Carbohydr. Res. 225, 189–207 [DOI] [PubMed] [Google Scholar]
- 40. Le Quéré A. J., Deakin W. J., Schmeisser C., Carlson R. W., Streit W. R., Broughton W. J., Forsberg L. S. (2006) Structural characterization of a K-antigen capsular polysaccharide essential for normal symbiotic infection in Rhizobium sp. NGR234. Deletion of the rkpMNO locus prevents synthesis of 5,7-diacetamido-3,5,7,9-tetradeoxy-non-2-ulosonic acid. J. Biol. Chem. 281, 28981–28992 [DOI] [PubMed] [Google Scholar]
- 41. Tsvetkov Y. E., Shashkov A. S., Knirel Y. A., Zähringer U. (2001) Synthesis and NMR spectroscopy of nine stereoisomeric 5,7-diacetamido-3,5,7,9-tetradeoxynon-2-ulosonic acids. Carbohydr. Res. 335, 221–243 [DOI] [PubMed] [Google Scholar]
- 42. Melaugh W., Phillips N. J., Campagnari A. A., Tullius M. V., Gibson B. W. (1994) Structure of the major oligosaccharide from the lipooligosaccharide of Haemophilus ducreyi strain 35000 and evidence for additional glycoforms. Biochemistry 33, 13070–13078 [DOI] [PubMed] [Google Scholar]
- 43. Banoub J. H., El Aneed A., Cohen A. M., Joly N. (2010) Structural investigation of bacterial lipopolysaccharides by mass spectrometry and tandem mass spectrometry. Mass Spectrom. Rev. 29, 606–650 [DOI] [PubMed] [Google Scholar]
- 44. King J. D., Kocíncová D., Westman E. L., Lam J. S. (2009) Review. Lipopolysaccharide biosynthesis in Pseudomonas aeruginosa. Innate Immun. 15, 261–312 [DOI] [PubMed] [Google Scholar]
- 45. Vinogradov E., Wilde C., Anderson E. M., Nakhamchik A., Lam J. S., Rowe-Magnus D. A. (2009) Structure of the lipopolysaccharide core of Vibrio vulnificus type strain 27562. Carbohydr. Res. 344, 484–490 [DOI] [PubMed] [Google Scholar]
- 46. Chatterjee S. N., Chaudhuri K. (2003) Lipopolysaccharides of Vibrio cholerae. I. Physical and chemical characterization. Biochim. Biophys. Acta 1639, 65–79 [DOI] [PubMed] [Google Scholar]
- 47. Hashii N., Isshiki Y., Iguchi T., Kondo S. (2003) Structural characterization of the carbohydrate backbone of the lipopolysaccharide of Vibrio parahaemolyticus O-untypeable strain KX-V212 isolated from a patient. Carbohydr. Res. 338, 2711–2719 [DOI] [PubMed] [Google Scholar]
- 48. Hashii N., Isshiki Y., Iguchi T., Kondo S. (2003) Structural analysis of the carbohydrate backbone of Vibrio parahaemolyticus O2 lipopolysaccharides. Carbohydr. Res. 338, 1063–1071 [DOI] [PubMed] [Google Scholar]
- 49. Tabei S. M., Hitchen P. G., Day-Williams M. J., Merino S., Vart R., Pang P. C., Horsburgh G. J., Viches S., Wilhelms M., Tomás J. M., Dell A., Shaw J. G. (2009) An Aeromonas caviae genomic island is required for both O-antigen lipopolysaccharide biosynthesis and flagellin glycosylation. J. Bacteriol. 191, 2851–2863 [DOI] [PMC free article] [PubMed] [Google Scholar]
- 50. Power P. M., Jennings M. P. (2003) The genetics of glycosylation in Gram-negative bacteria. FEMS Microbiol. Lett. 218, 211–222 [DOI] [PubMed] [Google Scholar]
- 51. Schirm M., Soo E. C., Aubry A. J., Austin J., Thibault P., Logan S. M. (2003) Structural, genetic, and functional characterization of the flagellin glycosylation process in Helicobacter pylori. Mol. Microbiol. 48, 1579–1592 [DOI] [PubMed] [Google Scholar]
- 52. Thibault P., Logan S. M., Kelly J. F., Brisson J. R., Ewing C. P., Trust T. J., Guerry P. (2001) Identification of the carbohydrate moieties and glycosylation motifs in Campylobacter jejuni flagellin. J. Biol. Chem. 276, 34862–34870 [DOI] [PubMed] [Google Scholar]
- 53. McNally D. J., Aubry A. J., Hui J. P., Khieu N. H., Whitfield D., Ewing C. P., Guerry P., Brisson J. R., Logan S. M., Soo E. C. (2007) Targeted metabolomics analysis of Campylobacter coli VC167 reveals legionaminic acid derivatives as novel flagellar glycans. J. Biol. Chem. 282, 14463–14475 [DOI] [PubMed] [Google Scholar]
- 54. Goon S., Kelly J. F., Logan S. M., Ewing C. P., Guerry P. (2003) Pseudaminic acid, the major modification on Campylobacter flagellin, is synthesized via the Cj1293 gene. Mol. Microbiol. 50, 659–671 [DOI] [PubMed] [Google Scholar]
- 55. Brade H. (1985) Occurrence of 2-keto-deoxyoctonic acid 5-phosphate in lipopolysaccharides of Vibrio cholerae Ogawa and Inaba. J. Bacteriol. 161, 795–798 [DOI] [PMC free article] [PubMed] [Google Scholar]
- 56. Caroff M., Brisson J., Martin A., Karibian D. (2000) Structure of the Bordetella pertussis 1414 endotoxin. FEBS Lett. 477, 8–14 [DOI] [PubMed] [Google Scholar]
- 57. Cox A. D., Brisson J. R., Thibault P., Perry M. B. (1997) Structural analysis of the lipopolysaccharide from Vibrio cholerae serotype O22. Carbohydr. Res. 304, 191–208 [DOI] [PubMed] [Google Scholar]
- 58. Phillips N. J., Apicella M. A., Griffiss J. M., Gibson B. W. (1993) Structural studies of the lipooligosaccharides from Haemophilus influenzae type b strain A2. Biochemistry 32, 2003–2012 [DOI] [PubMed] [Google Scholar]
- 59. Holst O. (2003) Lipopolysaccharides of Yersinia. An overview. Adv. Exp. Med. Biol. 529, 219–228 [DOI] [PubMed] [Google Scholar]
- 60. Sonesson A., Jantzen E., Bryn K., Tangen T., Eng J., Zähringer U. (1994) Composition of 2,3-dihydroxy fatty acid-containing lipopolysaccharides from Legionella israelensis, Legionella maceachernii, and Legionella micdadei. Microbiology 140, 1261–1271 [DOI] [PubMed] [Google Scholar]
- 61. Han T. J., Chai T. J. (1992) Electrophoretic and chemical characterization of lipopolysaccharides of Vibrio parahaemolyticus. J. Bacteriol. 174, 3140–3146 [DOI] [PMC free article] [PubMed] [Google Scholar]
- 62. Cox A. D., Brisson J. R., Varma V., Perry M. B. (1996) Structural analysis of the lipopolysaccharide from Vibrio cholerae O139. Carbohydr. Res. 290, 43–58 [DOI] [PubMed] [Google Scholar]
- 63. Iguchi T., Kondo S., Hisatsune K. (1995) Vibrio parahaemolyticus O serotypes from O1 to O13 all produce R-type lipopolysaccharide. SDS-PAGE and compositional sugar analysis. FEMS Microbiol. Lett. 130, 287–292 [DOI] [PubMed] [Google Scholar]
- 64. Ruby E. G., Asato L. M. (1993) Growth and flagellation of Vibrio fischeri during initiation of the sepiolid squid light organ symbiosis. Arch. Microbiol. 159, 160–167 [DOI] [PubMed] [Google Scholar]
- 65. Ruby E. G. (1996) Lessons from a cooperative, bacterial-animal association: the Vibrio fischeri-Euprymna scolopes light organ symbiosis. Annu. Rev. Microbiol. 50, 591–624 [DOI] [PubMed] [Google Scholar]
- 66. Tambalo D. D., Bustard D. E., Del Bel K. L., Koval S. F., Khan M. F., Hynes M. F. (2010) Characterization and functional analysis of seven flagellin genes in Rhizobium leguminosarum bv. viciae. Characterization of R. leguminosarum flagellins. BMC Microbiol. 10, 219. [DOI] [PMC free article] [PubMed] [Google Scholar]
- 67. Toguchi A., Siano M., Burkart M., Harshey R. M. (2000) Genetics of swarming motility in Salmonella enterica serovar typhimurium. Critical role for lipopolysaccharide. J. Bacteriol. 182, 6308–6321 [DOI] [PMC free article] [PubMed] [Google Scholar]
- 68. Morgenstein R. M., Clemmer K. M., Rather P. N. (2010) Loss of the waaL O-antigen ligase prevents surface activation of the flagellar gene cascade in Proteus mirabilis. J. Bacteriol. 192, 3213–3221 [DOI] [PMC free article] [PubMed] [Google Scholar]
- 69. Girgis H. S., Liu Y., Ryu W. S., Tavazoie S. (2007) A comprehensive genetic characterization of bacterial motility. PLoS Genet. 3, 1644–1660 [DOI] [PMC free article] [PubMed] [Google Scholar]
- 70. Bowden M. G., Kaplan H. B. (1998) The Myxococcus xanthus lipopolysaccharide O-antigen is required for social motility and multicellular development. Mol. Microbiol. 30, 275–284 [DOI] [PubMed] [Google Scholar]
- 71. Boettcher K. J., Ruby E. G. (1994) Occurrence of plasmid DNA in the sepiolid squid symbiont Vibrio fischeri. Curr. Microbiol. 29, 279–286 [Google Scholar]
- 72. Hanahan D. (1983) Studies on transformation of Escherichia coli with plasmids. J. Mol. Biol. 166, 557–580 [DOI] [PubMed] [Google Scholar]
- 73. Stabb E. V., Ruby E. G. (2002) RP4-based plasmids for conjugation between Escherichia coli and members of the Vibrionaceae. Methods Enzymol. 358, 413–426 [DOI] [PubMed] [Google Scholar]
Associated Data
This section collects any data citations, data availability statements, or supplementary materials included in this article.


