

Abstract
After isolation from different doughs and sourdoughs, 177 strains of lactic acid bacteria were screened at the phenotypic level for exopolysaccharide production on media containing different carbohydrate sources. Two exopolysaccharide-producing lactic acid bacteria (Lactobacillus curvatus 69B2 and Leuconostoc lactis 95A) were selected through quantitative analysis on solid media containing sucrose and yeast extract. The PCR detection of homopolysaccharide (gtf and lev) and heteropolysaccharide (epsA, epsB, epsD and epsE, and epsEFG) genes showed different distributions within species and strains of the lactic acid bacteria studied. Moreover, in some strains both homopolysaccharide and heteropolysaccharide genes were detected. Proton nuclear magnetic resonance spectra suggest that Lactobacillus curvatus 69B2 and Leuconostoc lactis 95A produced the same exopolysaccharide, which was constituted by a single repeating glucopyranosyl unit linked by an α-(1→6) glycosidic bond in a dextran-type carbohydrate. Microbial growth, acidification, and viscoelastic properties of sourdoughs obtained by exopolysaccharide-producing and nonproducing lactic acid bacterial strains were evaluated. Sourdough obtained after 15 h at 30°C with exopolysaccharide-producing lactic acid bacteria reached higher total titratable acidity as well as elastic and dissipative modulus curves with respect to the starter not producing exopolysaccharide, but they showed similar levels of pH and microbial growth. On increasing the fermentation time, no difference in the viscoelastic properties of exopolysaccharide-producing and nonproducing samples was observed. This study suggests that dextran-producing Leuconostoc lactis 95A and Lactobacillus curvatus 69B2 can be employed to prepare sourdough, and this would be particularly useful to improve the quality of baked goods while avoiding the use of commercially available hydrocolloids as texturizing additives.
INTRODUCTION
The exopolysaccharides (EPS) produced by bacteria are involved in many protective cellular functions that improve bacterial competition in different habitats. Indeed, the EPS counteract the antimicrobial activity of phages and antibiotics as well as phagocytosis, favor adhesion to solid surfaces and the formation of a biofilm (49), and limit desiccation. Lactic acid bacteria (LAB) can produce a large structural variety of EPS and oligosaccharides from glucose that differing in size, molecular organization, chemical composition, structure, and genetic determinants (41) through the activity of glycansucrase and glycosyltransferase (GTF) enzymes. The chemical composition of repeating units of EPS produced by microorganisms has been determined by nuclear magnetic resonance (NMR) spectroscopy (31, 35, 48, 51) through the application of 1H and 13C NMR mono- and bidimensional spectra (19). An updated review of composition, structure, and yield of homopolysaccharides (HoPS) and heteropolysaccharides (HePS) synthesized by LAB strains determined by NMR spectroscopy was previously reported (50). A complex molecular organization is responsible for genes involved in HePS biosynthesis (13). The main genes involved in HoPS production are glucansucrase and levansucrase genes (21, 28, 55). Generally, for thermophilic LAB the eps genes are chromosomal, whereas for mesophilic LAB almost all genes are associated with plasmids. The genes are organized in four functional regions (57) involved in chain length determination, polymerization, export, and regulation of the gene cluster. HePS production may be unstable and variable due to some spontaneous mutation at the genetic level with consequently altered composition or weaker production (usually below 0.4 to 0.5 g/liter), while the amount of HoPS produced by LAB is greater than 1 g/liter (18, 32, 55). The structure, composition, and viscosity of EPS depend on several factors, such as the kind of strain, the composition of the culture medium, mineral salts, trace elements, and fermentation conditions (e.g., pH and temperature) (13). Thanks to their properties, EPS are considered biothickeners or hydrocolloids that represent a good alternative to additives obtained from plant (e.g., starch), animal (e.g., caseinate and gelatin), and seaweed (e.g., carrageen), which are used in the baked goods industry. EPS affect the viscoelastic properties and stabilize the rheological properties of dough during freezing storage. The final product has better texture and flavor and an extended shelf-life (54). However, the in situ production of exopolysaccharides during sourdough fermentation is challenged by simultaneous acidification due to metabolic activities of the bacteria, which may significantly diminish the positive technological impact of exopolysaccharides. Moreover, as in vitro optimization is not necessarily transferable to an in vivo system, appropriate production processes must be developed to ensure the in situ synthesis of EPS in amounts effective in dough and must be able to absorb probable negative effects of high acid production (22). The preference in the production of EPS versus oligosaccharides can be adjusted through strain selection and fermentation conditions. Indeed, in the last few years studies on the EPS-producing LAB strains used as starters in sourdough technology have been developed with the aim of obtaining new and standardized baked products with higher quality and a reduced need for additives. While the application of EPS produced by LAB is very common in the dairy industry, research on the production of EPS in sourdough and its impact on the quality of started baked goods has been reported recently (25, 54, 55). The aim of this study was to investigate the ability of newly isolated LAB strains from different baked products to produce EPS, select EPS producers, detect genes, and characterize the molecular features involved in the biosynthesis of EPS. The influence of a multiple starter composed of selected EPS-producing LAB strains on the acidic and rheological characteristics of sourdough was also determined. The study extends current knowledge on the effect of exopolysaccharide production by cereal-associated lactic acid bacteria.
MATERIALS AND METHODS
Microorganisms and media for EPS screening.
In all, 177 LAB strains were used in this study (Leuconostoc pseudomesenteroides, 15; Leu. mesenteroides, 5; Leu. lactis/Leu. garlicum, 2; Leu. lactis, 7; Leu. lactis subsp. lactis, 7; Leuconostoc spp., 4; Leu. gelidum, 6; Leu. oenos, 1; Leu. amelibiosum, 2; Leu. dextranicum, 3; Leu. carnosus, 2; Weissella paramesenteroides, 9; Weissella spp., 2; Lactobacillus spp., 5; Lb. casei, 11; Lb. curvatus, 4; Lb. curvatus/sakei, 1; Lb. curvatus subsp. curvatus 1; Lb. coryniformis subsp. torquens, 2; Lb. sakei, 4; Lb. plantarum, 37; Lb. paracasei, 2; Lb. pentosus, 4; Lb. viridiscens, 1; Lb. brevis, 4; Lactococcus sp., 9; Lc. lactis subsp. lactis, 10; Lc. lactis subsp. raffinolactis, 1; Lc. garviae, 1; Lc. lactis, 2; uncultured Streptococcus sp., 1; Enterococcus faecium, 2; E. faecalis, 10) (3, 9, 10, 42, 44, 45). The LAB strains, complete with origins and references, are presented in Table S1 in the supplemental material. Initially, the LAB strains were refreshed by growing in MRS broth (Oxoid) at 30°C for 24 h. To verify EPS production in vitro, the strains were tested by streaking on modified Chalmers agar (CA) (43) with different carbohydrate sources (5%), such as sucrose (CA+S), maltose, glucose, galactose, fructose, or lactose, all without CaCO3. Filter-sterilized solutions (0.45-μm-pore-size filters; Minisartplus Sartorius AG, Göttingen, Germany) of the different sugars (50 mg ml−1) were added to the medium. EPS production was detected through the examination of slimy colonies on the plate until 72 h of incubation at 30°C. Colonies were assayed for the ropy EPS phenotype by touching them with a sterile toothpick to observe the formation of long visible strings (49, 58). The positive strains detected by the primary assay were also tested on modified Chalmers agar without CaCO3 and with a mixture of sucrose, fructose, and maltose (CA+SFM) at a concentration of 1.6% (wt/vol) for each one. The strains were incubated at 30°C for 3 days, and the ropy colonies were evaluated as described above.
Quantification of EPS produced by LAB.
The best LAB EPS producers among the EPS-positive ones in solid substrate were chosen through a quantitative analysis as reported below. The LAB strains were first grown overnight in MRS broth (Oxoid). After inoculum standardization using a Thoma counting chamber (depth, 0.02 mm; 1/400 mm2; Hawksley, United Kingdom), 1 ml of the different cultures containing about 5 × 10⁷ LAB cells was streaked on the plate surface (180-mm diameter) of CA+S with and without yeast extract (0.5%, wt/vol) to ascertain its effect on EPS production. After 48 h of incubation at 30°C, the EPS produced were taken directly from plates by repeatedly washing them with 30 ml of distilled water until the disappearing of the visible ropy patina that was collected in sterile falcon tubes. The cells were removed by centrifugation at 5,200 × g for 10 min at room temperature, and EPS were precipitated with 2 volumes of chilled 98% (vol/vol) ethanol. After standing overnight at 4°C, the samples were centrifuged (5,200 × g for 10 min at 4°C) and the pellets were resuspended with 1 ml of distilled water. The suspensions were freeze-dried and weighed to quantify the EPS using an analytical balance (Gibertini, Italy), and the amount of EPS was expressed as the polymer dry mass (PDM; in mg kg−1) of wet medium (14, 38). The results were an average of four weighings for two different extractions.
Molecular detection and characterization of eps genes.
DNA was isolated from the 15 strains that showed better EPS production on agar plates (Table 1) as previously described (5). Screening for eps genes was performed using different primers targeting homopolysaccharide (glucansucrase [gtf] and levansucrase [lev]) and heteropolysaccharide (epsA, epsB, epsD and epsE, and epsEFG) genes (Table 2). The PCR mixtures were prepared according to Blaiotta et al. (5), and the thermal conditions detailed in Table 2 were used. PCR products from gtf genes and epsD and epsE were purified by using a QIAquick gel extraction kit (Qiagen S.p.A., Milan, Italy) and sequenced. The DNA sequences were determined by the dideoxy chain termination method by using a DNA sequencing kit (Perkin-Elmer Cetus, Emeryville, CA) according to the manufacturer's instructions. The sequences were analyzed by MacDNasis Pro v3.0.7 (Hitachi Software Engineering Europe S.A., Olivet Cedex, France), and research for DNA similarity was performed with the GenBank and EMBL databases (1). Sequence alignments were conducted with the ClustalW algorithm (53).
Table 1.
Screening of LAB strains for EPS production in solid mediaa
| Taxon | No. of EPS-positive strains | Signature of EPS-positive strains | EPS production on two different media |
|
|---|---|---|---|---|
| CA+S | CA+SFM | |||
| Leuconostoc pseudomesenteroides | 8 | 51B, 53B | ++ | − |
| 63, 77A | ++ | + | ||
| 77B, 79A, 53C, 49 | ++ | − | ||
| Leuconostoc lactis | 4 | 68B, 69B, 95, 95A | ++ | ++ |
| Leuconostoc lactis/Leuconostoc garlicum | 2 | 68B2 | + | − |
| 68A12 | ++ | ++ | ||
| Leuconostoc gelidum | 3 | A16, A43 | ++ | ++ |
| A49 | ++ | − | ||
| Leuconostoc mesenteroides | 4 | A27, A57, A6 | ++ | ++ |
| A52 | + | + | ||
| Leuconostoc amelibiosum | 1 | A21 | ++ | ++ |
| Leuconostoc dextranicum | 4 | A28 | ++ | ++ |
| Leuconostoc sp. | 1 | A23 | + | + |
| Weissella paramesenteroides | 6 | G14, G15, G18, A51 | + | − |
| A58 | + | − | ||
| A64 | ++ | + | ||
| Lactobacillus curvatus | 1 | 69B2 | ++ | ++ |
| Lactobacillus coryniformis subsp. torquens | 1 | 133 | + | − |
| Lactococcus sp. | 2 | A19, LA23 | + | − |
| Uncultured Streptococcus sp. | 1 | 107 | + | − |
The table reports only the species that showed EPS production in CA+S and/or in CA+SFM. CA+S, modified Chalmers agar without CaCO3 and with sucrose (5%, wt/vol) as the carbon source. CA+SFM, modified Chalmers agar without CaCO3 and with a mixture of sugars (sucrose, fructose, and maltose; 1.6%, wt/vol) as the carbon source. ++, EPS production after 24 h at 30°C; +, EPS production after 48 h at 30°C; −, no EPS production.
Table 2.
Primer pairs used to screen for HoPS and HePS genes
| Primer | Sequencea (5′-3′) | Gene target | Expected fragment size (bp) | PCR conditions | Reference(s) |
|---|---|---|---|---|---|
| epsEFG fw | GAYGARYTNCCNCARYTNWKAAYGT | Glycosyltransferase | 30 cycles of 94°C (30 s), 49°C (45 s), 72°C (1 min) | 30 | |
| epsEFG rev | TGCAGCYTCWGCCACATG | Lc. delbrueckii subsp. bulgaricus | 1,600 | 41 | |
| Lb. helveticus | 300 | ||||
| epsD/E fw | TCATTTTATTCGTAAAACCTCAATTGAYGARYTNCC | Glycosyltransferase | 5 cycles of 94°C (30 s), 62°C (30 s), 72°C (30 s); 40 cycles of 94°C (30 s), 52°C (30 s), 72°C (30 s) | 47 | |
| Lb. casei | 200 | ||||
| epsD/E rev | AATATTATTACGACCTSWNAYYTGCCA | Streptococcus thermophilus | 200 | ||
| epsA fw | TAGTGACAACGGTTGTACTG | EPS regulation | 35 cycles of 94°C (15 s), 40°C (30 s), 72°C (1 min) | 34 | |
| epsA rev | GATCATTATGGACTGTCAC | S. thermophilus | 800 | ||
| epsB fw | CGTACGATTCGTACGACCAT | EPS chain length determination in Lactococcus lactis | 35 cycles of 94°C (45 s), 46°C (1 min), 72°C (1 min) | 14 | |
| epsB rev | TGACCAGTGACACTTGAAGC | 1,150 | |||
| gtf fw | GAYAAYWSIAAYCCIRYIGTIC | Glucansucrase | 660 | 35 cycles of 95°C (30 s), 42°C (45 s), 72°C (1 min) | 28 |
| gtf rev | ADRTCICCRTARTAIAVIYKIG | ||||
| LevV fw | GAYGTNTGGGAYWSNTGGC | Levansucrase | 800 | 35 cycles of 95°C (30 s), 42°C (45 s), 72°C (1 min) | 55 |
| LevV rev | TCNTYYTCRTCNSWNRMCAT |
Y = C or T; R = A or G; W = A or T; K = G or T; S = C or G; M = A or C; V = A, C, or G; N = A, C, G, or T; I = inosine.
Monosaccharide composition by NMR spectroscopy.
Fifteen mg of freeze-dried EPS samples, produced by Leuconostoc lactis 95A and Lactobacillus curvatus 69B2 in solid medium as described above, were dissolved by 1 ml of deuterated water (99.8% D2O/H2O; Armar Chemicals) in 5-mm nuclear magnetic resonance (NMR) tubes. A 400-MHz Bruker Avance spectrometer and a 5-mm BBI Bruker probe were employed to acquire 1H NMR spectra at a 400.13-MHz frequency and at 298 ± 1 K. An inversion recovery T1-filtered pulse sequence was used to efficiently multisuppress water signals and ethanol multiplets from 1H spectra, as described elsewhere (37). The T1-filtered one-dimensional (1D) 1H spectra were acquired, after 3.5 s of thermal equilibrium delay, with a 90° pulse length of 8 ms, 500 transients, 32,768 time domain points, and a presaturating power of 54.14 dB. 1D 13C proton spectra were acquired with a hard pulse length of 12.88 ms and 30,000 scans, a thermal delay of 7 s, a spectral width of 250 ppm (25,032 kHz), a time domain of 32,768 points, and an 80-ms waltz16 scheme for proton decoupling under an inverse gated pulse sequence. Both 1H-1H COSY (for correlation spectroscopy) and TOCSY (for total correlation spectroscopy) 2D spectra were acquired with 96 scans, 2 s of equilibrium delay, and 16 dummy scans. For TOCSY experiments, a trim pulse of 2,500 ms and a mixing time of 0.08 s were applied, while 1H-13C heteronuclear single-quantum correlation (HSQC) 2D experiments were conducted with a trim pulse of 0.5 μs. For 1H DOSY (for diffusion-ordered spectroscopy) experiments, a stimulated echo bipolar gradient pulse sequence was applied in combination with a water gate 3-9-19-pulsed train to suppress water signals, and we made use of a 2,500-ms-length sine-shaped gradient, linearly ranging from 0.674 to 32.030 gauss cm−1 in 128 increments, and selecting a delay of 0.2 s between the first and second gradient. All 1D and 2D spectra were baseline corrected and processed by using both Bruker Topspin software (v.1.3) and MestReC NMR Processing software (v. 4.9.9.9).
Sourdough, fermentation conditions, and EPS isolation.
The sourdough fermentation was obtained using two different starters selected on the basis of cultural and molecular screening: EPS-positive (EPS+) starters were composed of Leuconostoc lactis 95A and Lactobacillus curvatus 69B2, and EPS-negative starters were composed of Leuconostoc lactis 68A and Lactobacillus curvatus 68A2. An appropriate starter suspension was added to achieve viable counts of about 5 × 10⁷ CFU g−1 of LAB in the final dough (9). The sourdoughs were prepared in four different conditions, with the mixing 500 g of wheat flour and 280 ml of tap water with 5 or 10% (wt/vol) of sucrose with and without 0.5% (wt/vol) yeast extract. After incubation at 30°C for 15 or 30 h, 20 g of sourdough was homogenized with 180 ml of 0.1% peptone water in a Stomacher 400 and serially diluted with sterile quarter-strength Ringer's solution (Oxoid). Differential microbial counts of LAB strains were determined on duplicate plates of modified Chalmers agar plates (43). The pH and total titratable acidity (TTA) were determined by standard methods (2), and the acid equivalent was expressed as the amount of NaOH 0.1 N/10 g consumed (in ml). Another sourdough type was produced under the same conditions, except for the addition of a crude preparation of EPS (20 ml/500 g of flour) collected directly from the ropiness plates (180-mm diameter) as described above. The EPS produced directly in the sourdoughs obtained by the EPS+ and EPS− starter cultures after 15 h of fermentation at 30°C were extracted by following the method described in reference (24) as reported above. The enzymatic hydrolysis of the extracts was performed to remove starch through treatments with thermostable α-amylase for 10 min at 100°C, followed by the addition of amyloglucosidase for 1 h at 50°C (total starch assay kit; Megazyme). The glucose liberated from the degraded starch was removed from the insoluble residue by repeated washes with two volumes of chilled 98% (vol/vol) ethanol. The concentration of EPS in the wheat sourdough was determined according to the phenol-sulfuric method of Dubois et al. (16, 38).
Rheological measurements.
Dynamic mechanical analysis was used to study the rheological behavior of sourdough samples. Measurements were performed by means of a controlled strain rheometer (ARES-LS; Rheometric Scientific, Inc., Piscataway, NJ) equipped with plate-and-plate geometry (50-mm diameter, 2-mm gap). Frequency sweep tests were conducted by applying an oscillation amplitude of 0.1%, which was within the linear viscoelastic region, in a frequency range between 10−1 and 102 rad/s at 25°C. Elastic and dissipative moduli, G′ and G″, were collected. Tests were carried out in triplicate, and average values are reported.
Nucleotide sequence accession numbers.
Sequences of the gtf gene of strains Leuconostoc mesenteroides A52, Leuconostoc gelidum A43, and Leuconostoc amelibiosum A21 were deposited in the GenBank database (accession no. JN796246 to JN796248). Sequences of the epsD and epsE genes of strains Lactobacillus curvatus 69B2, Leuconostoc lactis/Leuconostoc garlicum 68A12, Leuconostoc mesenteroides A57, and Leuconostoc pseudomesenteroides 63 are available in Table S2 in the supplemental material because they were less than 200 nucleotides in length.
RESULTS
Screening of LAB for EPS production.
EPS-producing LAB formed slimy colonies on CA agar plates only in the presence of sucrose (CA+S) and without CaCO3. In the presence of carbonate or the absence of sucrose, EPS production was inhibited. Thirty-four LAB strains (34/177; 19%) were able to produce EPS after 48 h of incubation in CA+S. In particular, 7.7% (23/177) of these LAB strains showed EPS production in CA+S after 24 h of incubation at 30°C (Table 1). Most of the strains belonging to Lactobacillus, Lactococcus, and Enterococcus genera used in this study, with the exception of Lb. curvatus 69B2, Lb. coryniformis subsp. torquens 133, and Lactococcus sp. strains A19 and LA23, were able to form ropy colonies in the media assayed, even if the latter showed weak EPS formation only in CA+S after 48 h of incubation. All EPS+ strains were isolated from sourdough from sweet baked products (16/177; 9%) and from pizza dough (12/177; 6.8%). When the EPS-positive strains in CA+S were inoculated in CA+SFM, a medium containing a mixture of sugars at a concentration similar to that of sweet baked goods (42), EPS producers were reduced to 7.3% (13/177) of the total LAB screened. In particular, Leuconostoc lactis 68B, 69B, 95, 95A, 68A12 strains, Leuconostoc gelidum A16 and A43, Leuconostoc mesenteroides A27, A57, A6, Leuconostoc amelibiosum A21, Leuconostoc dextranicum A28, and Lactobacillus curvatus 69B2 showed high EPS production in both CA+S and CA+SFM, as evidenced by the formation of slimy colonies already after 24 h of incubation at 30°C (Table 1), and these were also confirmed by the phenotype investigation of visible strings.
Quantification of EPS production by LAB.
Six Leuconostoc lactis strains showed the highest yield of EPS, and the effect of yeast extract on EPS production was quite variable. In particular, Leuconostoc lactis 95 and 95A produced 85.9 ± 2.97 and 88.05 ± 1.48 mg PDM kg−1 of EPS, respectively, in the presence of yeast extract, while Leuconostoc lactis 69B, 68A12, and 68B produced 78.65± 6.29, 62.95 ± 3.60, and 59.85 ± 8.41 mg PDM kg−1 of EPS, respectively, without yeast extract. Lactobacillus curvatus 69B2, which gave high, rapid EPS formation in CA with different sources of sugars, showed a maximum yield of 48.65 ± 0.21 mg PDM kg−1 (Fig. 1). In contrast, the other Lactobacillus strains tested yielded undetectable levels of EPS.
Fig 1.

Quantification of EPS produced by LAB strains on CA+S with and without 0.5% yeast extract (YE). The amount of EPS was expressed as the polymer dry mass (PDM; in mg kg−1) of wet medium.
Molecular screening for HoPS and HePS genes.
Screening for EPS genes revealed that 13/14 LAB strains tested possessed at least one eps gene that was similar to a previously identified gene (Table 3). For Leuconostoc pseudomesenteroides 79A, no EPS genes could be detected. PCR amplification was performed to determine the presence of glucansucrase (gtf) and levansucrase (lev) genes, which are involved in HoPS biosynthesis. The gtf gene, detected using primers targeting glucansucrases of Leuconostoc mesenteroides subsp. dextranicum (28), occurred in 10 out of 14 LAB strains analyzed. Sequence analysis for Leuconostoc mesenteroides A52 (accession no. JN796246) and Leuconostoc gelidum A43 (accession no. JN796247) showed 99 and 97% similarity, respectively, to the gene coding for a dextransucrase of Leuconostoc mesenteroides L0309 (AY743959). Leuconostoc amelibiosum A21 (accession no. JN796248) showed 95% similarity to the gene coding for a dextransucrase of Leuconostoc citreum (AB362781). The lev gene was detected using primers designed for levansucrases of Lactobacillus sanfranciscensis by Tieking et al. (55). In particular, 8 LAB strains had the gene coding for levan-type EPS. PCR amplifications of heteropolysaccharide genes were also performed. Just four Leuconostoc strains evidenced 800-bp PCR products with an epsA gene using the primer pair from reference 34. Screening with a primer pair for epsB (12) revealed 50% (7/14) positive strains. Thirteen out of 14 strains harbor epsD and epsE. Sequencing analysis of the epsD and epsE 200-bp PCR product of Lactobacillus curvatus 69B2 (see Table S2 in the supplemental material) showed 89% similarity to the priming glycosyltransferase (sugar transferase, which is involved in exopolysaccharide biosynthesis) of Leuconostoc citreum (DQ873503). Leuconostoc lactis/Leuconostoc garlicum 68A12, Leuconostoc mesenteroides A57, and Leuconostoc pseudomesenteroides 63 (see Table S1 in the supplemental material) showed 79% similarity with the priming glycosyltransferase of Pediococcus pentosaceus (DQ873506). Finally, with the primer pair for epsEFG (30), no strains presented the expected fragment sizes (300 and 1,660 bp). Moreover, no similarity with eps genes was found by sequencing analysis of four selected fragments of epsEFG PCR products.
Table 3.
Screening of genes involved in HePS (epsA, epsB, epsD and epsE, and epsEFG) and HoPS (gtf and lev) productiona
| Strain | epsA | epsB | epsD and epsE | epsEFG | gtf | lev |
|---|---|---|---|---|---|---|
| Lb. curvatus 69B2 | − | + | + | − | + | − |
| Ln. lactis 69B | − | + | + | − | − | − |
| Ln. lactis 68B | − | + | + | − | − | − |
| Ln. lactis/Ln. garlicum 68A12 | − | + | + | − | − | − |
| Ln. lactis 95A | − | + | + | − | + | − |
| Ln. mesenteroides A52 | + | − | + | − | + | + |
| Ln. mesenteroides A57 | + | − | + | − | + | + |
| Ln. amelibiosum A21 | − | − | + | − | + | + |
| Ln. dextranicum A28 | + | − | + | − | + | + |
| Ln. gelidum A43 | + | − | + | − | + | + |
| Ln. gelidum A16 | − | − | + | − | + | + |
| Ln. pseudomesenteroides 63 | − | + | + | − | + | + |
| Ln. pseudomesenteroides 77B | − | + | + | − | + | + |
| Ln. pseudomesenteroides 79A | − | − | − | − | − | − |
+, presence of the corresponding gene; −, no detection of the corresponding gene.
Monosaccharide composition of EPS from NMR experiments.
The extracted polysaccharides obtained by Lactobacillus curvatus 69B2 and Leuconostoc lactis 95 showed similar proton spectra, and both were constituted by a single regularly repeating glucopyranose unit (Fig. 2A). This was further proved by the 13C spectrum (Fig. 2B), where only six single carbon signals were detected. Both proton and carbon signals for the two different extracts resonated at the same frequencies (Table 4), while multiplets in 1H spectra exhibited similar relative intensities and the same J-coupling constants. The presence of only one repeating unit in the extracts was further suggested by the 2D (1H-1H) TOCSY spectrum (Fig. 3A) that revealed only one spin system. The proton 1H DOSY projections (Fig. 3B) allowed us to detect differences in the diffusivity of the EPS produced by the two LAB. In fact, Lactobacillus curvatus 69B2 extract (dark line) was heavier in molecular weight and hence more extensively polymerized than that produced by Leuconostoc lactis 95A (bright line) despite their identical chemical structures. The main spin systems were evaluated by both 1H-1H COSY (Fig. 3C) and 1H-13C HSQC 2D experiments (Fig. 3D). The 1H correlations among different proton signals and their relatively large coupling constant of about 10 Hz (52), as well as the 1H spectrum and its chemical shifts (Table 4), suggest a dextran-type carbohydrate configuration based on α-(1→6)-linked d-glucopyranosyl units (35). Finally, a number of signals in proton spectra (Fig. 3A) indicate the presence of minor saccharidic units in the two EPS.
Fig 2.
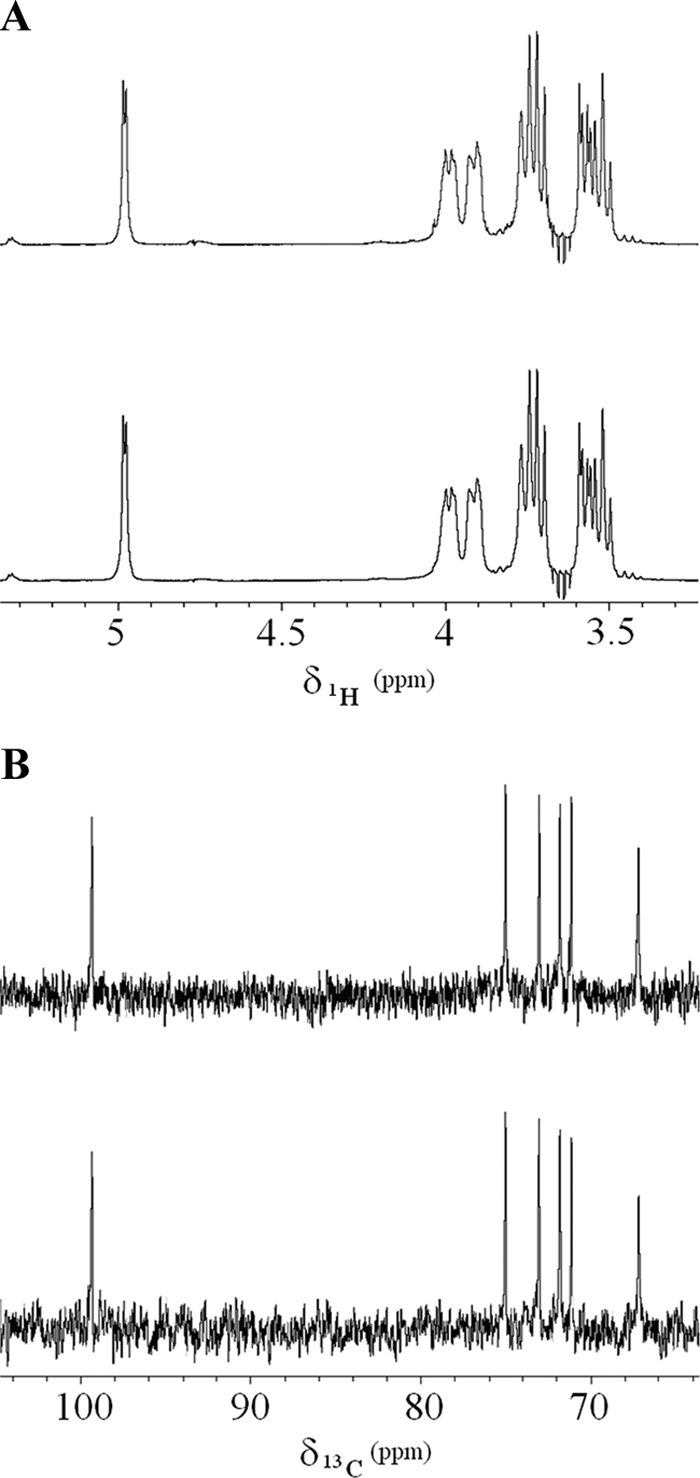
(A) 1H filtered spectra of EPS produced by Lactobacillus curvatus 69B2 (upper) and Leuconostoc lactis 95A (lower). Inversion recovery artifacts are evident at 3.642 ppm, in correspondence of the resonance of ethanol methylene protons. (B) 13C proton-decoupled spectra of EPS produced by Lactobacillus curvatus 69B2 (upper) and Leuconostoc lactis 95A (lower).
Table 4.
13C and 1H chemical shifts of the multiplets related to EPS produced by Lactobacillus curvatus 69B2 and Leuconostoc lactis 95A
| Assigned EPS nuclei | Chemical shifts (ppm) for: |
|||
|---|---|---|---|---|
|
Lactobacillus curvatus 69B2 |
Leuconostoc lactis 95A |
|||
| 1H | 13C | 1H | 13C | |
| H-1/C-1 | 4.984 | 99.305 | 4.984 | 99.306 |
| 4.976 | 4.976 | |||
| H-2/C-2 | 3.592 | 72.999 | 3.592 | 72.996 |
| 3.583 | 3.583 | |||
| 3.567 | 3.567 | |||
| 3.558 | 3.558 | |||
| H-3/C-3 | 3.721 | 74.996 | 3.721 | 74.993 |
| 3.697 | 3.698 | |||
| H-4/C-4 | 3.562 | 71.123 | 3.560 | 71.124 |
| 3.544 | 3.538 | |||
| 3.520 | 3.520 | |||
| 3.496 | 3.497 | |||
| H-5/C-5 | 3.927 | 71.776 | 3.928 | 71.775 |
| 3.904 | 3.904 | |||
| H-6/C-6 | 3.769 | 3.769 | ||
| 3.744 | 3.744 | |||
| H-6′/C-6′ | 3.998 | 67.137 | 4.005 | 67.142 |
| 3.998 | 4.002 | |||
| 3.981 | 3.982 | |||
| 3.972 | 3.972 | |||
Fig 3.

(A) TOCSY spectrum of EPS produced by Lactobacillus curvatus 69B2. (B) 2D projections of 1H DOSY experiments for EPS produced by Lactobacillus curvatus 69B2 (dark line) and Leuconostoc lactis 95A (light line). (C) The projections at the lowest DOSY region (approximately 10.6 m2/s) correspond to unsuppressed ethanol methylene protons with faster diffusive properties. COSY experiment of EPS produced by Lactobacillus curvatus 69B2. (D) HSQC experiment of EPS produced by Lactobacillus curvatus 69B2 obtained with a 0.5-ms trim pulse and optimized for a 1JCH of 145 Hz.
Cell enumeration, pH, and TTA of sourdough and EPS isolation.
Sourdough samples obtained with both EPS+ and EPS− starter cultures with 0, 5, and 10% sucrose and yeast extract showed similar microbial content and pH values. In particular, the counts of EPS+ and EPS− cultures increased by about 1.5 log cycles after 15 h of incubation at 30°C, reaching cumulative counts of about 5 × 10⁸ CFU g−1 (Table 5). In contrast, only a small decrease in growth could be detected after 30 h of fermentation at 30°C (about 0.2 log CFU g−1). The pH of the mixtures did not suffer significant changes in any experimental condition tested (3.99 to 4.19), whereas the increase in TTA was greater in sourdough started with EPS+ LAB and in the presence of 5% sucrose after 30 h of fermentation, with and without 0.5% yeast extract, in which the TTA reached 8.65 ± 0.49 and 9.50 ± 0.70 ml of NaOH 0.1 N 10 g−1, respectively (Table 6). Indeed, after 15 h of incubation the same sourdough type reached TTA values not exceeding 6.40 ± 0.98 and 6.78 ± 0.50 ml of NaOH 0.1 N 10 g−1.
Table 5.
Microbial content of sourdough obtained with EPS+ and EPS− starter cultures after 15 and 30 h of incubation at 30°Ca
| Exptl condition | Total LAB (log CFU/g) in: |
|||
|---|---|---|---|---|
| EPS+ starter at: |
EPS− starter at: |
|||
| 15 h | 30 h | 15 h | 30 h | |
| Control | 8.52 ± 0.42 | 8.33 ± 0.51 | 8.53 ± 0.07 | 8.23 ± 0.09 |
| 5% S | 8.67 ± 0.03 | 8.47 ± 0.32 | 8.44 ± 0.05 | 8.37 ± 0.08 |
| 5% S + 0.5% YE | 8.43 ± 0.12 | 8.36 ± 0.09 | 8.53 ± 0.02 | 8.49 ± 0.05 |
| 10% S | 8.58 ± 0.06 | 8.32 ± 0.10 | 8.47 ± 0.13 | 8.18 ± 0.06 |
| 10% S + 0.5% YE | 8.68 ± 0.09 | 8.44 ± 0.08 | 8.52 ± 0.05 | 8.28 ± 0.07 |
| 5% S + EPSb | 8.62 ± 0.08 | 8.43 ± 0.05 | 8.56 ± 0.06 | 8.35 ± 0.03 |
EPS+ starter cultures were composed of Leuconostoc lactis 95A and Lactobacillus curvatus 69B2, and EPS− starter cultures were composed of Leuconostoc lactis 68A and Lactobacillus curvatus 68A2. Data are means from duplicate analysis of replicate experiments. S, sucrose; YE, yeast extract. Microbial counts detected in all experimental conditions immediately after dough mixing were in the range of 7.39 ± 0.09 to 7.53 ± 0.20 log CFU ml−1. The sourdoughs were prepared with 5 or 10% sucrose with and without 0.5% yeast extract.
Sourdough prepared with the addition of EPS (20 ml/500 g of flour) collected directly from the ropiness plates as described in the text.
Table 6.
Acidification properties (pH and TTA) of sourdough obtained with EPS+ and EPS− starter cultures after 15 and 30 h of incubation at 30°Ca
| Exptl condition | Result with EPS+ starter at: |
Result with EPS− starter at: |
||
|---|---|---|---|---|
| 15 h | 30 h | 15 h | 30 h | |
| Control | ||||
| pH | 4.03 ± 0.15 | 3.99 ± 0.09 | 4.09 ± 0.13 | 4.02 ± 0.12 |
| TTA | 2.65 ± 0.49 | 4.54 ± 0.13 | 2.70 ± 0.28 | 4.38 ± 0.18 |
| 5% S | ||||
| pH | 4.08 ± 0.24 | 4.07 ± 0.07 | 4.16 ± 0.28 | 4.18 ± 0.18 |
| TTA | 6.40 ± 0.98 | 8.65 ± 0.49 | 5.30 ± 0.28 | 7.50 ± 0.70 |
| 5% S + 0.5% YE | ||||
| pH | 4.05 ± 0.03 | 3.99 ± 0.06 | 4.15 ± 0.10 | 4.18 ± 0.03 |
| TTA | 6.78 ± 0.50 | 9.50 ± 0.70 | 5.73 ± 0.45 | 7.50 ± 0.03 |
| 10% S | ||||
| pH | 4.15 ± 0.06 | 4.02 ± 0.01 | 4.18 ± 0.04 | 4.04 ± 0.01 |
| TTA | 6.45 ± 0.07 | 7.70 ± 0.25 | 5.15 ± 0.20 | 6.15 ± 0.49 |
| 10% S + 0.5% YE | ||||
| pH | 4.19 ± 0.049 | 4.02 ± 0.06 | 4.19 ± 0.01 | 4.07 ± 0.02 |
| TTA | 6.70 ± 0.28 | 7.75 ± 0.35 | 5.5 ± 0.42 | 7.00 ± 0.70 |
| 5% S + EPSb | ||||
| pH | 4.17 ± 0.06 | 4.04 ± 0.16 | ND | ND |
| TTA | 8.05 ± 0.21 | 8.85 ± 0.07 | ND | ND |
EPS+ starter cultures were composed of Leuconostoc lactis 95A and Lactobacillus curvatus 69B2, and EPS− starter cultures were composed of Leuconostoc lactis 68A and Lactobacillus curvatus 68A2. Data are means from duplicate analysis of replicate experiments. ND, not determined; S, sucrose; YE, yeast extract. pH and TTA values detected in all experimental conditions immediately after dough mixing were in the range of 3.99 to 4.09 and 0.60 to 0.65 ml NaOH 0.1N/10 g, respectively. The sourdoughs were prepared with 5 or 10% sucrose with and without 0.5% yeast extract.
Sourdough prepared with the addition of EPS (20 ml/500 g of flour) collected directly from the ropiness plates as described in the text.
The production of EPS in wheat sourdough after 15 h of fermentation by the starter EPS+ culture reached a final concentration of 2.3 ± 0.04 g kg−1, whereas the EPS− LAB were unable to produce EPS.
Polysaccharide and viscoelastic behavior of sourdough.
Figure 4A shows the rheological behavior (G′) of sourdough obtained with EPS+ and EPS− LAB at different sucrose concentrations (0, 5, and 10%) after 15 h of fermentation at 30°C. The sourdough had the typical viscoelastic behavior of wheat dough, with the elastic modulus (G′) being higher than the loss modulus (G″) (data not shown), and it showed an upward trend with the oscillation frequency (7, 36). In comparisons of the samples obtained with EPS+ and EPS− LAB, it was observed that in the absence of sucrose, the samples showed no differences in terms of G′. In the presence of 5% sucrose, the rheological characteristics of the sourdough obtained with EPS+ strains had higher G′ values than those of samples with EPS− strains. No differences were observed in the presence of 10% sucrose (data not shown). Figure 4B shows the rheological behavior of the sourdough obtained with EPS+ and EPS− LAB with 5% sucrose after 15 and 30 h of fermentation at 30°C. Upon increasing the fermentation time from 15 to 30 h, a clear decrease in the G′ modulus curve was observed due to structural modification. After 30 h of fermentation, the rheological behavior of samples obtained with EPS+ and EPS− LAB did not show any differences between each other, contrary to what was observed after 15 h. The same results were obtained with 10% sucrose (data not shown). To confirm these results, we compared the rheological behavior of sourdough prepared with the EPS+ LAB with and without EPS crude preparation collected directly from the ropiness plates (Fig. 4C). The results highlighted that the rheological behavior of the two samples were analogous. The addition of yeast extract (0.5%) to sourdough obtained with EPS+ and EPS− LAB and 5 and 10% sucrose after 15 h of fermentation did not affect rheological characteristics, showing no difference in terms of the G′ curve (Fig. 4D).
Fig 4.

Elastic (G′) and dissipative (G″) moduli versus frequency of sourdough obtained with EPS+ and EPS− starter cultures in the presence of 0 and 5% sucrose after 15 h of fermentation (A) and 5% sucrose after 15 and 30 h of fermentation (B). (C) Elastic (G′) modulus versus frequency of sourdough obtained with EPS+ LAB in the presence of 5% sucrose and an in vitro-produced crude preparation of EPS after 15 and 30 h of fermentation. (D) Elastic (G′) and dissipative (G″) moduli versus frequency of sourdough obtained with EPS+ and EPS− starter cultures in the presence of 5 and 10% sucrose and 0.5% yeast extract after 15 h of fermentation.
DISCUSSION
Microorganisms and media for EPS screening.
CA+S without CaCO3 was a very suitable medium to highlight the EPS-producing LAB that formed slimy colonies on agar plates only in the presence of sucrose. EPS production depends on the composition of the medium (carbon and nitrogen sources, growth factors, etc.) and the conditions in which the strains grow, such as temperature, pH, oxygen tension, and incubation time. In particular, the extracellular glucansucrases involved in EPS biosynthesis, especially those of Leuconostoc, are induced by sucrose (39). Most Leuconostoc strains, as well as Lactobacillus curvatus 69B2, showed EPS production in both CA+S and CA+SFM. HoPS-producing LAB strains belonging to Lactobacillus sanfranciscensis, Lactobacillus sakei, Lactobacillus reuteri, and Leuconostoc mesenteroides often are isolated from cereal products, whereas HePS-producing strains are present in high proportions especially in fermented dairy products (27, 56, 60). The synthesis of HoPS is related to the presence of sucrose, which is the sole substrate for glycansucrase, while the transcriptional regulation of HePS synthesis is independent of the kind and quantity of sugar source (18), especially for Leuconostoc species when a high concentration of sucrose is present in the media (40). This simple method was able to highlight viscous colonies on agar plates under visual and phenotype inspection. Since it is only indicative of the EPS production (56, 59), other methods were applied to select the best producers.
Quantification of EPS produced by LAB.
In general, the complexity of the methods used to isolate and purify EPS closely depends on the composition of the culture medium used for its production. EPS quantification is often tested using broth medium (modified broth with any simple sugar) and/or complex media. Therefore, the method applied in this study was simple and advantageous, because the use of a solid medium was able to reduce the presence of contaminating polysaccharides, such as some proteins and/or other high-molecular-mass molecules present in the liquid culture medium. Moreover, solid surfaces of agar culture media stimulate attached bacteria to synthesize EPS with respect to planktonic cells in broth media (38). LAB strains belonging to the species Leuconostoc lactis showed the highest yield of EPS, but the effect of yeast extract on EPS production was quite variable. A previous study reported that most of the LAB strains produced more EPS in the absence of this nutrient (11). Lactobacillus curvatus 69B2, which yielded high and rapid EPS formation in CA, could be enhanced by the optimization of culture conditions (38).
Molecular screening and monosaccharide composition of EPS.
Some LAB strains harbor both HePS (epsD-epsE and epsB) and HoPS (gtf) genes, as previously reported by Van der Meulen et al. (56). Leuconostoc lactis 69B, 68B, and 68A12 showed the presence only of HePS genes. Recent studies have reported that Leuconostoc strains synthesized glucooligosaccharides in the presence of sucrose, mainly highlighting glucansucrase and fructansucrase activity (17, 40) through the appearance of slimy colonies in solid medium. However, under the technological conditions used, they were able to produce an HoPS (dextran) as determined by NMR experiments. The proton spectra of EPS produced by Lactobacillus curvatus 69B2 and Leuconostoc lactis 95A suggested that they were chemically identical to one repeating unit, but the two different extracts showed different diffusivities. Diffusivity decreases with increasing hydrodynamic radius. Hence, the larger the molecular size, the smaller the self-diffusive constant (8). The HSQC spectra indicated a possible α-(1→6) glycosylation between two saccharide monomers that displaces the carbon involved downfield by roughly 10 ppm (35). The preponderance of a repeating dextran unit configured by α-(1→6) linkages in an EPS mixture is plausible (50), since it was previously proved that such a configuration may represent, in specific dextran, up to 97% of total glycosidic linkages depending on specific cultivation conditions and producing strains (20, 35). Indeed, it was found that Leuconostoc strains can synthesize, through dextransucrase, a large amount of dextran with high structural variety (6). The 1H spectrum from Weissella confusa E392 supported the hypothesis that in the two EPS there is a configuration based on α-(1→6)-linked d-glucopyranosyl units with minor saccharidic units. As in previous cases (35), the complete attribution of all 1H signals was not possible due to low signal intensity and detectability.
Cell enumeration, pH, and TTA of sourdough and EPS isolation.
The LAB strains employed in this study showed good growth capacity due to their adaptation to the sourdough ecosystem, demonstrating their ability to be used as starter cultures for baked goods. Although the pH of the mixtures did not suffer significant changes in any of the experimental conditions tested, the decrease in pH to less than 6 could affect EPS production during fermentation (14, 33) and represents a limit for in situ production in industrial applications with respect to the use of EPS as additives. The presence of sucrose and the prolonged fermentation time until 30 h, leading to a higher increase in TTA, could be detrimental to bread quality, since it causes off-flavor and reduces loaf volume as well as crumb softness (22, 44, 57). Indeed, the lower TTA values detected after 15 h of incubation in the same sourdough type were suitable for optimal wheat bread preparation. Sucrose can be utilized in situ principally for the formation of EPS by glycansucrase, although sucrose phosphorylase and sucrose-phosphate transport systems can also be used. The presence of EPS could promote the additional metabolic activity of heterofermentative LAB strains, increasing the production of lactate, acetate, and ethanol (26). The amount detected in sourdough after 15 h of fermentation at 30°C was near the concentration reported in previous papers (15, 25). EPS in situ production by starter cultures during fermentation is an optimal method to avoid the use of EPS as a pure substance, which could be considered an additive that could negatively affect product acceptance by consumers.
Polysaccharides and viscoelastic behavior of sourdough.
Although sourdough has viscoelastic behavior, compared to wheat dough it showed lower modulus values due to the structural change caused by the prolonged fermentation process. Indeed, during fermentation the gluten structure changes and the production of organic acids and enzymatic activity increase, pH decreases, and the production of EPS may occur (4). Elastic modulus values were highly affected by sucrose concentration. In particular, when sucrose was not added the samples obtained with EPS+ and EPS− LAB presented the same value at each frequency. Given the identical growth level of EPS+ and EPS− LAB achieved during fermentation, these results could be explained by the fact that, in the absence of sucrose, HoPS cannot be produced both in vivo and in vitro (24). The results obtained when 5% sucrose was added are in agreement with previous studies (23, 29), which reported pseudoplastic behavior and increased viscosity in sourdough samples obtained with EPS-producing strains. It is reasonable to suppose that the use of sourdough obtained with EPS+ strains allowed a more interconnected structure and better rheological properties. Indeed, the production of HoPS, which are macromolecules with high molecular weight and a linear or branched structure, contributes, together with proteins, to the formation of a dough structure with increased viscoelastic characteristics. The production of EPS could be inhibited with an excess of sucrose, indicating not only that its presence is important for the production of EPS but also that the right concentration is necessary. As expected, fermentation time resulted in a decrease in viscoelastic moduli of the sourdough samples obtained with both starters, probably due to an increase in organic acid. Extending the fermentation time to 30 h could cause structural modifications to the sourdough prepared with EPS+ and EPS− LAB that can hide the effect of EPS on rheological behavior. After 30 h of fermentation, the rise in acidity is known to lead to gradual protein subunit degradation, increasing the rate of swelling and peptidization of the dough proteins and controlling the activity of the proteolytic enzymes; all protein subunits of sourdoughs decreased to the same level, and as a consequence their rheological differences disappeared (44). Yeast extract and sucrose addition to sourdough after 15 h of fermentation did not affect rheological characteristics, showing no difference in terms of the G′ curve as also reported in previous in situ experiments (11).
In conclusion, polyphasic screening allowed us to select new dextran-producing Leuconostoc lactis 95A and Lactobacillus curvatus 69B2 LAB strains. Their biotechnological and applicative potential was revealed through cultural, genetic, and molecular methods, as well as by the assessment of sourdough rheological performance after dough fermentation. Moreover, sourdough obtained after 15 h of fermentation at 30°C with 5% sucrose did not show excessive acidity but resulted in improved viscoelastic properties. Sourdough prepared with such HoPS starter cultures could be used to replace the use of hydrocolloids as texturizing additives and to improve the overall quality of bread and baked sweet products.
Supplementary Material
ACKNOWLEDGMENT
We thank Ferdinando Formisano for his technical assistance.
Footnotes
Published ahead of print 3 February 2012
Supplemental material for this article may be found at http://aem.asm.org/.
REFERENCES
- 1. Altschul SF, et al. 1997. Gapped BLAST and PSI-BLAST: a new generation of protein database search programs. Nucleic Acids Res. 25:3389–3402 [DOI] [PMC free article] [PubMed] [Google Scholar]
- 2. American Association of Cereal Chemists 1975. Cereal laboratory methods, method 44–15A American Association of Cereal Chemists Inc., St. Paul, MN [Google Scholar]
- 3. Anastasio M, et al. 2010. Selection and use of phytate-degrading LAB to improve cereal-based products by mineral solubilization during dough fermentation. J. Food Sci. 75:M28–M35 [DOI] [PubMed] [Google Scholar]
- 4. Arendt EK, Ryan LAM, Dal Bello F. 2007. Impact of sourdough on the texture of bread. Food Microbiol. 24:165–174 [DOI] [PubMed] [Google Scholar]
- 5. Blaiotta G, et al. 2008. Lactobacillus strain diversity based on partial hsp60 gene sequences and design of PCR-restriction fragment length polymorphism assays for species identification and differentiation. Appl. Environ. Microbiol. 74:208–215 [DOI] [PMC free article] [PubMed] [Google Scholar]
- 6. Bounaix MS, et al. 2010. Characterization of glucan-producing Leuconostoc strains isolated from sourdough. Int. J. Food Microbiol. 144:1–9 [DOI] [PubMed] [Google Scholar]
- 7. Cavella S, Torrieri E, Masi P. 2001. Characterization of wheat flour dough structure by means of stress relaxation and oscillatory tests, p 819–824 In Pierucci S. (ed). Proceedings of the 5th Italian Conference on Chemical and Process Engineering, Florence, Italy, 20 to 23 May 2001 [Google Scholar]
- 8. Chapman S, Cowling TG. 1991. Elementary theories of the transport phenomena, p 97–108 In Chapman S, Cowling TG. (ed), The mathematical theory of nonuniform gases: an account of the kinetic theory of viscosity, thermal conduction, and diffusion in gases, 3rd ed Cambridge University Press, Oxford, United Kingdom [Google Scholar]
- 9. Coppola S, Pepe O, Mauriello G. 1998. Effect of leavening microflora on pizza dough properties. J. Appl. Microbiol. 85:891–897 [DOI] [PubMed] [Google Scholar]
- 10. Coppola S, Pepe O, Masi P, Sepe M. 1996. Characterization of leavened doughs for pizza in Naples. Adv. Food Sci. 18:160–162 [Google Scholar]
- 11. Degeest B, Vaningelgem F, De Vuyst L. 2001. Microbial physiology, fermentation kinetics, and process engineering of heteropolysaccharide production by lactic acid bacteria. Int. Dairy J. 11:745–755 [Google Scholar]
- 12. Deveau H, Moineau S. 2003. Use of RFLP to characterize Lactococcus lactis strains producing exopolysaccharides. J. Dairy Sci. 86:1472–1475 [DOI] [PubMed] [Google Scholar]
- 13. De Vuyst L, De Vin F, Vaningelgem F, Degeest B. 2001. Recent developments in the biosynthesis and applications of heteropolysaccharides from lactic acid bacteria. Int. Dairy J. 11:687–707 [Google Scholar]
- 14. De Vuyst L, Vanderveken F, Van de Ven S, Degeest B. 1998. Production by and isolation of exopolysaccharides from Streptococcus thermophilus grown in a milk medium and evidence for their growth-associated biosynthesis. J. Appl. Microbiol. 84:1059–1068 [DOI] [PubMed] [Google Scholar]
- 15. Di Cagno R, et al. 2006. Glucan and fructan production by sourdough Weissella cibaria and Lactobacillus plantarum. J. Agric. Food. Chem. 54:9873–9881 [DOI] [PubMed] [Google Scholar]
- 16. Dubois M, Gilles KA, Hamilton JK, Rebers PA, Smith F. 1956. Colorimetric method for determination of sugars and related substances. Anal. Chem. 28:350–356 [Google Scholar]
- 17. Galle S, Schwab C, Arendt E, Gänzle M. 2010. Exopolysaccharide-forming weissella strains as starter cultures for sorghum and wheat sourdoughs. J. Agric. Food Chem. 58:5834–5841 [DOI] [PubMed] [Google Scholar]
- 18. Gänzle M, Schwab C. 2009. Ecology of exopolysaccharide formation by lactic acid bacteria: sucrose utilization, stress tolerance and biofilm formation, p. 263–278 In Ullrich M. (ed), Bacterial polysaccharides. Current innovation and future trends. Caister Academic Press, Bremen, Germany [Google Scholar]
- 19. He L, et al. 2009. Structural features of a new heteropolysaccharide from the fruit bodies of Melia azedarach and its effect on cytotoxic activity. Fitoterapia 80:399–403 [DOI] [PubMed] [Google Scholar]
- 20. Jeanes A, et al. 1954. Characterization and classification of dextrans from ninety-six strains of bacteria. J. Am. Chem. Soc. 76:5041–5052 [Google Scholar]
- 21. Jolly L, Stingele F. 2001. Molecular organization and functionality of exopolysaccharide gene clusters in lactic acid bacteria. Int. Dairy J. 11:733–745 [Google Scholar]
- 22. Kadizky S, Vogel RF. 2008. Optimization of exopolysaccharide yield in sourdoughs fermented by lactobacilli. Eur. Food Res. Technol. 228:291–299 [Google Scholar]
- 23. Katina K, et al. 2009. In situ production and analysis of Weissella confusa dextran in wheat sourdough. Food Microbiol. 26:734–743 [DOI] [PubMed] [Google Scholar]
- 24. Ketabi A, Soleimanian-Zad S, Kadivar M, Sheikh-Zeinoddin M. 2008. Production of microbial in the sourdough and its effects on the rheological properties of dough. Food Res. Int. 41:948–951 [Google Scholar]
- 25. Korakli M, Rossman A, Gänzle MG, Vogel RF. 2001. Sucrose metabolism and exopolysaccharide production in wheat and rye sourdoughs by Lactobacillus sanfranciscensis. J. Agric. Food Chem. 49:5194–5200 [DOI] [PubMed] [Google Scholar]
- 26. Korakli M, Pavlovic M, Gänzle MG, Vogel RF. 2003. Exopolysaccharide and kestose production by Lactobacillus sanfranciscensis LTH2590. Appl. Environ. Microbiol. 69:2073–2079 [DOI] [PMC free article] [PubMed] [Google Scholar]
- 27. Kralj S, et al. 2004. Glucan synthesis in the genus Lactobacillus: isolation and characterization of glucansucrase genes, enzymes and glucan products from six different strains. Microbiology 150:3681–3690 [DOI] [PubMed] [Google Scholar]
- 28. Kralj S, van Geel-Schutten GH, van der Maarel MJEC, Dijkhuizen L. 2003. Efficient screening methods for glucosyltransferase genes in Lactobacillus strains. Biocatal. Biotransformation 21:181–187 [Google Scholar]
- 29. Lacaze G, Wick M, Cappelle S. 2007. Emerging fermentation technologies: development of novel sourdoughs. Food Microbiol. 24:155–160 [DOI] [PubMed] [Google Scholar]
- 30. Lamothe G, Jolly T, Mollet B, Stingele F. 2002. Genetic and biochemical characterization of exopolysaccharide biosynthesis by Lactobacillus delbrueckii subsp. bulgaricus. Arch. Microbiol. 178:218–228 [DOI] [PubMed] [Google Scholar]
- 31. Laws AP, Chadha MJ, Chacon-Romero M, Marshall VM, Maqsood M. 2008. Determination of the structure and molecular weights of the exopolysaccharide produced by Lactobacillus acidophilus 5e2 when grown on different carbon feeds. Carbohydr. Res. 343:301–307 [DOI] [PubMed] [Google Scholar]
- 32. Laws A, Yucheng G, Marshall V. 2001. Biosynthesis, characterization, and design of bacterial exopolysaccharides from lactic acid bacteria. Biotechnol. Adv. 19:597–625 [DOI] [PubMed] [Google Scholar]
- 33. Looijesteijn PL, Hugenholtz J. 1999. Uncoupling of growth and exopolysaccharide production by Lactococcus lactis subsp. cremoris NIZO B40 and optimisation of its exopolysaccharide synthesis. J. Biosci. Bioeng. 88:159–163 [DOI] [PubMed] [Google Scholar]
- 34. Low D, et al. 1998. Role of Streptococcus thermophilus MR-1C capsular exopolysaccharide in cheese moisture retention. Appl. Environ. Microbiol. 64:2147–2151 [DOI] [PMC free article] [PubMed] [Google Scholar]
- 35. Maina NH, Tenkanen M, Maaheimo H, Juvoven R, Virkki L. 2008. NMR spectroscopic analysis of exopolysaccharides produced by leuconostoc citreum and weissella confusa. Carbohydr. Res. 343:1446–1455 [DOI] [PubMed] [Google Scholar]
- 36. Masi P, Cavella S, Piazza L. 2000. An interpretation of the rheological behavior of wheat flour dough based on fundamental-type tests, p 75–91 In Chinachoti P, Vodovotz Y. (ed), Bread staling. CRC Press, Boca Raton, FL [Google Scholar]
- 37. Mazzei P, Francesca N, Moschetti G, Piccolo A. 2010. NMR spectroscopy evaluation of direct relationship between soils and molecular composition of red wines of Aglianico grapes. Anal. Chim. Acta 673:167–172 [DOI] [PubMed] [Google Scholar]
- 38. Minervini F, et al. 2010. Highly efficient synthesis of exopolysaccharides by Lactobacillus curvatus DPPMA10 during growth in hydrolyzed wheat flour agar. Int. J. Food Microbiol. 141:130–135 [DOI] [PubMed] [Google Scholar]
- 39. Mizutani N, Yamada M, Takayama K, Shoda M. 1994. Constitutive mutants for dextransucrase from Leuconostoc mesenteroides NRRL B-512F. J. Fermen. Bioeng. 77:248–251 [Google Scholar]
- 40. Monsan P, et al. 2001. Homopolysaccharides from lactic acid bacteria. Int. Dairy J. 11:675–685 [Google Scholar]
- 41. Mozzi F, et al. 2006. Diversity of heteropolysaccharide-producing lactic acid bacterium strains and their biopolymers. Appl. Environ. Microbiol. 72:4431–4435 [DOI] [PMC free article] [PubMed] [Google Scholar]
- 42. Palomba S, Blaiotta G, Ventorino V, Saccone A, Pepe O. 2011. Microbial characterization of sourdough for sweet baked products in the Campania region (southern Italy) by a polyphasic approach. Ann. Microbiol. 61:307–314 [Google Scholar]
- 43. Pepe O, Villani F, Coppola S. 2001. Differential viable count of mixed starter cultures of lactic acid bacteria by using modified Chalmers medium. Microbiol. Res. 155:351–354 [DOI] [PubMed] [Google Scholar]
- 44. Pepe O, Villani F, Oliviero D, Greco T, Coppola S. 2003. Effect of proteolytic starter cultures as leavening agents for pizza dough. Int. J. Food Microb. 84:319–326 [DOI] [PubMed] [Google Scholar]
- 45. Pepe O, Blaiotta G, Moschetti G, Greco T, Villani F. 2003. Rope-producing strains of Bacillus spp. from wheat bread and strategy for their control by lactic acid bacteria. Appl. Environ. Microbiol. 69:2321–2329 [DOI] [PMC free article] [PubMed] [Google Scholar]
- 46. Pepe O, et al. 2004. Technological and molecular diversity of Lactobacillus plantarum strains isolated from naturally fermented sourdoughs. Syst. Appl. Microbiol. 27:443–453 [DOI] [PubMed] [Google Scholar]
- 47. Provencher C, LaPointe G, Siros S, van Calsteren MR, Roy D. 2003. Consensus degenerate hybrid oligonucleotide primers for amplification of priming glycosyltransferase genes of the exopolysaccharide locus in strains of the Lactobacillus casei group. Appl. Environ. Microbiol. 69:3299–3307 [DOI] [PMC free article] [PubMed] [Google Scholar]
- 48. Rodríguez-Carvajal MA, et al. 2008. Structure of the high-molecular weight isolated from Lactobacillus pentosus LPS26. Carbohydr. Res. 343:3066–3070 [DOI] [PubMed] [Google Scholar]
- 49. Ruas-Madiedo P, Abraham A, Mozzi F, de los Reyes-Gavilán CG. 2008. Functionality of exopolysaccharides produced by lactic acid bacteria, p 137–166 In Mayo B, Ĺopez P, Pérez-Martínez G. (ed), Molecular aspects of lactic acid bacteria for traditional and new applications. Research Signpost, Kerala, India [Google Scholar]
- 50. Ruas-Madiedo P, Salazar N, Reyes-Gavilán CG. 2009. Biosynthesis and chemical composition of exopolysaccharides produced by lactic acid bacteria, p 279–310 In Ullrich M. (ed), Bacterial polysaccharides. Current innovation and future trends. Caister Academic Press, Bremen, Germany [Google Scholar]
- 51. Senn H, Schlotterbeck G. 2007. NMR spectroscopy techniques for application to metabonomics, p 55–112 In Lindon JC, Nicholson JK, Holmes E. (ed), The handbook of metabonomics and metabolomics. Elsevier, Amsterdam, Netherlands [Google Scholar]
- 52. Sorensen JL, Witherell R, Browne LM. 2006. Use of 1H NMR in assigning carbohydrate configuration in the organic laboratory. J. Chem. Educ. 83:758–787 [Google Scholar]
- 53. Thompson JD, Higgins DG, Gibson TJ. 1994. Clustal-W-improving the sensitivity of progressive multiple sequence alignment through sequence weighting, position-specific gap penalties and weight matrix choice. Nucleic Acids Res. 22:4673–4680 [DOI] [PMC free article] [PubMed] [Google Scholar]
- 54. Tieking M, Gänzle MG. 2005. Exopolysaccharides from cereal-associated lactobacilli. Trends Food Sci. Technol. 16:79–84 [Google Scholar]
- 55. Tieking M, Korakli M, Ehrmann MA, Gänzle MG, Vogel RF. 2003. In situ production of exopolysaccharides during sourdough fermentation by cereal and intestinal isolates of lactic acid bacteria. Appl. Environ. Microbiol. 69:945–952 [DOI] [PMC free article] [PubMed] [Google Scholar]
- 56. Van der Meulen R, et al. 2007. Screening of lactic acid bacteria isolated from dairy and cereal products for exopolysaccharide production and genes involved. Int. J. Food Microbiol. 118:250–258 [DOI] [PubMed] [Google Scholar]
- 57. van Kranenburg R, Marugg JD, van Swam II, Willem NJ, de Vos WM. 1997. Molecular characterization of the plasmid encoded eps gene cluster essential for exopolysaccharide biosynthesis in Lactococcus lactis. Mol. Microbiol. 24:387–397 [DOI] [PubMed] [Google Scholar]
- 58. Vescovo M, Scolari GL, Bottazzi V. 1989. Plasmid-encoded ropiness production in Lactobacillus casei ssp. casei. Biotechnol. Lett. 10:709–711 [Google Scholar]
- 59. Welman AD, Maddox IS. 2003. Exopolysaccarides from lactic acid bacteria: perspectives and challenges. Trends Biotechnol. 21:269–274 [DOI] [PubMed] [Google Scholar]
- 60. Wszolek M, Kupiec-Teahan B, Skov Guldager H, Tamine AY. 2006. Production of kefir, koumiss and other related products, p 174–216 In Tamine AY. (ed), Fermented milks. Blackwell Science, Oxford, United Kingdom [Google Scholar]
Associated Data
This section collects any data citations, data availability statements, or supplementary materials included in this article.