Abstract
Diabetic nephropathy (DN) is a long-term complication of diabetes mellitus that leads to end-stage renal disease. Microalbuminuria is used for the early detection of diabetic renal damage, but such levels do not reflect the state of incipient DN precisely in type 2 diabetic patients because microalbuminuria develops in other diseases, necessitating more accurate biomarkers that detect incipient DN. Isobaric tags for relative and absolute quantification (iTRAQ) were used to identify urinary proteins that were differentially excreted in normoalbuminuric and microalbuminuric patients with type 2 diabetes where 710 and 196 proteins were identified and quantified, respectively. Some candidates were confirmed by 2-DE analysis, or validated by Western blot and multiple reaction monitoring (MRM). Specifically, some differentially expressed proteins were verified by MRM in urine from normoalbuminuric and microalbuminuric patients with type 2 diabetes, wherein alpha-1-antitrypsin, alpha-1-acid glycoprotein 1, and prostate stem cell antigen had excellent AUC values (0.849, 0.873, and 0.825, resp.). Moreover, we performed a multiplex assay using these biomarker candidates, resulting in a merged AUC value of 0.921. Although the differentially expressed proteins in this iTRAQ study require further validation in larger and categorized sample groups, they constitute baseline data on preliminary biomarker candidates that can be used to discover novel biomarkers for incipient DN.
1. Introduction
Diabetes mellitus is a chronic disease with potentially devastating complications. For example, diabetes mellitus is associated with macrovascular complications, such as cardiovascular and cerebrovascular diseases, and microvascular complications, including diabetic nephropathy (DN) and retinopathy [1]. DN is a long-term complication of diabetes that is caused by specific renal structural alterations, such as mesangium expansion due to the progressive accumulation of extracellular matrix (ECM), and by functional losses, such as elevated glomerular basement membrane (GBM) permeability [2].
DN occurs in 15% to 25% of type 1 diabetic patients and 30% to 40% of type 2 diabetic patients [3] and accounts for approximately one-half of all new cases of end-stage renal disease (ESRD). Furthermore, ESRD has a 5-year survival rate of only 21% [4]. Because the progression of ESRD in DN is irreversible, the early diagnosis of DN is necessary to prevent or delay progression to ESRD [5]. Microalbuminuria represents a potentially reversible incipient stage of nephropathy and is used as a noninvasive index for the detection of diabetic renal disease. Microalbuminuria is defined as a state in which abnormal amounts of albumin are excreted in urine (30–300 mg/24 h versus <30 mg/24 h in normoalbuminuria) [5, 6].
The use of microalbuminuria to predict incipient DN, particularly in type 2 diabetic patients, is limited for several reasons [7]: the microalbuminuric state also predicts cardiovascular disease in diabetic and nondiabetic individuals [8, 9], and it is associated with inflammation and hypertension [5]. Consequently, the likelihood of detecting nondiabetic renal disease or normal glomerular structure is observed with microalbuminuria patients [10]. Thus, more accurate biomarkers for incipient DN in type 2 diabetic patients are required that can differentiate incipient DN from other conditions in microalbuminuria patients, including cardiovascular disease, inflammation, and hypertension.
Recently, to compare DN patients with non-DN patients, proteomic technologies have been developed to identify urinary marker candidates that are associated with the development of DN. Various proteomic approaches have been used for this purpose, including 2-DE, 2-DE DIGE, and SELDI-TOF [5, 11, 12]. However, because many studies have focused on restricted sets of targeted proteins, alterations in comprehensive urinary protein profiles in type 2 diabetes have not been monitored. In particular, SELDI-TOF has been shown to be a valuable technology for urinary proteomic analysis, but the absolute identification of differentially excreted proteins remains challenging [13].
To scan a comprehensive differential proteome for preliminary DN candidate biomarkers, we used a 4-plex isobaric tag for relative and absolute quantification (iTRAQ, 4-plex), allowing us to identify and quantify proteins in up to 4 samples [14]. The advantages of iTRAQ include whole labeling of representative or pooled samples, comparatively high throughput, and retention of posttranslational modification (PTM) data; one of its shortcomings is that it cannot be applied easily to a large collection of individual clinical samples due to reagent cost and the required mass spectrometry effort [15]. To date, iTRAQ has been applied to a variety of sample sets, including E. coli, mammalian cells, yeast, plant cells, and human biological fluids [16–22].
Therefore, in this study, we used iTRAQ to identify and quantify differentially excreted urinary proteins in microalbuminuric versus normoalbuminuric type 2 diabetic patients and investigate the associations that would reflect the progress of DN. Afterward, those differentially excreted urinary proteins have been confirmed by 2-DE, followed by MALDI-TOF/TOF, or validated by Western blot and MRM.
2. Materials and Methods
2.1. Urine Sample Preparation
Type 2 diabetic subjects (age ≥ 40 years) with or without microalbuminuria who were patients at the Diabetes Center of Seoul National University Hospital, Seoul, Republic of Korea, were enrolled in 2006. Microalbuminuria patients were randomly selected out of these outpatients, whereas normoalbuminuric patients were selected to be matched to age, sex, body mass index (BMI), and DM duration with microalbuminuric patients.
Forty-three subjects with diabetic retinopathy and persistent microalbuminuria formed the microalbuminuria group (MA). Persistent microalbuminuria was defined as an albumin : creatinine ratio (ACR) between 30 and 300 mg/g in 2 urine samples that were taken over 3 months. The normoalbuminuria group (NA) comprised subjects who had no diabetic retinopathy, did not use angiotensin inhibitors or angiotensin receptor blockers that lowered albuminuria, and showed no microalbuminuria in their urine in the past year (urinary albumin < 30 mg/g creatinine). Forty-three subjects formed the NA group.
There were no significant differences in age, sex, body mass index, or diabetes mellitus duration between the 2 study groups. Subjects with hematuria, uncontrolled hypertension (blood pressure ≥ 140/90 mm Hg), uncontrolled hyperglycemia (glycated hemoglobin A1c ≥ 8.5%), urinary tract infection, acute febrile illness, congestive heart failure, or malignancy were excluded. Individuals who were receiving peroxisome proliferator-activated receptor gamma agonists were also excluded. Midstream urine of spot urine samples were collected in sterile 50-mL tubes that contained 50 μL 0.1 mM PMSF (serine protease inhibitor) and 500 μL 1 mM sodium azide from 86 patients and were stored at −80°C until use. Informed consent was obtained from all subjects after obtaining approval for the study from the Institutional Review Board at Seoul National University Hospital.
Urine albumin and creatinine were measured in spot urine samples by immunoturbidimetric method using the TIA Micro Alb Kit (Nittobo, Tokyo, Japan) and enzymatic creatinine assay (Roche, Mannheim, Germany), respectively, on a Hitachi 7170 autoanalyzer (Hitachi, Tokyo, Japan).
For the iTRAQ and 2-DE experiments, pooled urine samples, based on average albumin-to-creatinine ratios, were used; the clinical characteristics of the study subjects are summarized in Table 1. Because the protein concentration of each urine sample varied widely, depending on the urine volume in the morning, equal amounts of total protein from each patient were pooled to prepare the urine samples (NA1–NA4 and MA1–MA4).
Table 1.
Clinical characteristics of normoalbuminuric (NA) and microalbuminuric (MA) type 2 diabetic patients.
| Characteristics | NA 1a | MA 1a | NA 2b | MA 2b | NA 3c | MA 3c | NA 4d | MA 4d |
|---|---|---|---|---|---|---|---|---|
| (n = 9) | (n = 9) | (n = 9) | (n = 9) | (n = 9) | (n = 9) | (n = 16) | (n = 16) | |
| Gender (M/F) | 4/5 | 5/4 | 5/4 | 4/5 | 5/4 | 4/5 | 9/7 | 9/7 |
| Mean age (years) | 62.4 ± 8.0 (49–72) |
66.4 ± 7.8 (55–82) |
60.7 ± 4.7 (54–67) |
61.9 ± 2.7 (56–65) |
64.9 ± 5.3 (56–73) |
62.3 ± 4.4 (41–72) |
63.7 ± 7.5 (49–72) |
63.2 ± 9.8 (44–82) |
| Duration of diabetes (years) | 9.1 ± 4.4 | 10.4 ± 7.0 | 8.7 ± 5.0 | 7.3 ± 4.7 | 13.0 ± 9.0 | 10.6 ± 7.7 | 9.9 ± 4.8 | 11.6 ± 7.3 |
| BMI (kg/m2) | 25.4 ± 3.0 | 24.9 ± 3.3 | 23.8 ± 2.1 | 24.9 ± 3.6 | 23.1 ± 2.7 | 22.6 ± 2.6 | 24.4 ± 2.9 | 25.1 ± 2.9 |
| Fasting plasma glucose (mg/dL) | 130.8 ± 21.1 | 133.8 ± 36.4 | 131.3 ± 31.9 | 135.8 ± 41.3 | 117.8 ± 21.7 | 117.6 ± 26.6 | 132.4 ± 19.2 | 144.8 ± 35.7 |
| HbA1C (%) | 6.8 ± 0.7 | 6.8 ± 0.9 | 6.9 ± 0.7 | 7.4 ± 0.8 | 7.2 ± 0.7 | 7.2 ± 0.7 | 6.8 ± 0.6 | 7.0 ± 0.8 |
| Blood urea nitrogen (mg/dL) | 15.1 ± 4.8 | 17.1 ± 4.9 | 13.8 ± 2.4 | 15.7 ± 3.9 | 16.8 ± 3.4 | 17.7 ± 4.4 | 15.1 ± 3.9 | 16.4 ± 4.1 |
| Serum creatinine (mg/dL) | 1.0 ± 0.1 | 1.1 ± 0.2 | 0.9 ± 0.2 | 1.0 ± 0.1 | 1.0 ± 0.2 | 1.0 ± 0.2 | 0.98 ± 0.13 | 1.0 ± 0.15 |
| Serum total cholesterol (mg/dL) | 184.4 ± 34.5 | 180.6 ± 29.1 | 164.2 ± 25.5 | 165.6 ± 24.5 | 164.9 ± 22.2 | 175.4 ± 50.7 | 181.5 ± 29.7 | 182.1 ± 25.5 |
| Serum HDL cholesterol (mg/dL) | 48.1 ± 12.2 | 46.1 ± 8.8 | 52.3 ± 9.5 | 48.9 ± 8.3 | 55.0 ± 7.8 | 41.5 ± 4.7 | 46.4 ± 10.8 | 46.8 ± 7.7 |
| Serum LDL cholesterol (mg/dL) | 99.8 ± 26.6 | 102.6 ± 22.3 | 91.0 ± 21.6 | 92.0 ± 27.6 | 85.9 ± 20.3 | 98.8 ± 30.0 | 102.0 ± 23.4 | 104.1 ± 19.7 |
| Serum triglycerides (mg/dL) | 119.9 ± 37.0 | 158.6 ± 55.9 | 132.9 ± 66.1 | 177 ± 134.7 | 128.3 ± 82.8 | 186.3 ± 66.8 | 126.5 ± 56.5 | 145.4 ± 51.6 |
| Albumin : creatinine ratio (mg/g) | 12.2 ± 7.1 | 120.5 ± 70.7e | 10.0 ± 3.6 | 82.6 ± 41.9f | 8.8 ± 1.6 | 86.1 ± 47.1g | 9.8 ± 6.9 | 107.4 ± 69.4 h |
| Pooled urine concentration (mg/mL) | 3.7 ± 1.6 | 6.9 ± 3.4 | 4.1 ± 1.2 | 8.1 ± 4.2 | 4.7 ± 1.2 | 7.6 ± 3.8 | 4.3 ± 1.8 | 7.1 ± 4.5 |
a–cSample sets for the three iTRAQ experiments, dsample sets for 2-DE, e P < 0.001 for NA1 versus MA1, f P < 0.001 for NA2 versus MA2, g P < 0.05 for NA3 versus MA3, and h P < 0.001 for NA4 versus MA4. Data are expressed as the mean ± SD.
To prepare the protein samples, approximately 50 mL aliquots of normoalbuminuric and microalbuminuric urine were centrifuged at 3000 g for 30 min at 4°C. Supernatants were filtered through a 0.22 μm MILLEX GP membrane (Millipore, Carrigtwohill, Cork, Ireland) and concentrated to 3 mL in an Amicon ultrafiltration cell (YM2, 3 kDa MW cut-off, Millipore). The concentrated urine samples were then desalted by dialysis twice using a Slide-A-Lyzer dialysis cassette kit (3.5 kDa, Pierce, Rockford, ILUSA) against 1000 volumes of distilled water, containing 0.1 mM PMSF (serine protease inhibitor) and 1 mM β-ME, at 4°C. Proteins in the dialyzed urine were precipitated with 5 volumes of acetone for 4 hrs at −20°C, and the resulting pellets were washed 3 times with cold acetone; the supernatants were discarded.
2.2. Labeling with iTRAQ Reagents
Aliquots of 100 μg of protein were reduced, alkylated, digested, and labeled according to the manufacturer's instructions (Applied Biosystems, Foster City, CA, USA). Briefly, 1 μL of denaturant (2% SDS) and 1 μL of reducing reagent (50 mM tris-[2-carboxyethyl] phosphine) were added to each sample and incubated for 1 hr at 60°C. Each sample was allowed to cool at room temperature, and 1 μL of cysteine blocking reagent (200 mM methyl methanethiosulfonate (MMTS) in isopropanol) was added and incubated for 20 min at room temperature. The tubes were digested with trypsin (Promega, Madison, WI, USA) at a protein-to-enzyme ratio of 10 : 1 at 37°C overnight, and the contents of one vial of iTRAQ reagent, dissolved in 70 μL of ethanol, were added to each peptide mixture and incubated for 1 hr at room temperature.
In this study, 3 iTRAQ experiments were performed. The detailed iTRAQ labeling strategy is summarized for the specified NA/MA urine samples in Figure 1 and Table 1; iTRAQ Experiments 1, 2, and 3 were performed for labeling (a) and (b), (c) and (d), and (e), respectively. Each normoalbuminuric peptide was labeled with iTRAQ reagents 114, 115, and 116, and the microalbuminuric peptide was labeled with iTRAQ reagents 115 and 117 (Figure 1). The 2 sample sets (microalbuminuric and normoalbuminuric) were combined and dried. To analyze the proteome quantitatively using iTRAQ labeling, we determined the labeling efficiency, as described [23]; the number of possible labeling sites (the N-termini of all peptides and lysine side chains) in 21,610 peptides were compared manually with that of completely labeled sites, represented by the Pro GroupTM Algorithm in ProteinPilot.
Figure 1.
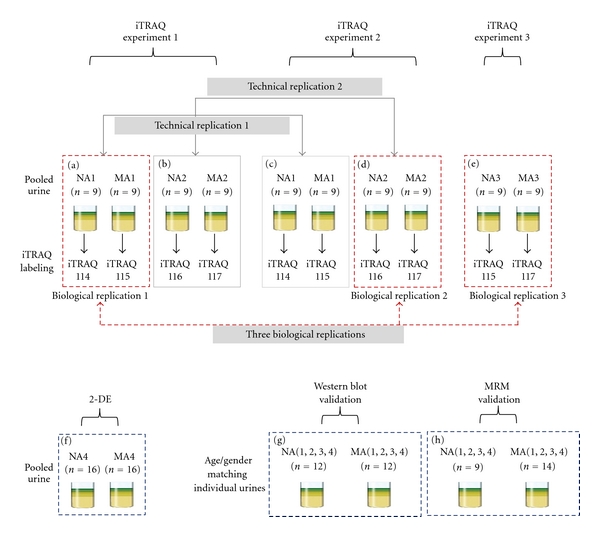
Workflow of iTRAQ, 2-DE, Western blot, and MRM of the urinary proteome. For analysis of the urinary proteome, 3 iTRAQ experiments were performed, 2-DE, Western blot, and MRM were conducted to confirm and validate the iTRAQ results. iTRAQ experiments 1, 2, and 3 were performed, labeled (a) and (b), (c) and (d), and (e), respectively, wherein 3 biological replicates (labeled (a), (d), and (e), resp.), technical replicate 1 (labeled (a) and (c)), and technical replicate 2 (labeled (b) and (d)) were performed in microalbuminuric versus normoalbuminuric urine. 2-DE, Western blot, and MRM analysis of the urinary proteome were conducted using labeled (f), (g), and (h), respectively.
2.3. Strong Cation Exchange Chromatographic Fractionation
iTRAQ-labeled samples were subjected to LC-MS/MS at the National Instrumentation Center for Environmental Management, Seoul National University, and fractionated using strong cation exchange (SCX) chromatography, as follows. Dried samples were reconstituted in 500 μL of buffer A (25% v/v acetonitrile (ACN) and 5 mM ammonium formate, adjusted to pH 2.7 with formic acid) and loaded onto a PolySULFOETHYL A column (4.6 mm id × 100 mm, 5 μm, 200 Å; PolyLC, Columbia, MD, USA) in a HP1100 series HPLC (Agilent Technologies, Palo Alto, CA, USA). The column was equilibrated for 5 min in buffer A, and the peptides were eluted using a gradient of 0% to 30% buffer B (25% v/v ACN and 1 M ammonium formate [pH 3] with formic acid) over 80 min and 30% to 90% buffer B for 40 min at a flow rate of 0.7 mL/min. Absorbance was monitored at 280 nm, and the fractions were collected every 2 min after injection.
2.4. LC-MS/MS Analysis
Fractions were reconstituted in solvent A and injected into an LC-ESI-MS/MS system. LC-MS/MS was performed using an integrated system, which consisted of an autosampler switching pump and a micropump (Tempo Nano LC system; Applied Biosystems) with a hybrid quadrupole-TOF LC-MS/MS spectrometer (QStar Elite; Applied Biosystems) that was equipped with a nanoelectrospray ionization source (Applied Biosystems) and fitted with a 10 μm fused silica emitter tip (New Objective, Woburn, MA, USA).
Peptides were first trapped on a Zorbax 300SB-C18 trap column (300 μm id × 5 mm, 5 μm, 100 Å; Agilent Technologies), washed for 10 min with 98% solvent A (water/ACN [98 : 2 v/v] and 0.1% formic acid) and 2% solvent B (water/ACN [2 : 98 v/v] and 0.1% formic acid) at a flow rate of 10 μL/min, and separated on a Zorbax 300SB-C18 capillary column (75 μm id × 150 mm, 3.5 μm, 100 Å) at a flow rate of 300 nL/min. The LC gradient was run at 2% to 35% solvent B over 120 min and from 35% to 90% over 10 min, followed by 90% solvent B for 15 min, and finally 5% solvent B for 35 min. The resulting peptides were electrosprayed through a coated silica tip (New Objective) at an ion spray voltage of 2300 eV.
For data acquisition, the mass spectrometer was set in the positive ion mode at a selected mass range of 400–1600 m/z for a 1 sec TOF-MS survey scan to detect precursor ions. The 5 most abundant peptides (count >20) with charge states of +2 to +4 were selected to perform the information-dependent acquisition (IDA) of MS/MS data. Once selected, the precursor ions were dynamically excluded for 60 sec at a mass tolerance of 100 ppm.
2.5. Data Analysis
Data file processing, protein identification, and relative abundance quantification were performed using ProteinPilot v.2.0.1 (Applied Biosystems; MDS-Sciex, Concord, Canada) and the Paragon algorithm [24]. Database searches were performed against the Celera human database (human KBMS 5.0, 2005-03-02; a total of 187,748 entries provided by Applied Biosystems). The search parameters used were: a peptide and fragment ion mass tolerance of 0.2 Da; 1 missed trypsin cleavage; fixed cysteine modification by MMTS; variable oxidation of methionine; and iTRAQ labeling of the N-termini of peptides and lysine side chain residues.
The confidence threshold for protein identification was an unused ProtScore >1.3 (95% confidence interval). ProteinPilot computes a percentage confidence that reflects the probability that a hit is a false positive; thus, at the 95% confidence level, the false positive identification rate is approximately 5% [24, 25]. Although this program automatically accepts all peptides that have a confidence level >1%, only proteins with at least 1 peptide that had a confidence level >95% were initially recorded. At these low confidence levels, peptides do not identify a single protein by themselves but, rather, support protein identification in the presence of other peptides [24, 25]. Quantification results were reported only when the error factor (EF) was <2, which indicates a standard deviation of quantification <20%.
2.6. GO Ontology Analysis
The “biological process” and “molecular function” classifications were analyzed using PANTHER ID numbers (http://www.pantherdb.org/), provided in the ProteinPilot output when a Celera human database is used. To construct a graphical representation of differentially excreted proteins, MultiExperiment Viewer (Version 4.3) was used, allowing us to generate a “heatmap” of differentially excreted proteomes (http://www.tm4.org/mev/).
2.7. 2-DE Urinary Proteome and PMF Analysis
Urine samples were pooled from 16 type 2 diabetic patients with normoalbuminuria and 16 type 2 diabetic patients with microalbuminuria. The characteristics of the pooled urine samples for 2-DE are shown in Figure 1 and Table 1. For the PMF analysis, a MALDI-TOF/TOF mass spectrometer (ABI 4700 Proteomics Analyzer, Applied Biosystems) was used as described in our previous papers [26, 27].
2.8. Western Blot Analysis
Twenty-four urine samples that were matched for gender and age (NA: 6 females and 6 males, and MA: 6 females; 6 males) were selected from the urine sample groups (NA1–NA4 and MA1–MA4, resp.) and subjected to Western blot validation of the 6 representative candidates from the iTRAQ experiments (Figures 1 and 6, and Table 1). The primary antibodies were directed against transferrin (1 : 500, AbFrontier, Seoul, Korea), ceruloplasmin (1 : 1000, AbFrontier), α1-antitrypsin (1 : 1000, AbFrontier), vitamin D-binding protein (1 : 1000, AbFrontier), α1-acid glycoprotein (1 : 2000, AbFrontier), and haptoglobin (1 : 1000, AbFrontier).
Figure 6.

Validation using Western blot for six representative differentially excreted proteins. The concentrations of transferrin (a), ceruloplasmin (b), α1-antitrypsin (c), vitamin D-binding protein (d), α1-acid glycoprotein (e), and haptoglobin (f) are significantly higher in microalbuminuric patients versus normoalbuminuric urine. The relative intensities on the vertical axis indicate normalized values versus the representative control. Each bar represents the mean ± SEM, based on the relative intensities of the gel bands. Statistical significance for the differences (*P < 0.05; **P < 0.01; ***P < 0.005; ****P < 0.0005) were determined by paired Student's t-test. Two representative NA and MA blots are shown at the top of the bar graphs.
2.9. Candidate Validation Using Multiple Reaction Monitoring
In addition to Western blot, multiple reaction monitoring (MRM) was performed to verify the candidate biomarkers using 9 NA and 14 MA urine samples from the urine sample groups (NA1–NA4 and MA1–MA4, resp.) (Figure 1 and Table 1). In our MRM experiment [28], triple quadrupole linear ion trap MS (4000 Qtrap, coupled with a nano Tempo MDLC, Applied Biosystems) was performed; the detailed procedure is previously described [28]. Data were processed using the MultiQuant program (Applied Biosystems, version 1.0), and each peak area of the transitions was normalized to an input internal standard (Q1/Q3 transitions at 542.3/636.3 m/z for beta-galactosidase peptide) [28]. In the statistical analysis, receiver operating characteristic (ROC) curves and interactive plots were generated using Medicalc (MedCalc Software, Mariakerke, Belgium, version 10.0.1.0).
3. Results
3.1. Identification of Urinary Proteomes from Normoalbuminuric and Microalbuminuric Patients
For the iTRAQ experiments, 3 biological replicates (biological replicate 1 was labeled (a), replicate 2 was labeled (d), and replicate 3 was labeled (e)); 2 technical replicates (technical replicate 1 was labeled (a) and (c), replicate 2 was labeled (b) and (d)) were generated from normoalbuminuric and microalbuminuric urine (Figure 1). The 3 biological replicates were used to profile and quantitate the urinary proteome; the 2 technical replicates were used solely to determine the cutoff for significant fold-changes.
Seven hundred ten proteins were identified from 21,610 peptides of the 3 combined biological replicates at a minimum confidence level of 95% (unused ProtScore > 1.3). Of the proteins that were identified by iTRAQ, 27% comprised 1-peptide proteins; 14% was 2-peptide proteins; 8% was 3-peptide proteins; 5% was 4-peptide proteins; 46% comprised proteins that had 5 or more peptides. In our iTRAQ experiment, 83 proteins (unused ProtScore > 1.3) were common to all 3 biological replicates at a minimum confidence level of 95%, using 3 different pooled urine samples.
3.2. Determination of Cutoff for Significant Fold-Change in iTRAQ Experiments
To generate the quantitative proteome using iTRAQ labeling, we first determined the labeling efficiency, which exceeded 98% (data not shown). Next, the cutoff for significant fold-change was determined based on the 2 technical replicates ((a) and (c) of iTRAQ experiment 1, (b); (d) of iTRAQ experiment 2) (Figure 1). In the 2 replicate experiments, the number of commonly identified proteins was 173 (2 [115/114] ratios from technical replicate 1) and 107 (2 [117/116] ratios from technical replicate 2), and the number of selected proteins was 44 (2 [115/114] ratios from technical replicate 1) and 26 (2 [117/116] ratios from technical replicate 2), which were chosen based on the following criteria: it contained more than 2 unique peptides (>95%), and P value <0.05 for the 115/114 and 117/116 reporter ions. The 70 proteins were used to monitor technical variations and confirm the threshold for meaningful differences.
The technical variations for the 115/114 and 117/116 reporter ions, calculated using the ratios of the 44 and 26 commonly observed proteins between the 2 technical replicates, were r2 = 0.9527 and r2 = 0.9178, respectively (Figure 2(a)). Accordingly, 90% of the commonly observed in the technical replicates fell within 25% of the respective experimental variation (Figure 2(b)). Therefore, we set fold-change thresholds of >1.25 or <0.80 to identify true differences between the expression of 115/114 and 116/117 reporter ions, as described in [23].
Figure 2.
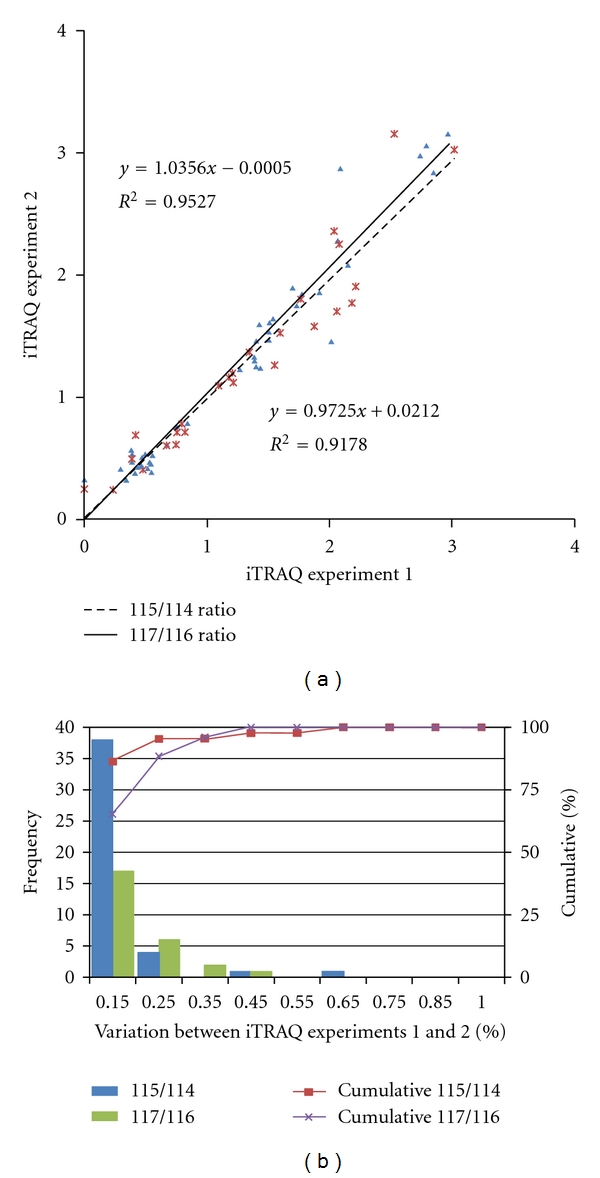
Correlation between the 2 technical replicates and determination of the cutoff value for significant fold changes. (a) Plots of iTRAQ ratios for two technical replicates. Forty-four proteins were commonly observed from technical replicate 1 (labeled 115/114), and 26 proteins were commonly observed from technical replicate 2 (labeled 117/116). These differentially excreted proteins (P value < 0.05, more than two unique peptides: >95%) were plotted in the linear dynamic range. The technical variations yielded a correlation coefficient of r 2 = 0.9527 and r 2 = 0.9178 between iTRAQ experiments 1 and 2, respectively. (b) The % variations for the common proteins from the two technical replicates. The 44 and 26 common proteins from the 2 technical replicates were used as inputs to calculate % variations. The vertical axis represents the number of proteins, and the horizontal axis denotes % variation. Ninety percent of the proteins fell within 25% of the respective experimental variation. Thus, we considered a fold-change of >1.25 or <0.80, a meaningful cutoff that represented actual differences in the iTRAQ experiments.
3.3. Differential Proteomes between Microalbuminuria and Normoalbuminuria
In our iTRAQ study, we obtained diverse biomarker candidates from 3 pooled biological NA/MA urine samples (each pooled NA or MA urine sample consisted of 9 individual urine specimens; thus, the 3 pooled NA, and 3 pooled MA urine samples comprised 54 different individual urine samples). Further, biomarker candidates were confirmed and validated by 2-DE, Western blot, and MRM.
To analyze urinary proteomes in normoalbuminuria and microalbuminuria subjects, 3 biological replicates were generated, wherein 196 proteins met the following criteria: P value < 0.05, EF < 2, more than 2 unique peptides with >95% confidence level, and protein expression >1.25 or <0.80 for all reporter ions; 99 and 97 proteins were upregulated and downregulated, respectively (Appendix A).
These proteins were further analyzed by differential proteomic expression. All quantified proteins were classified into “biological process” and “molecular function” subcategories using the PANTHER classification program, allowing us to analyze phenotypic features and molecular functions between microalbuminuria and normoalbuminuria (Figure 3). Moreover, to visualize the comprehensive functional annotations graphically, such as in a heatmap, the 196 proteins were first categorized by “biological process,” and a second dimension was added to coordinate the “molecular function” subcategories (Figure 3). The 196 proteins constituted a preliminary list of biomarkers; Figure 3 shows the expression ratios of the iTRAQ dataset and differentially excreted proteins in microalbuminuria versus normoalbuminuria urine.
Figure 3.
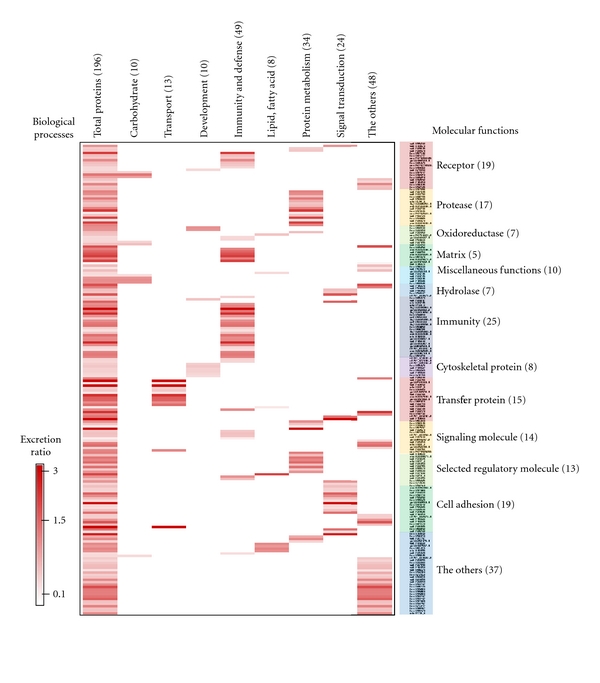
Comprehensive functional annotation of the differentially excreted proteome. The 196 quantitated urinary proteins were annotated for the “biological process” (x-axis) and “molecular function” subcategories (y-axis) in a heatmap. The “biological process” and “molecular function” categories comprised 8 and 13 subcategories, respectively. The 196 quantitated urinary proteins are individually assigned into the “biological process” and “molecular function” subcategories.
3.4. Classification of Urinary Proteomes in Microalbuminuria versus Normoalbuminuria
The 196 proteins from the 3 biological replicates were categorized by PANTHER ID number into “biological process” and “molecular function” groups; certain subcategories are summarized in Figures 4(a) and 4(b).
Figure 4.
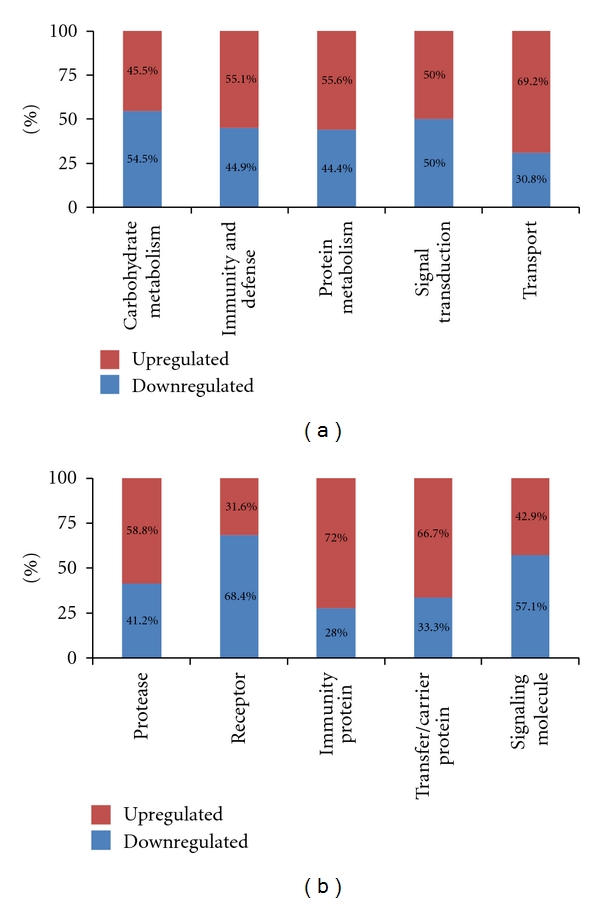
Functional distribution of differentially excreted proteins in microalbuminuria versus normoalbuminuria. Functional classification of differentially excreted proteins into (a) “biological process” and (b) “molecular function.” Only 5 major subcategories for “biological process” and “molecular function” are shown; each subcategory is presented as the percentage of up- and down-regulated proteins.
The “biological process” subcategories accounted for 196 differentially excreted proteins, wherein “immunity and defense” and “protein metabolism” represented 49 and 34 of the quantitated proteins, respectively—the 2 largest components (Figure 3). Moreover, in the “biological process” subcategories, “carbohydrate metabolism” (54.5%) and “signal transduction” (50%) were downregulated in microalbuminuric versus normoalbuminuric urine (Figure 4(a)). In contrast, 69.2%, 55.6%, and 55.1% of the 196 proteins were upregulated in the “transport,” “protein metabolism,” and “immunity and defense” subcategories, respectively (Figure 4(a)).
The “molecular function” subcategories accounted for 196 differentially excreted proteins, in which “immunity” and “receptor” represented 25 and 19 of the quantitated proteins, respectively—the 2 largest components (Figure 3). In the “molecular function” subcategories, “receptor” (68.4%) and “signaling molecule” (57.1%) proteins were down-regulated in microalbuminuric versus normoalbuminuric urine (Figure 4(b)). In contrast, 72.0%, 58.8%, and 66.7% of the 196 proteins were up-regulated in the “immunity protein,” “protease,” and “transfer/carrier protein” subcategories, respectively (Figure 4(b)).
3.5. Differentially Excreted Urinary Proteins Are Associated with Pathogenic Status
One hundred ninety-six tentative biomarker candidates were differentially expressed, based on the iTRAQ data, and they were characterized biologically according to “biological process” and “molecular function.” Moreover, in a detailed association study of diabetic nephropathy and differentially excreted proteins using references and databases, we prioritized 10 candidates, of the 196 differentially excreted proteins (Figure 3), that were associated with pathogenic status, such as glomerular and tubular dysfunction and other types of diseases. Accordingly, these proteins were classified into categories of pathogenesis in Table 2.
Table 2.
Selected 10 differentially excreted proteins related to pathogenic status in microalbumiuric versus normoalbuminuric urines.
| Pathogenic status | N | Number of unique peptidesa | Accession numberb | Gene namec | MA : NA expression | ||
|---|---|---|---|---|---|---|---|
| iTRAQd | 2-DEe | WBf | |||||
| Glomerular dysfunction | 1 | 15 | spt∣P02787 | TF | 1.86 | — | 4.66 ± 1.41 |
| 2 | 47 | Spt∣P00450 | CP | 2.09 | — | 11.16 ± 0.38 | |
| 3 | 209 | spt∣P01009 | A1AT | 1.42 | — | 3.36 ± 0.03 | |
| 4 | 49 | spt∣P00738 | HP | 2.35 | — | 7.28 ± 5.52 | |
| 5 | 10 | trm∣Q9UMV3 | MASP2 | 0.29 | 0.10 ± 0.005 | — | |
| 6 | 235 | spt∣P98160 | HSPG | 0.68 | 0.28 ± 0.041 | — | |
|
| |||||||
| Tubular dysfunction | 7 | 9 | spt∣P02774 | GC, VDBP | 2.44 | — | 2.88 ± 0.11 |
| 8 | 414 | spt∣P02763 | ORM1, AGP1 | 2.04 | — | 1.82 ± 0.08 | |
|
| |||||||
| Other types of diseases | 9 | 9 | spt∣Q01469 | FABP | 0.29 | 0.27 ± 0.037 | — |
| 10 | 5 | trm∣O43653 | PSCA | 1.70 | — | — | |
aThe numbers of unique peptides and MS/MS spectrum observed by ProteinPilot software were determined only for those peptides with ≥95% confidence. bAccession numbers represent entries in the Human CDS database (human KBMS 5.0, 2005-03-02; a total of 187,748 entries provided by Applied Biosystems). cGene name from the Expasy database correspond to protein accession number bfrom the Human CDS database (human KBMS 5.0, 2005-03-02; a total of 187,748 entries provided by Applied Biosystems). d–fRatio of differentially excreted protein for iTRAQ, 2-DE and WB in microalbumiuric versus normoalbuminuric urines, respectively.
In the 3 biological replicates, transferrin (TF), ceruloplasmin precursor (CP), mannose-binding lectin-associated serine protease-2 precursor (MASP2), alpha-1-antitrypsin (A1AT), haptoglobin (HP), and basement membrane-specific heparin sulfate proteoglycan core protein (HSPG) were associated with glomerular dysfunction; except for MASP2 and HSPG, all were upregulated in microalbuminuric versus normoalbuminuric urinary proteomes (Table 2).
Moreover, several differentially excreted proteins that were related to tubular dysfunction, such as vitamin D-binding protein (VDBP) and alpha-1-acid glycoprotein 1 precursor (AGP1) were selected for further validation. VDBP and AGP1 were upregulated in microalbuminuria versus normoalbuminuria (Table 2).
In addition, FABP (fatty acid-binding protein) and PSCA (prostate stem cell antigen) correlate with other types of disease, and PSCA was selected for further validation. In this iTRAQ experiment, FABP was downregulated, whereas PSCA expression increased in the microalbuminuric versus normoalbuminuric urinary proteome (Table 2).
3.6. Identification of Differentially Excreted Proteins Using 2-D Gel Electrophoresis
Differential protein expression between microalbuminuric and normoalbuminuric urine was also measured using the 2-D gel electrophoresis in pooled NA4 and MA4 urine (Figure 1 and Table 1). In triplicate 2-DE analysis (Figures 5(a) and 5(b)), two proteins (regulator of telomere elongation helicase 1: RTEL1 and serum albumin: ALB) were upregulated, and 5 proteins (basement membrane-specific heparan sulfate proteoglycan core protein: HSPG, fatty acid-binding protein: FABP, mannose binding lectin-associated serine protease-2: MASP2, AMBP protein: AMBP, and Fibulin-5: FBLN5) were downregulated in microalbuminuric urine (Figures 5(a) and 5(b)).
Figure 5.
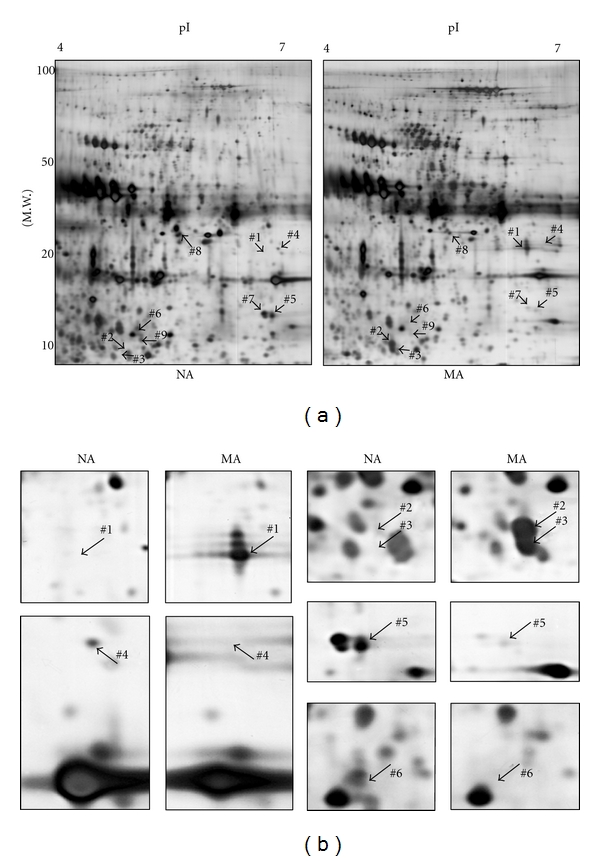
Differentially excreted proteins by 2-DE in microalbuminuria versus normoalbuminuria. (a) Representative whole 2-DE images of normoalbuminuric (NA) and microalbuminuric (MA) urine. Total protein (100 μg) samples were loaded onto IPG strips (pH 4–7, nonlinear) for IEF and separated in the second dimension on a 12% polyacrylamide gel. The horizontal and vertical axes represent pI and molecular weight, respectively. The arrowed numbers denote for differentially excreted proteins and correspond to the proteins in Table 3. (b) Magnified sections of differentially excreted proteins in the 2-DE gel. Some arrowed proteins in the 2-DE gel (Figure 5(a)) were magnified side by side to compare their relative expression.
Of the 7 proteins that were identified by 2-DE, 4 had the same pattern of differential excretion as in the iTRAQ experiment. Specifically, the spots that corresponded to serum albumin were upregulated by 2-DE (Figure 3(b), spots 1: 50.8 ± 15.3, 2: 17.5 ± 4.0, and 3: 14.2 ± 2.5) and iTRAQ (iTRAQ: 3.09). In contrast, HSPG (spot 4: 0.28 ± 0.041 and iTRAQ: 0.68), FABP (spot 5: 0.27 ± 0.037 and iTRAQ: 0.29), and MASP2 (spot 6: 0.10 ± 0.005 and iTRAQ: 0.29) were significantly downregulated in both techniques (Table 3). AMBP (spot 7) was downregulated by 2-DE (0.20 ± 0.002) but upregulated in the iTRAQ experiment (1.44). Two proteins were identified by 2-DE alone—regulator of telomere elongation helicase 1 (spot 8: 3.0 ± 0.5) was upregulated and fibulin-5 precursor (spot 9: 0.12 ± 0.007) was downregulated (Table 3).
Table 3.
Differentially expressed proteins by 2-DE in microalbuminuria versus normoalbuminuria.
| Gene namea | Accession numberb | Up-/down-regulated | Mol. Mass, Da (pI)c | Peptides matched | Total ion C.I.%d | Ma/Na (2-DE)f |
Ma/Na (iTRAQ)g |
|---|---|---|---|---|---|---|---|
| ALB | P02768 | Up | 71317.2 (5.92) | 2 | 100.00 | 50.8 ± 15.3 | 3.09 |
| ALB | P02768 | Up | 71317.2 (5.92) | 2 | 99.84 | 17.5 ± 4.0 | 3.09 |
| ALB | P02768 | Up | 71317.2 (5.92) | 2 | 100.00 | 14.2 ± 2.5 | 3.09 |
| HSPG | P98160 | Down | 468527.5 (6.06) | 2 | 100.00 | 0.28 ± 0.041 | 0.68 |
| FABP | Q01469 | Down | 15496.7 (6.6) | 1 | 97.76 | 0.27 ± 0.037 | 0.29 |
| MASP2 | Q9UMV3 | Down | 75684.6 (5.47) | 2 | 100.00 | 0.10 ± 0.005 | 0.29 |
| AMBP | P02760 | Down | 38974 (5.95) | 2 | 99.91 | 0.20 ± 0.002 | 1.44 |
| RTEL1 | Q9NZ71 | Up | 152278.2 (8.68) | 1 | 96.77 | 3.0 ± 0.5 | — |
| FBLN5 | Q9UBX5 | Down | 50146.7 (4.58) | 1 | 99.36 | 0.12 ± 0.007 | — |
a-bGene name from the Expasy database correspond to protein accession number. bAccession numbers represent entries in the Human CDS database. cMolecular mass (mol. mass) is presented by Da, while isoelectric point stands for pI. dTotal ion score and total ion CI % for MALDI-TOF/TOF were calculated using GPS v3.5 in the MASCOT search program (v2.0). f-gRatio of differentially excreted protein for 2-DE and iTRAQ in microalbumiuric versus normoalbuminuric urines, respectively. Data are expressed as the mean ± SD.
3.7. Validation of Differentially Expressed Proteins from iTRAQ by Western Blot
To validate the differentially excreted proteins from the iTRAQ results, 6 proteins (TF, CP, A1AT, VDBP, AGP1, and HP) that were associated with pathogenic status were subjected to Western blot. The Western blot results were consistent with the iTRAQ findings (Figure 6 and Table 2): TF (4.66 ± 1.41 and P < 0.0005), CP (11.16 ± 0.38 and P < 0.01), A1AT (3.36 ± 0.03 and P < 0.005), VDBP (2.88 ± 0.11 and P < 0.05), AGP1 (1.82 ± 0.08 and P < 0.05), and HP (7.28 ± 5.52 and P < 0.05) were upregulated in microalbumiuric versus normoalbuminuric urine.
3.8. MRM Validation for 7 Selected Biomarker Candidates
To verify the 7 biomarker candidates (TF, CP, A1AT, HP, VDBP, AGP1, and PSCA), MRM was performed using 9 individual normoalbuminuric and 14 microalbuminuric samples (Figure 1 and Table 1). The peak area for each Q1/Q3 transition (Table 4) for the candidates was first normalized to the peak area of beta-galactosidase that was spiked with 50 fmol as the internal standard and compared between microalbuminuric versus normoalbuminuric samples.
Table 4.
Parameters of MRM Experiment for seven candidate proteins.
| Protein name | Q1a | Q3b | Sequencec | Fragmentd | Chargee | CEf |
|---|---|---|---|---|---|---|
| Transferrin | 482.8 | 682.4 | APNHAVVTR | y6 | 2+ | 26 |
| 315.2 | 558.3 | AVGNLR | y5 | 2+ | 19 | |
| 315.2 | 459.3 | AVGNLR | y4 | 2+ | 19 | |
| Ceruloplasmin | 686.4 | 1080.0 | GAYPLSIEPIGVR | y10 | 2+ | 35 |
| 686.39 | 870.5 | GAYPLSIEPIGVR | y8 | 2+ | 35 | |
| Alpha-1-antitrypsin | 555.81 | 997.5 | LSITGTYDLK | y9 | 2+ | 29 |
| 555.81 | 797.4 | LSITGTYDLK | y7 | 2+ | 29 | |
| 393.2 | 587.3 | VVNPTQK | y5 | 2+ | 22 | |
| 393.2 | 473.3 | VVNPTQK | y5 | 2+ | 22 | |
| Haptoglobin precursor | 729.8 | 1084.5 | NLFLNHSENATAK | y10 | 2+ | 37 |
| 352.2 | 517.3 | VSVNER | y4 | 2+ | 20 | |
| Vitamin D-binding protein | 400.2 | 700.4 | VLEPTLK | y6 | 2+ | 26 |
| 400.2 | 587.3 | VLEPTLK | y5 | 2+ | 26 | |
| Alpha-1-acid glycoprotein 1 | 556.8 | 811.4 | SDVVYTDWK | y6 | 2+ | 29 |
| 580.8 | 974.5 | WFYIASAFR | y8 | 2+ | 31 | |
| 580.8 | 827.4 | WFYIASAFR | y7 | 2+ | 31 | |
| Prostate stem cell antigen | 501.0 | 830.5 | AVGLLTVISK | y8 | 2+ | 30 |
| 501.0 | 660.4 | AVGLLTVISK | y6 | 2+ | 30 |
a-bQ1 and Q3 (m/z) represent the Q1 and Q3 transitions for proteotypic peptide, respectively. cSequence represents the sequence of proteotypic peptide for target protein. dFragment type indicates the ion type of the Q3 transition. eCharge represents the charge state of precursor ion. fCE represents collision energy.
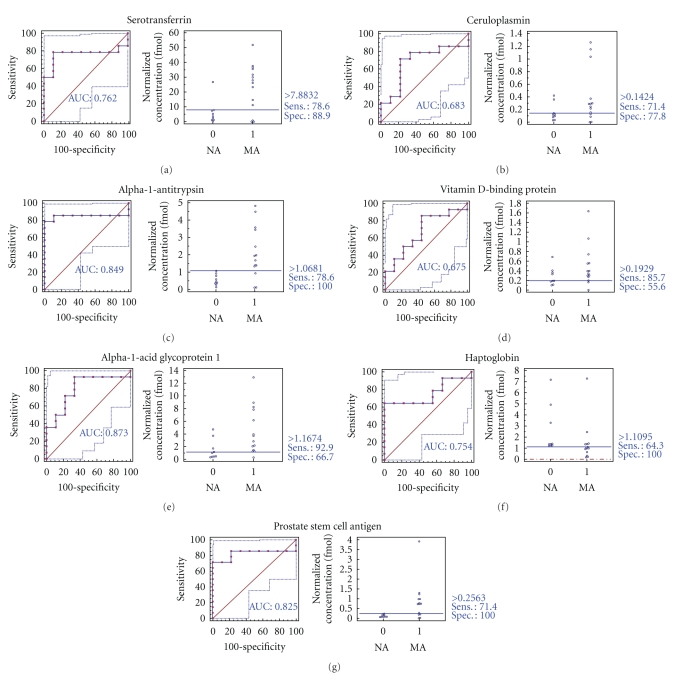
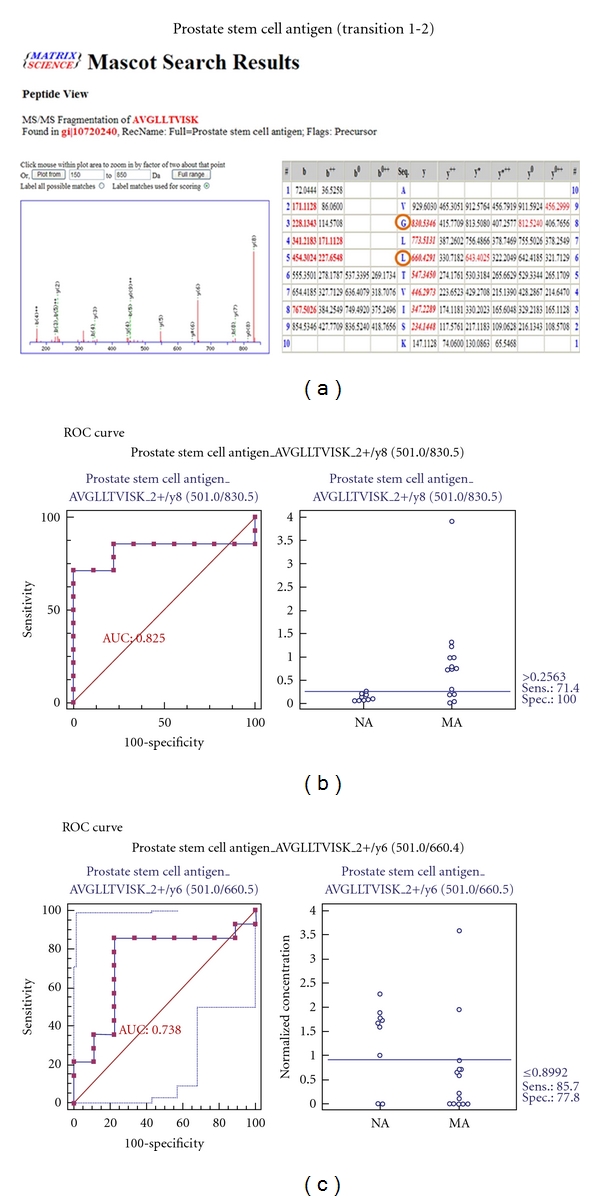
MRM validation was assessed by interactive plots and ROC curves, represented by the peak area of each Q1/Q3 transition. Figure 7 shows the interactive plots and ROC curves for TF, CP, A1AT, VDBP, AGP1, HP, and PSCA with regard to sensitivity, specificity, and relative concentrations versus beta-galactosidase. In the ROC curves, TF, A1AT, AGP1, HP, and PSCA had excellent area under the curve (AUC) values (0.762, 0.849, 0.873, 0.754, and 0.825, resp.), as did CP and VDBP, to a lesser extent (0.683 and 0.675, resp.) (Figure 7). Particularly, the merged ROC curve combining 3 biomarker candidates (alpha-1-antitrypsin, alpha-1-acid glycoprotein 1, and prostate stem cell antigen) resulted in the improved AUC value of 0.921, which is greater than those of the individual proteins (0.849, 0.873, and 0.825 for alpha-1-antitrypsin, alpha-1-acid glycoprotein 1, and prostate stem cell antigen, resp.) (Figure 8).
Figure 7.
ROC curves and interactive plots for MRM validation in normoalbuminuric versus microalbuminuric urine. Seven biomarker candidates (TF, CP, A1AT, VDBP, AGP1, HP, and PSCA) were validated by MRM, in which 9 normoalbuminuric and 14 microalbuminuric urine samples were used. (a)–(g) Interactive plots and ROC curves for TF, CP, A1AT, VDBP, AGP1, HP, and PSCA. In the ROC curves, the solid lines represent the corresponding score in sensitivity (x-axis) and 100-specificity (y-axis). In the interactive plots, the y-axis indicates the normalized concentration of the target protein against the spiked internal standard (50 fmol of beta-galactosidase peptide). Sens. and Spec. represent the sensitivity and specificity for the target proteins, respectively. The AUC values are shown inside the ROC curves.
Figure 8.

ROC curves for three candidate biomarkers and the 3-marker panel. MRM validation was performed for (a) alpha-1-antitrypsin, (b) alpha-1-acid glycoprotein 1, (c) prostate stem cell antigen, and (d) their combination, generating AUC values of 0.849, 0.873, and 0.825, respectively, whereas the combination resulted in a merged AUC of 0.921.
In the interactive plots, TF, CP, A1AT, VDBP, AGP1, and PSCA were upregulated in microalbuminuric versus normoalbuminuric urine, whereas HP was down-regulated. TF, CP, A1AT, VDBP, AGP1, and PSCA had the same excretion patterns by iTRAQ and western blot; conversely, HP had the opposite excretion pattern.
4. Discussion
4.1. Differentially Excreted Proteomes between Microalbuminuria and Normoalbuminuria
To identify and quantify proteins that were associated with diabetic nephropathy in microalbuminuric and normoalbuminuric urine, we used relative quantitative proteomic techniques, such as iTRAQ, 2-DE, Western blot, and MRM. In our iTRAQ experiment, 710 urinary proteins were identified at a >95% confidence level, of which 196 were differentially excreted by >1.25 or <0.80—99 and 97 proteins were up- and down-regulated, respectively (Appendix A).
Recently, the Urinary Protein Biomarker (UPB) database was constructed and published, in which 205 publications were curated manually [29]. Using this database, we can easily determine whether a biomarker candidate has been identified by another group for the same disease and evaluate its disease specificity. Thirty-six of the 196 quantified proteins from our iTRAQ experiment were registered in the UPB database; the remaining 160 proteins were not listed. Subsequently, 196 differentially excreted proteins yielded 10 preliminary biomarker candidates for further validation.
The “molecular function” subcategories accounted for 196 differentially excreted proteins, of which “immunity” represented 25 of the quantitated proteins—the largest component (Figure 3). This proportion reflects the increased inflammatory reactions and higher vascular lesion counts in kidneys during the development of diabetic nephropathy. Through detailed association searches between diabetic nephropathy and the 196 differentially excreted proteins using relevant databases and references, we identified and classified several biomarker candidates that were associated with pathogenic status, such as glomerular and tubular dysfunction and other types of disease (Table 2).
Consequently, 10 proteins were selected for preliminary validation studies such as 2-DE, Western blot, and MRM. For example, 3 proteins (HSPG, FABP, and MASP2) that were identified by 2-DE had the same pattern of differential excretion in the 2-DE and iTRAQ experiments (Table 2). Six differentially excreted proteins (TF, CP, A1AT, VDBP, AGP1, and HP) were validated by Western blot, for which the patterns of excretion were consistent with the iTRAQ results (Table 2).
Recently, an optimized quantitative proteomic strategy in urinary proteomic analysis was proposed for urine biomarker discovery using a small set of samples [21]. According to this report, the initial amount of proteins that is analyzed and the precipitation method (methanol precipitation) of the urine proteins are critical. Notably, our preparation methods for urinary proteomes approximated this optimized protocol, although we used acetone precipitation instead of methanol precipitation.
Nevertheless, an advantage of our study was that we used a large collection of urine samples from 86 diabetic patients to perform 3 iTRAQ experiments, including 3 biological replicates and 2 technical replicates, resulting in more reliable statistical significance.
4.2. Differentially Excreted Proteome and Glomerular Dysfunction
Glomerular dysfunction is caused by GBM thickening and mesangial expansion due to ECM accumulation [2], and several proteins, such as TF, CP, MASP2, A1AT, HP, and HSPG, were associated with glomerular dysfunction.
Transferrin-to-creatinine and ceruloplasmin-to-creatinine ratios are known to reflect changes in renal hemodynamics, and these ratios are significantly higher microalbuminuric patient than normoalbuminuric patients [30]. This result is caused by elevated intraglomerular hydraulic pressure, which leads to the development of diabetic glomerulosclerosis [30–32]. Moreover, TF and CP were listed in the UPB database, showing upregulation. TF is associated with diabetic nephropathy, normoalbuminuric type 2 diabetes, kidney calculi, and ureteropelvic junction obstruction, whereas CP is linked to diabetic nephropathy and normoalbuminuric type 2 diabetes. In our iTRAQ and 2-DE, TF and CP urinary proteins were commonly upregulated in the comparison of microalbuminuric and normoalbuminuric urinary proteome (Table 2).
MASP2 is a serum protease that activates the complement cascade, which regulates the maintenance of glomerular permeability and the pathogenesis of focal segmental glomerulosclerosis [33]. MASP2 was not listed in the UPB database, and in this iTRAQ and 2-DE, this protein was commonly downregulated in comparison of microalbuminuric and normoalbuminuric urinary proteome (Table 2).
A1AT is a serine protease inhibitor, which prevents neutrophil elastase by degrading ECM proteins, which maintains vascular elasticity and glomerular integrity [13, 34]. In a previous study, A1AT excretion was elevated in microalbuminuria, which can cause matrix molecules to accumulate [35]. A1AT was also listed in the UPB database, showing upregulation; it is associated with diabetic nephropathy, severe acute pancreatitis, kidney calculi, nephrotic syndrome, and ureteropelvic junction obstruction. In our iTRAQ and Western blot, A1AT was also upregulated in the comparison of microalbuminuric and normoalbuminuric urinary proteome (Table 2).
Haptoglobin (HP) is an acute phase protein that binds to free hemoglobin (Hb) with the highest affinity. Formation of the Hb-HP complex prevents the loss of renal iron and oxidative damage that are driven by free Hb. Specifically, HP mediates complement-dependent podocyte damage [36]. Thus, complement activation results in the release of proteases, oxidants, and growth factors, damaging the functional integrity of the GBM. HP, which was downregulated and is associated with diabetic nephropathy and type 2 diabetes mellitus, appeared in the UPB database. However, in our iTRAQ and Western blot, HP was commonly upregulated in the comparison of microalbuminuric and normoalbuminuric urinary proteome (Table 2).
HSPG is present in the basement membrane of every vascularized organ, including the GBM. The highly negatively charged side chains of HSPG are important determinants for the charge-selective permeability of the GBM [37]. Under hyperglycemic conditions, the loss of HSPG from the GBM alters the charge-selective properties of the glomerular capillary, causing increased filtration of negatively charged albumin [37, 38]. HSPG is not registered in the UPB database, and in our iTRAQ and 2-DE, HSPG was commonly downregulated in the comparison of microalbuminuric and normoalbuminuric urinary proteome (Table 2).
4.3. Differentially Excreted Proteome and Tubular Dysfunction and Other Types of Diseases
Low-molecular-weight proteins, such as VDBP and AGP1, are associated with kidney tubular dysfunction and were commonly upregulated in the iTRAQ and Western blot (Table 2). Unlike high-molecular-weight proteins, they are filtered in the glomerulus on the basis of charge selectivity and pore size of the GBM and are reabsorbed into proximal renal tubules under normal conditions [38]. If reabsorption is impaired, however, these proteins can be overexcreted into urine.
VDBP is a multifunctional serum glycoprotein and is an important mediator in immunopathogenesis because it is associated with immunoglobulin receptors on the surfaces of B- and T-lymphocytes [12]. Moreover, VDBP binds to circulating vitamin D metabolites with high affinity [39], and VDBP-bound 25-hydroxyvitamin D3 crosses the GBM and is reabsorbed by proximal tubular cells in a megalin-dependent manner, suggesting that it controls renal uptake and the activation of metabolites [4, 40]. VDBP, also listed in the UPB database, was upregulated and is associated with diabetic nephropathy and Dents disease. In our iTRAQ and Western blot, VDBP was commonly upregulated in the comparison of microalbuminuric and normoalbuminuric urinary proteome (Table 2).
AGP1 is synthesized in response to systemic tissue injury, inflammation, and infection, like most other acute phase proteins [7, 41]. Further, increased levels of AGP1 reflect elevated levels of cytokines, such as interleukin-1 (IL-1), IL-6, and tumor necrosis factor alpha (TNF-α), which are associated with type 2 diabetes [7]. A study has demonstrated that AGP1 is an indicator of tubular disorder in multiple myeloma [42], and another has shown that serum and urinary AGP1 levels are elevated in type 2 diabetic patients with kidney disorders [5, 7]. AGP1 was listed in the UPB database, showing upregulation, and is associated with diabetic nephropathy, diabetic kidney disorder, preeclampsia, and acute appendicitis. In our iTRAQ and Western blot, AGP1 was also commonly upregulated in the comparison of microalbuminuric and normoalbuminuric urinary proteome (Table 2).
FABP (fatty acid-binding protein: FABP) correlated with other types of diseases [43] and was also chosen for further validation. FABP was not listed in the UPB database, and in this iTRAQ and 2-DE, FABP was commonly downregulated in the comparison of microalbuminuric and normoalbuminuric urinary proteome (Table 2).
PSCA is highly expressed in the prostate and, to a lesser extent, in the bladder, placenta, colon, kidney, and stomach. Moreover, it is upregulated in prostate cancer and is detected in cancers of the bladder and pancreas [44]. PSCA was not listed in the UPB database but was upregulated in the microalbuminuric versus normoalbuminuric urinary proteome in our iTRAQ experiment (Table 2). No relationship between prostate stem cell antigen and diabetic nephropathy has been reported.
4.4. Validation of Differentially Excreted Proteins Using MRM
For the MRM experiments, we used a bacterial beta galactosidase peptide as the internal standard for relative quatitation [28]. Seven preliminary biomarker candidates (TF, CP, A1AT, VDBP, AGP1, HP, and PSCA) were confirmed in 9 normoalbuminuric and 14 microalbuminuric urine samples by MRM (Figure 7).
In the interactive plots, TF, CP, A1AT, VDBP, AGP1, and PSCA were preferentially excreted in microalbuminuria versus normoalbuminuria, whereas HP was downregulated. TF, CP, A1AT, VDBP, and AGP1 had the same pattern of excretion in the iTRAQ and western analysis, and HP had the opposite pattern between the MRM and Western analysis. HP consists of α-chain (amino acid sequence: 19–160) and β-chain (aminoacid sequence: 162–406), which are connected by disulfide bridges. In the MRM experiment, the transition (amino acid sequence: 203–215) in the β-chains was used for the relative quantitation of HP. In contrast, portions of both the α-chain and β-chain were used in the iTRAQ quantitation (sequence coverage: 31.0%), and an antibody that targeted a sequence in the α-chain was used for the Western blot analysis. It is conceivable that these disparate targets resulted in contradictory patterns between iTRAQ, Western blot, and MRM. Regardless of the methods or targets, reproducible patterns must be obtained with each method.
Furthermore, we performed a multiplex assay to improve AUC values with 3 biomarker candidates (alpha-1-antitrypsin, alpha-1-acid glycoprotein 1, and prostate stem cell antigen), obtaining a merged AUC value of 0.921, which is greater than those of the individual proteins (0.849, 0.873, and 0.825 for alpha-1-antitrypsin, alpha-1-acid glycoprotein 1, and prostate stem cell antigen, resp.) (Figure 8).
Although our results require further validation in a larger collection of urine samples that contains various control samples, it appears that A1AT, AGP1, and PSCA are excellent biomarker candidates, with AUC values > 0.8; combining the candidates improved the AUC value of 0.921. Accordingly, the other differentially expressed proteins from our iTRAQ experiment in Appendix A are potential candidates for further validation in obtaining DN biomarkers.
5. Conclusions
Microalbuminuria is used as a noninvasive index for the detection of diabetic renal disease. Yet, more specific and accurate biomarkers for DN are required, particularly in type 2 diabetic patients, due to several reasons, including nonspecific detection in nondiabetic renal disease, cardiovascular disease, inflammation, and hypertension. In our iTRAQ experiments, 710 urinary proteins were identified at a >95% confidence level, of which 196 were differentially excreted by >1.25 or <0.80—99 and 97 proteins were up- and down-regulated, respectively (Appendix A).
We prioritized 196 proteins to select preliminary biomarker candidates by characterizing them with regard to “biological process” and “molecular function” and associating them with pathogenesis. Consequently, 10 proteins were selected. To confirm and validate these candidates, 2-DE, Western blot, and MRM were performed. Based on the MRM results, A1AT, AGP1, and PSCA, which had AUC values > 0.8, are good biomarker candidates, and we improved the AUC value to 0.921 on combining the 3 proteins.
Further validation studies on other differentially excreted proteins might contribute to a greater understanding of the mechanism of renal dysfunction and its association with the pathogenesis of DN, facilitating the development of better biomarkers for DN.
Authors' Contribution
J. Jin and Y. H. Ku contributed equally to this study.
Acknowledgments
This paper was supported by the 21C Frontier Functional Proteomics Project of the Korean Ministry of Science and Technology (Grant no. FPR 08-A2-110) and a Grant (no. 10035353) from the Seoul R&BD Program.
Appendices
A. Differentially Excreted Urinary Proteome in Microalbumiuric versus Normoalbuminuric Urine
For more details, see Table 5.
Table 5.
Differentially excreted urinary proteome in microalbumiuric versus normoalbuminuric urine.
| N | Unique peptidesa | Accession numberb | Protein name | Ratioc MA : NA | Pvald MA : NA | EFe MA : NA |
|---|---|---|---|---|---|---|
| 1 | 651 | spt∣P02768 | Serum albumin | 3.09 | 0.00 | 1.04 |
| 2 | 337 | gb∣AAF01333.1 | Serum albumin | 0.36 | 0.00 | 1.08 |
| 3 | 669 | trm∣Q8N4N0 | Alpha-2-glycoprotein 1 | 1.48 | 0.00 | 1.02 |
| 4 | 639 | rf∣NP_003352.1 | uromodulin | 0.72 | 0.00 | 1.04 |
| 5 | 269 | emb∣CAA42438.1 | Zn-alpha2-glycoprotein | 1.80 | 0.00 | 1.06 |
| 6 | 235 | spt∣P98160 | HSPG | 0.68 | 0.00 | 1.04 |
| 7 | 209 | spt∣P01009 | Alpha-1-antitrypsin | 1.42 | 0.00 | 1.04 |
| 8 | 414 | spt∣P02763 | Alpha-1-acid glycoprotein 1 | 2.04 | 0.00 | 1.03 |
| 9 | 265 | spt∣P02788 | Serotransferrin | 2.46 | 0.00 | 1.10 |
| 10 | 46 | spt∣P02760 | AMBP protein | 1.44 | 0.00 | 1.12 |
| 11 | 300 | spt∣P07911 | Uromodulin | 0.24 | 0.00 | 1.08 |
| 12 | 106 | prf∣765044A | Ig G1 H Nie | 0.61 | 0.00 | 1.15 |
| 13 | 223 | dbj∣BAC85395.1 | Unnamed protein product | 1.37 | 0.00 | 1.10 |
| 14 | 217 | emb∣CAA29229.1 | Alpha-1-acid glycoprotein 1 | 2.29 | 0.00 | 1.11 |
| 15 | 107 | trm∣Q5VU27 | Heparan sulfate proteoglycan 2 | 2.00 | 0.00 | 1.18 |
| 16 | 306 | spt∣P07998 | Ribonuclease pancreatic | 0.80 | 0.00 | 1.08 |
| 17 | 62 | spt∣P41222 | Prostaglandin-H2 D-isomerase | 1.40 | 0.00 | 1.13 |
| 18 | 47 | spt∣P00450 | Ceruloplasmin | 2.09 | 0.00 | 1.12 |
| 19 | 117 | prf∣763134A | Ig A1 Bur | 1.60 | 0.02 | 1.39 |
| 20 | 46 | cra∣hCP1909255 | Serine proteinase inhibitor | 1.52 | 0.00 | 1.07 |
| 21 | 90 | spt∣P10451 | Osteopontin | 0.57 | 0.00 | 1.43 |
| 22 | 9 | spt∣P04746 | Pancreatic alpha-amylase | 0.41 | 0.00 | 1.33 |
| 23 | 39 | spt∣P02749 | Beta-2-glycoprotein I | 1.37 | 0.00 | 1.07 |
| 24 | 50 | trm∣Q9UII8 | E-cadherin | 1.36 | 0.00 | 1.12 |
| 25 | 34 | rf∣NP_006112.2 | Keratin 1 | 0.60 | 0.00 | 1.16 |
| 26 | 88 | spt∣Q14624 | ITIH4 | 0.78 | 0.00 | 1.08 |
| 27 | 21 | trm∣Q6N025 | FN | 1.27 | 0.01 | 1.20 |
| 28 | 21 | trm∣Q8N175 | Keratin 10 | 0.67 | 0.00 | 1.27 |
| 29 | 34 | emb∣CAA48671.1 | Alpha1-antichymotrypsin | 1.64 | 0.00 | 1.17 |
| 30 | 50 | spt∣P00738 | Haptoglobin | 2.36 | 0.01 | 1.24 |
| 31 | 22 | gb∣AAA52014.1 | Cholesterol esterase | 0.46 | 0.00 | 1.10 |
| 32 | 63 | spt∣P05451 | Lithostathine 1 alpha | 1.54 | 0.00 | 1.05 |
| 33 | 31 | trm∣Q6PAU9 | Kininogen 1 | 0.75 | 0.00 | 1.18 |
| 34 | 20 | spt∣P04217 | Alpha-1B-glycoprotein | 1.86 | 0.00 | 1.31 |
| 35 | 34 | spt∣P05155 | Plasma protease C1 inhibitor | 0.75 | 0.00 | 1.12 |
| 36 | 14 | trm∣Q8N473 | Alpha 1 type I collagen | 0.72 | 0.00 | 1.14 |
| 37 | 139 | trm∣Q6IB74 | ORM2 protein | 1.48 | 0.00 | 1.23 |
| 38 | 22 | spt∣Q8WZ75 | Roundabout homolog 4 | 0.34 | 0.00 | 1.23 |
| 39 | 29 | spt∣P02791 | Hemopexin | 1.73 | 0.01 | 1.33 |
| 40 | 33 | trm∣Q6LBL5 | GM2 activator protein | 1.45 | 0.00 | 1.06 |
| 41 | 19 | pdb∣1HP7_A | A Chain A, uncleaved alpha-1-antitrypsin | 1.76 | 0.00 | 1.18 |
| 42 | 23 | spt∣P55290 | Cadherin-13 | 0.76 | 0.00 | 1.13 |
| 43 | 21 | trm∣Q8IZY7 | Poly-Ig receptor | 0.63 | 0.00 | 1.36 |
| 44 | 25 | spt∣P05154 | Plasma serine protease inhibitor | 0.76 | 0.00 | 1.12 |
| 45 | 10 | trm∣Q96CZ9 | Cadherin 11, type 2, isoform 1 preproprotein | 0.44 | 0.00 | 1.50 |
| 46 | 16 | gb∣AAR84237.2 | Truncated epidermal growth factor | 0.48 | 0.00 | 1.25 |
| 47 | 35 | spt∣P24855 | Deoxyribonuclease I | 0.50 | 0.00 | 1.12 |
| 48 | 17 | trm∣Q7Z645 | Collagen, type VI, alpha 1 | 0.51 | 0.00 | 1.17 |
| 49 | 15 | dbj∣BAA19556.1 | Immunoglobulin light chain V-J region | 1.69 | 0.01 | 1.38 |
| 50 | 33 | emb∣CAA23842.1 | Unnamed protein product | 1.43 | 0.00 | 1.05 |
| 51 | 32 | spt∣P08571 | CD14 | 2.36 | 0.00 | 1.62 |
| 52 | 26 | trm∣Q6GMX2 | Hypothetical protein | 0.59 | 0.01 | 1.24 |
| 53 | 111 | emb∣CAA29873.2 | Alpha-1-acid glycoprotein 2 | 2.25 | 0.00 | 1.18 |
| 54 | 7 | trm∣Q8WY99 | Cathepsin C | 1.58 | 0.00 | 1.17 |
| 55 | 11 | spt∣Q92820 | Gamma-glutamyl hydrolase | 0.54 | 0.01 | 1.33 |
| 56 | 13 | spt∣P15586 | N-acetylglucosamine-6-sulfatase | 1.30 | 0.02 | 1.23 |
| 57 | 10 | gb∣AAQ88523.1 | AQGV3103 | 0.79 | 0.05 | 1.26 |
| 58 | 8 | trm∣Q8N2F4 | Hypothetical protein PSEC0200 | 0.71 | 0.01 | 1.29 |
| 59 | 20 | trm∣Q6MZU6 | Hypothetical protein DKFZp686C15213 | 0.39 | 0.00 | 1.28 |
| 60 | 27 | trm∣Q6LDS3 | APS protein | 1.34 | 0.00 | 1.08 |
| 61 | 9 | pdb∣1L9X_D | Structure Of Gamma-Glutamyl Hydrolase | 0.69 | 0.00 | 1.12 |
| 62 | 15 | spt∣P07339 | Cathepsin D | 1.38 | 0.01 | 1.26 |
| 63 | 10 | spt∣P51884 | Lumican | 0.78 | 0.01 | 1.20 |
| 64 | 130 | dbj∣BAC85483.1 | Unnamed protein product | 0.73 | 0.00 | 1.14 |
| 65 | 9 | pdb∣1ATH_B | B Chain B, Antithrombin Iii | 1.29 | 0.00 | 1.17 |
| 66 | 15 | rf∣NP_001822.2 | Clusterin isoform 1 | 0.63 | 0.00 | 1.25 |
| 67 | 23 | trm∣Q5VW91 | Decay accelerating factor for complement | 1.26 | 0.00 | 1.09 |
| 68 | 7 | spt∣P54802 | Alpha-N-acetylglucosaminidase | 0.50 | 0.00 | 1.25 |
| 69 | 12 | spt∣Q16270 | IGFBP-7 | 0.79 | 0.00 | 1.14 |
| 70 | 8 | trm∣Q5VZE3 | Golgi phosphoprotein 2 | 0.38 | 0.02 | 1.46 |
| 71 | 10 | spt∣P05543 | Thyroxine-binding globulin | 1.27 | 0.00 | 1.11 |
| 72 | 9 | spt∣P02774 | Vitamin D-binding protein | 2.44 | 0.00 | 1.15 |
| 73 | 63 | rf∣NP_000573.1 | Secreted phosphoprotein 1 | 0.58 | 0.00 | 1.24 |
| 74 | 56 | spt∣P02671 | Fibrinogen alpha/alpha-E chain | 0.67 | 0.00 | 1.11 |
| 75 | 10 | trm∣Q9UBG3 | Tumor-related protein | 0.32 | 0.00 | 1.67 |
| 76 | 15 | trm∣O00391 | Quiescin Q6 | 0.77 | 0.03 | 1.25 |
| 77 | 36 | trm∣Q5VY30 | Retinol binding protein 4, plasma | 1.38 | 0.00 | 1.04 |
| 78 | 8 | rf∣NP_004675.2 | SPARC-like 1 | 0.55 | 0.03 | 1.70 |
| 79 | 9 | spt∣Q92692 | Herpesvirus entry mediator B | 0.50 | 0.00 | 1.31 |
| 80 | 39 | trm∣Q96FE7 | HGFL protein | 0.73 | 0.00 | 1.15 |
| 81 | 6 | spt∣P43652 | Afamin | 4.67 | 0.00 | 1.33 |
| 82 | 24 | pdb∣1QDD_A | Lithostathine | 1.73 | 0.00 | 1.20 |
| 83 | 24 | spt∣P10153 | Nonsecretory ribonuclease | 0.83 | 0.01 | 1.13 |
| 84 | 8 | spt∣P16278 | Beta-galactosidase | 1.50 | 0.00 | 1.20 |
| 85 | 7 | trm∣Q5VYK1 | Collagen, type XII, alpha 1 | 0.75 | 0.00 | 1.15 |
| 86 | 9 | emb∣CAA37914.1 | Precursor (AA-19 to 692) | 1.91 | 0.01 | 1.62 |
| 87 | 15 | trm∣Q7Z5L0 | Unnamed secretory protein | 0.56 | 0.00 | 1.31 |
| 88 | 11 | spt∣P08236 | Beta-glucuronidase | 1.33 | 0.00 | 1.12 |
| 89 | 13 | cra∣hCP51001.2 | superoxide dismutase 3 | 0.45 | 0.00 | 1.38 |
| 90 | 17 | pir∣S13195 | Ganglioside M2 activator protein | 1.33 | 0.00 | 1.18 |
| 91 | 12 | cra∣hCP1858145 | Protein C receptor, endothelial | 1.42 | 0.00 | 1.22 |
| 92 | 12 | trm∣Q6IAT8 | B2M protein | 1.48 | 0.00 | 1.08 |
| 93 | 7 | trm∣Q9Y5X6 | Glutamate carboxypeptidase | 1.47 | 0.00 | 1.04 |
| 94 | 13 | spt∣P06702 | Calgranulin B | 0.41 | 0.00 | 1.36 |
| 95 | 11 | emb∣CAB90482.1 | Human type XVIII collagen | 0.56 | 0.01 | 1.48 |
| 96 | 7 | trm∣O00533 | Neural cell adhesion molecule | 0.73 | 0.02 | 1.29 |
| 97 | 72 | spt∣P04745 | Salivary alpha-amylase | 1.25 | 0.00 | 1.12 |
| 98 | 40 | spt∣O75594 | Peptidoglycan recognition protein | 0.56 | 0.00 | 1.08 |
| 99 | 127 | emb∣CAA40946.1 | Immunoglobulin lambda light chain | 1.71 | 0.01 | 1.47 |
| 100 | 15 | trm∣Q9UJ36 | Transmembrane glycoprotein | 0.74 | 0.01 | 1.25 |
| 101 | 4 | gb∣AAH17802.1 | SPRR3 protein | 0.14 | 0.00 | 1.25 |
| 102 | 9 | spt∣Q01469 | Fatty acid-binding protein | 0.29 | 0.00 | 1.34 |
| 103 | 4 | trm∣Q6FGL5 | LCN2 protein | 1.36 | 0.01 | 1.33 |
| 104 | 10 | trm∣Q9UMV3 | MBL-associated serine protease 2 | 0.29 | 0.00 | 1.34 |
| 105 | 10 | gb∣AAH30653.1 | Cadherin 13, preproprotein | 2.91 | 0.00 | 1.76 |
| 106 | 6 | spt∣Q9H8L6 | Multimerin 2 | 0.69 | 0.02 | 1.34 |
| 107 | 33 | trm∣Q9UD19 | Intron-containing kallikrein | 0.73 | 0.02 | 1.30 |
| 108 | 4 | spt∣P07195 | L-lactate dehydrogenase B chain | 0.75 | 0.00 | 1.16 |
| 109 | 9 | spt∣P08185 | Corticosteroid-binding globulin | 3.22 | 0.00 | 1.79 |
| 110 | 14 | trm∣Q5UGI3 | Ubiquitin C splice variant | 1.37 | 0.01 | 1.24 |
| 111 | 6 | pdb∣1O1P_D | D Chain D, Deoxy Hemoglobin | 0.55 | 0.00 | 1.32 |
| 112 | 7 | spt∣P80723 | Brain acid soluble protein 1 | 2.24 | 0.00 | 1.46 |
| 113 | 7 | spt∣P19320 | Vascular cell adhesion protein 1 | 1.25 | 0.03 | 1.23 |
| 114 | 6 | spt∣P27797 | Calreticulin | 1.39 | 0.00 | 1.13 |
| 115 | 10 | spt∣Q01459 | Di-N-acetylchitobiase | 1.43 | 0.01 | 1.26 |
| 116 | 6 | trm∣Q6PN97 | Alpha 2 macroglobulin | 3.04 | 0.00 | 1.84 |
| 117 | 5 | gb∣AAV40827.1 | superoxide dismutase 3 | 0.48 | 0.00 | 1.15 |
| 118 | 3 | spt∣P08473 | Neprilysin | 2.26 | 0.00 | 1.51 |
| 119 | 61 | trm∣Q9Y5Y7 | LYVE-1 | 1.63 | 0.00 | 1.03 |
| 120 | 2 | spt∣P26038 | Moesin | 1.56 | 0.00 | 1.18 |
| 121 | 9 | trm∣Q6PIJ0 | FCGR3A protein | 0.77 | 0.00 | 1.06 |
| 122 | 7 | spt∣P14209 | T cell surface glycoprotein E2 | 2.02 | 0.02 | 1.61 |
| 123 | 6 | spt∣P02765 | Alpha-2-HS-glycoprotein | 1.69 | 0.00 | 1.20 |
| 124 | 215 | pir∣A23746 | Ig kappa chain V-III | 1.31 | 0.00 | 1.14 |
| 125 | 3 | trm∣Q9NT71 | Hypothetical protein DKFZp761A051 | 0.74 | 0.03 | 1.31 |
| 126 | 6 | trm∣Q9Y4W4 | Type XV collagen | 0.52 | 0.00 | 1.25 |
| 127 | 5 | cra∣hCP42501.1 | Complement component 1 | 0.74 | 0.00 | 1.20 |
| 128 | 11 | spt∣P09564 | T-cell antigen CD7 | 0.67 | 0.01 | 1.26 |
| 129 | 6 | dbj∣BAA86053.1 | Carboxypeptidase E | 0.79 | 0.02 | 1.20 |
| 130 | 6 | spt∣P15151 | Poliovirus receptor | 1.46 | 0.01 | 1.51 |
| 131 | 13 | trm∣Q8IUP2 | Protocadherin 1, isoform 1 | 0.49 | 0.02 | 1.75 |
| 132 | 3 | trm∣Q8NBK0 | Hypothetical protein | 1.31 | 0.01 | 1.19 |
| 133 | 5 | spt∣P22891 | Vitamin K-dependent protein Z | 0.76 | 0.01 | 1.21 |
| 134 | 6 | trm∣Q9UNF4 | Hyaluronic acid receptor | 1.50 | 0.01 | 1.29 |
| 135 | 11 | trm∣Q9HCU0 | Tumor endothelial marker 1 | 0.46 | 0.00 | 1.36 |
| 136 | 8 | spt∣P35527 | Keratin, type I cytoskeletal 9 | 0.55 | 0.00 | 1.29 |
| 137 | 3 | spt∣P55285 | Cadherin-6 | 0.41 | 0.00 | 1.39 |
| 138 | 3 | trm∣Q9BYH7 | Scavenger receptor with C-type lectin type I | 1.39 | 0.01 | 1.23 |
| 139 | 2 | trm∣Q13942 | Calmodulin | 2.64 | 0.00 | 1.39 |
| 140 | 8 | spt∣P04004 | Vitronectin | 1.87 | 0.00 | 1.42 |
| 141 | 11 | trm∣Q86Z23 | Hypothetical protein | 2.11 | 0.01 | 1.49 |
| 142 | 140 | trm∣Q9NWE3 | Hypothetical protein FLJ10084 | 1.55 | 0.00 | 1.04 |
| 143 | 99 | trm∣Q9NWE3 | Hypothetical protein FLJ10084 | 1.53 | 0.00 | 1.06 |
| 144 | 11 | spt∣P05109 | Calgranulin A | 0.42 | 0.00 | 1.34 |
| 145 | 58 | trm∣Q9NWE3 | Hypothetical protein FLJ10084 | 1.50 | 0.00 | 1.08 |
| 146 | 3 | trm∣Q9BYH7 | Scavenger receptor with C-type lectin type I | 1.65 | 0.00 | 1.24 |
| 147 | 4 | gb∣AAA52018.1 | Chromogranin A | 0.52 | 0.00 | 1.26 |
| 148 | 4 | emb∣CAI20248.1 | PPGB | 1.51 | 0.00 | 1.24 |
| 149 | 92 | pir∣S12443 | Ig lambda chain (Ke+O−)−human | 1.35 | 0.03 | 1.24 |
| 150 | 7 | trm∣Q5TEQ5 | OTTHUMP00000044363 | 0.29 | 0.00 | 1.58 |
| 151 | 18 | trm∣Q6UX86 | GPPS559 | 2.08 | 0.01 | 1.60 |
| 152 | 2 | trm∣Q8TCZ2 | MIC2L1 | 0.80 | 0.01 | 1.16 |
| 153 | 5 | spt∣P61970 | Nuclear transport factor 2 | 0.78 | 0.01 | 1.18 |
| 154 | 284 | pdb∣1T04_C | Anti-ifn-gamma fab in C2 space group | 1.45 | 0.02 | 1.28 |
| 155 | 8 | spt∣P00790 | Pepsin A | 0.80 | 0.00 | 1.15 |
| 156 | 2 | cra∣hCP1778903.1 | CD7 antigen | 0.48 | 0.00 | 1.03 |
| 157 | 5 | trm∣O00480 | Butyrophilin, subfamily 2 | 0.68 | 0.00 | 1.12 |
| 158 | 5 | trm∣O43653 | Prostate stem cell A | 1.70 | 0.00 | 1.25 |
| 159 | 4 | trm∣Q9BX83 | Hemoglobin alpha 1 globin chain | 0.67 | 0.05 | 1.47 |
| 160 | 9 | spt∣P11684 | Uteroglobin | 3.16 | 0.00 | 1.86 |
| 161 | 7 | trm∣Q7LDY7 | Alpha-KG-E2 | 1.47 | 0.00 | 1.17 |
| 162 | 3 | trm∣Q9BYH7 | Scavenger receptor | 1.92 | 0.00 | 1.25 |
| 163 | 4 | trm∣Q6AZK5 | KRT13 protein | 0.56 | 0.02 | 1.58 |
| 164 | 5 | spt∣P09619 | PDGF-R-beta | 0.66 | 0.01 | 1.29 |
| 165 | 5 | pdb∣5TTR_H | Leu 55 Pro Transthyretin | 1.46 | 0.02 | 1.33 |
| 166 | 3 | rf∣NP_877418.1 | Mucin 1, transmembrane | 0.49 | 0.02 | 1.78 |
| 167 | 2 | trm∣Q5SWW9 | OTTHUMP00000060590 | 0.39 | 0.01 | 1.76 |
| 168 | 2 | rf∣NP_003217.2 | Trefoil factor 3 | 1.63 | 0.00 | 1.22 |
| 169 | 3 | spt∣Q99574 | Neuroserpin | 0.63 | 0.01 | 1.36 |
| 170 | 21 | trm∣Q9Y3U9 | Hypothetical protein DKFZp566C243 | 0.75 | 0.00 | 1.06 |
| 171 | 23 | gb∣AAB27607.1 | Prostaglandin D synthase | 1.20 | 0.00 | 1.10 |
| 172 | 4 | gb∣AAO11857.1 | Immunoglobulin | 1.38 | 0.00 | 1.14 |
| 173 | 2 | trm∣Q5VTA6 | Cubilin | 0.79 | 0.03 | 1.23 |
| 174 | 3 | trm∣Q5SY67 | OTTHUMP00000059857 | 0.69 | 0.02 | 1.33 |
| 175 | 54 | spt∣P15814 | Immunoglobulin lambda-like polypeptide 1 | 2.50 | 0.01 | 1.37 |
| 176 | 2 | spt∣P22352 | Plasma glutathione peroxidase | 0.70 | 0.00 | 1.13 |
| 177 | 7 | gb∣AAL68978.1 | Mutant beta globin | 0.32 | 0.00 | 1.77 |
| 178 | 6 | spt∣P35908 | KCytokeratin 2e | 0.50 | 0.03 | 1.74 |
| 179 | 284 | dbj∣BAB18261.1 | Anti-HBs antibody light chain | 3.19 | 0.00 | 1.53 |
| 180 | 3 | rf∣XP_370615.2 | Hypothetical protein | 0.53 | 0.03 | 1.72 |
| 181 | 164 | gb∣AAB50880.2 | Anitubulin IgG1 kappa VL chain | 1.64 | 0.00 | 1.30 |
| 182 | 170 | dbj∣BAC01692.1 | Immunoglobulin kappa light chain | 2.49 | 0.01 | 1.79 |
| 183 | 2 | trm∣Q7RTN9 | Type II keratin K6h | 0.43 | 0.01 | 1.52 |
| 184 | 3 | spt∣P21926 | Motility-related protein | 1.70 | 0.03 | 1.45 |
| 185 | 2 | spt∣Q13873 | Bone morphogenetic protein receptor | 0.61 | 0.01 | 1.08 |
| 186 | 4 | gb∣AAA62175.1 | Heat shock protein 27 | 0.53 | 0.00 | 1.38 |
| 187 | 15 | spt∣P02787 | transferrin | 1.86 | 0.00 | 1.25 |
| 188 | 2 | spt∣P07108 | Acyl-CoA-binding protein | 2.20 | 0.02 | 1.47 |
| 189 | 2 | spt∣Q9NZH0 | G protein-coupled receptor family C | 1.27 | 0.04 | 1.25 |
| 190 | 2 | trm∣Q96E46 | Fructose-1,6-bisphosphatase 1 | 0.44 | 0.00 | 1.01 |
| 191 | 44 | gb∣AAB53267.1 | Immunoglobulin V-region light chain | 1.40 | 0.03 | 1.30 |
| 192 | 8 | gb∣AAR32503.1 | Immunoglobulin heavy chain | 0.46 | 0.00 | 1.19 |
| 193 | 7 | rf∣NP_653247.1 | Immunoglobulin J chain | 0.37 | 0.01 | 1.88 |
| 194 | 29 | emb∣CAA12585.1 | Ig heavy chain variable region | 1.50 | 0.00 | 1.13 |
| 195 | 4 | gb∣AAD16731.1 | Immunoglobulin lambda light chain | 1.58 | 0.00 | 1.11 |
| 196 | 33 | trm∣Q6UXB8 | HGSC289 (OTTHUMP00000039678) | 1.27 | 0.04 | 1.22 |
aThe numbers of unique peptides and MS/MS spectrum observed by ProteinPilot software were determined only for those peptides with ≥95% confidence. bAccession numbers represent entries in the Human CDS database (human KBMS 5.0, 2005-03-02; a total of 187,748 entries provided by Applied Biosystems). c–eThe iTRAQ ratio, P value, and EF value in microalbumiuric versus normoalbuminuric urine, respectively.
B. Mascot Search and ROC Curves for Each Transition of MRM
To verify the MRM validation, we analyzed minimum of 2 transitions for each biomarker candidate protein.
Results from Mascot search and ROC curves for each transition are summarized in Figures 9, 10, 11, 12, 13, 14, 15, 16, 17, 18, and 19.
Figure 9.

Figure 10.
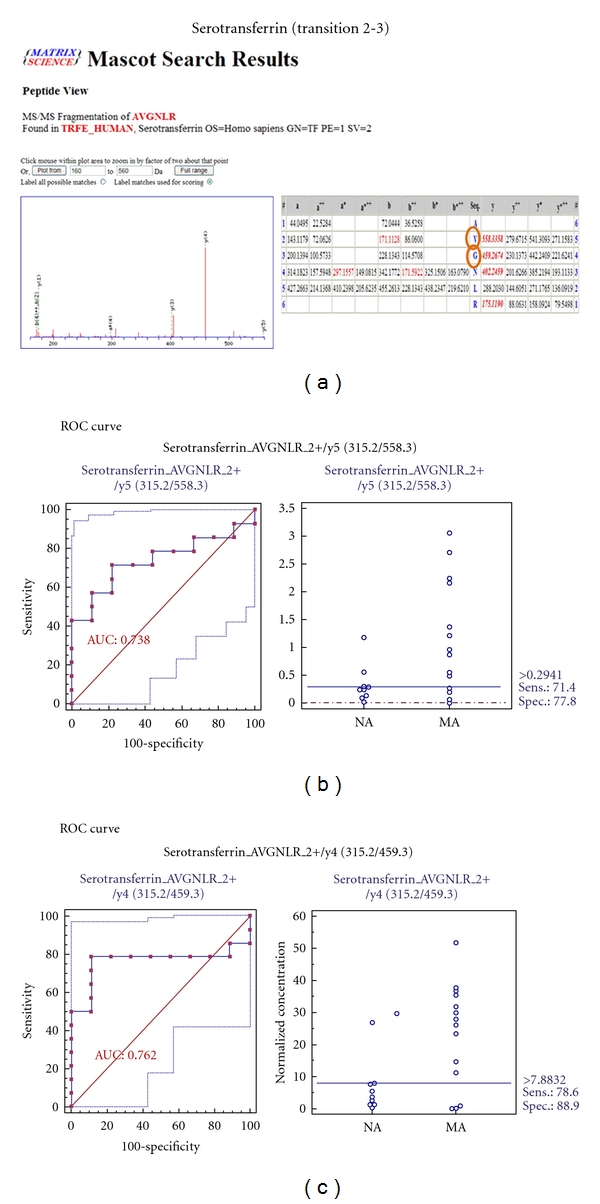
Figure 11.
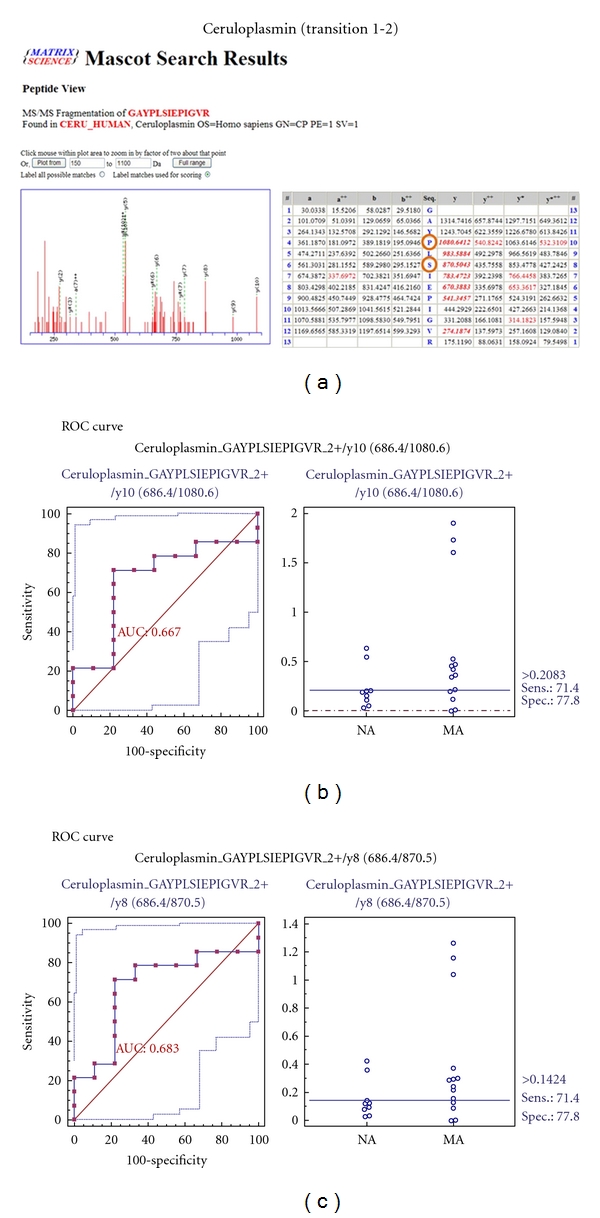
Figure 12.
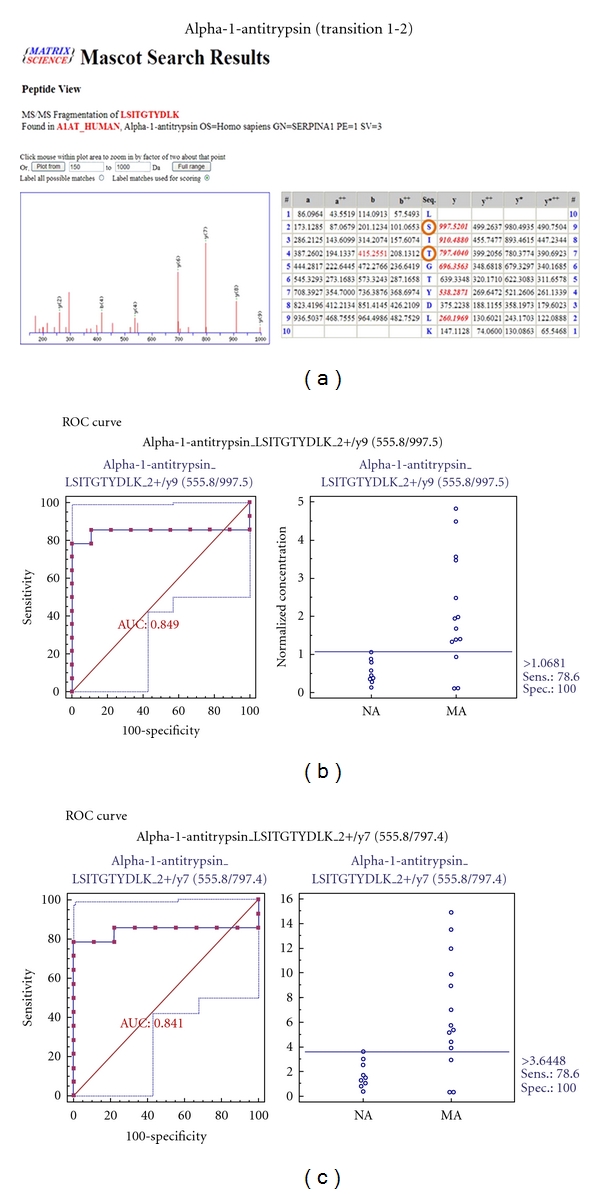
Figure 13.
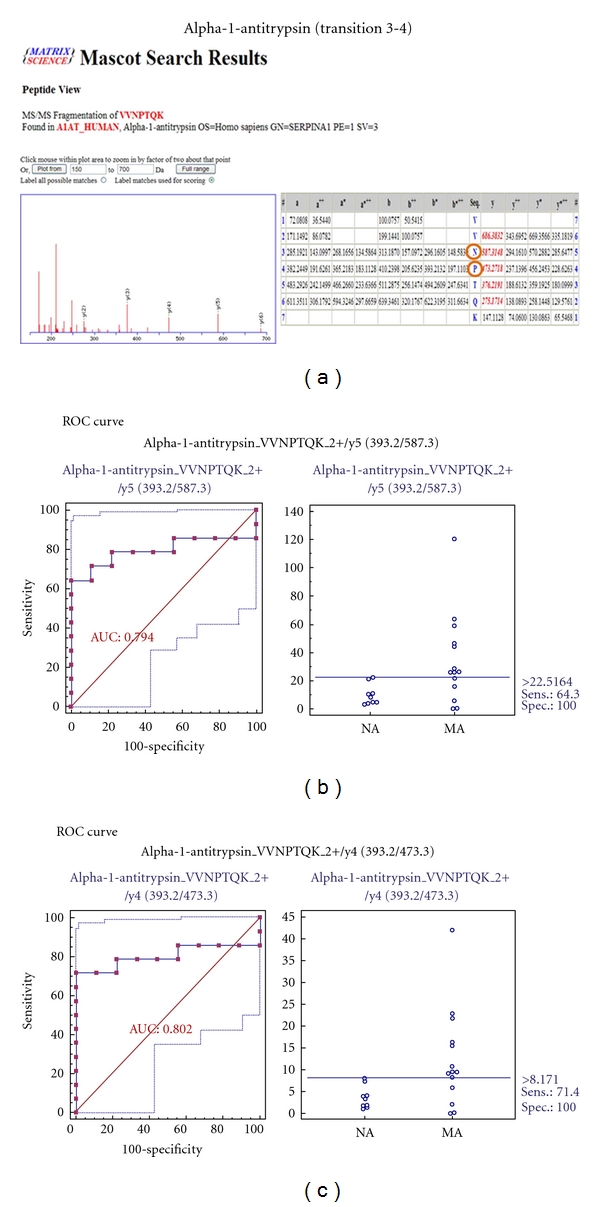
Figure 14.
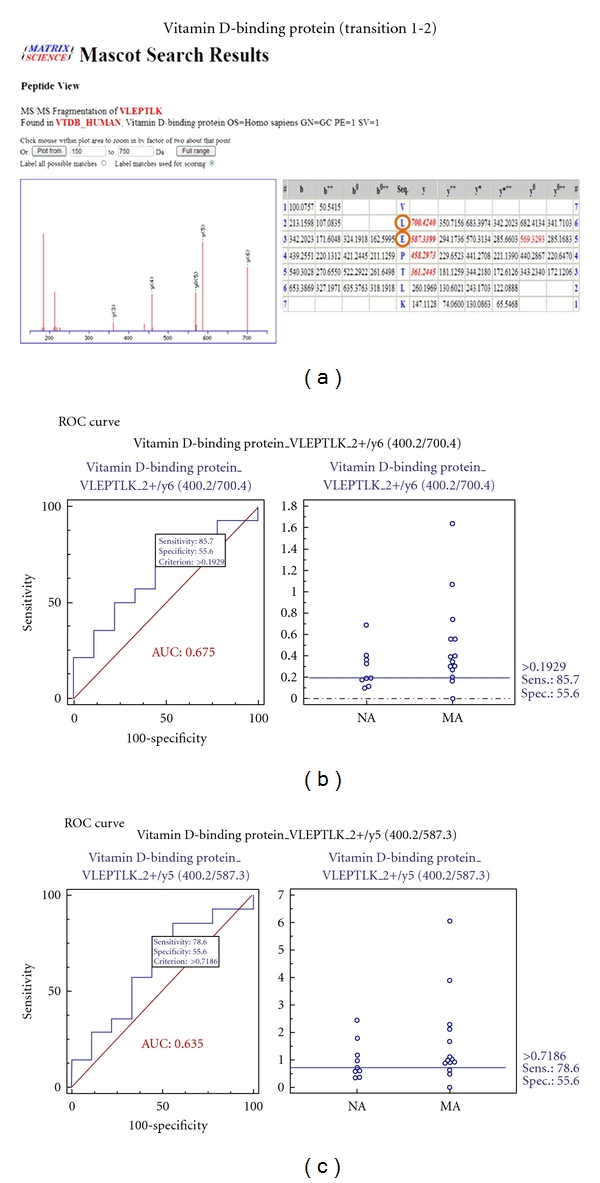
Figure 15.
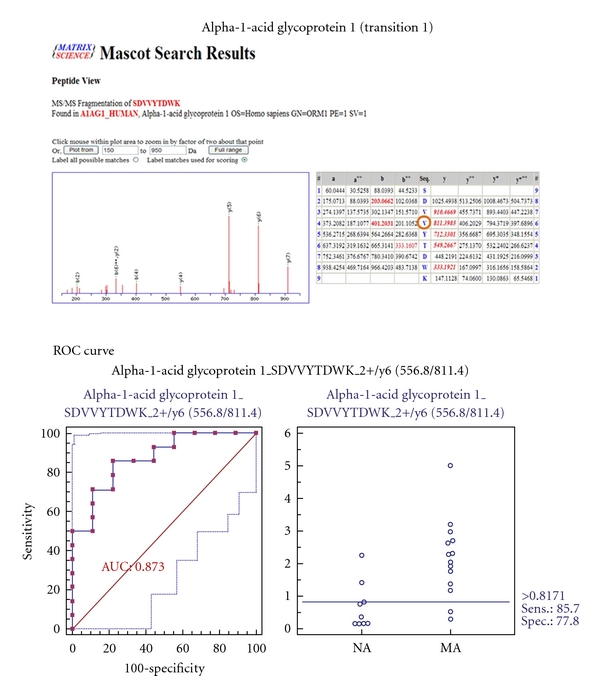
Figure 16.
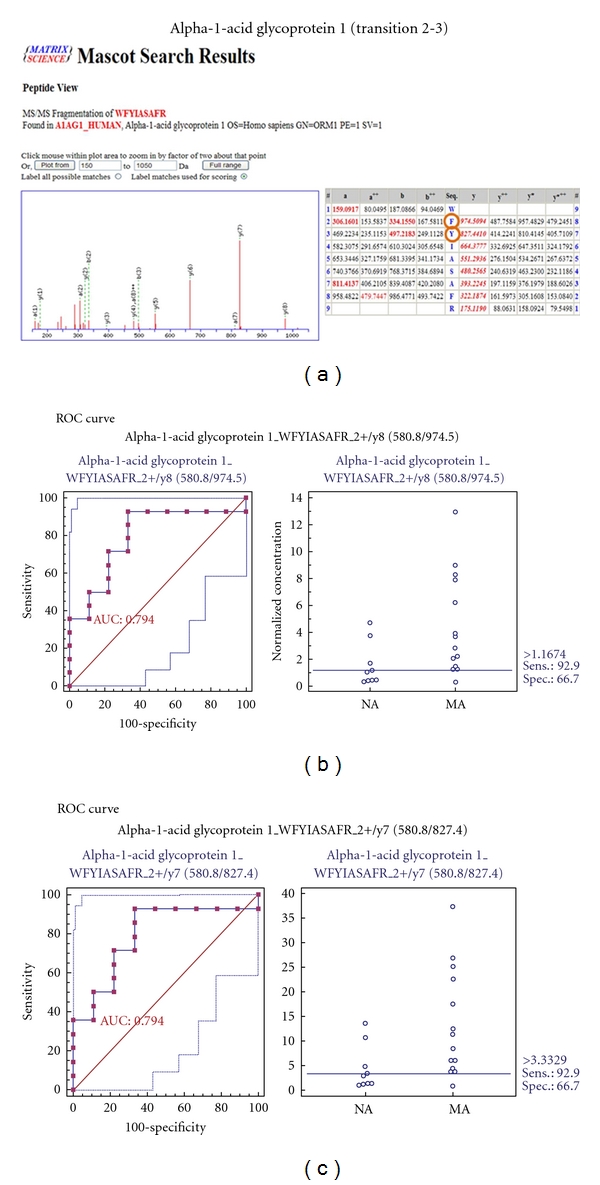
Figure 17.
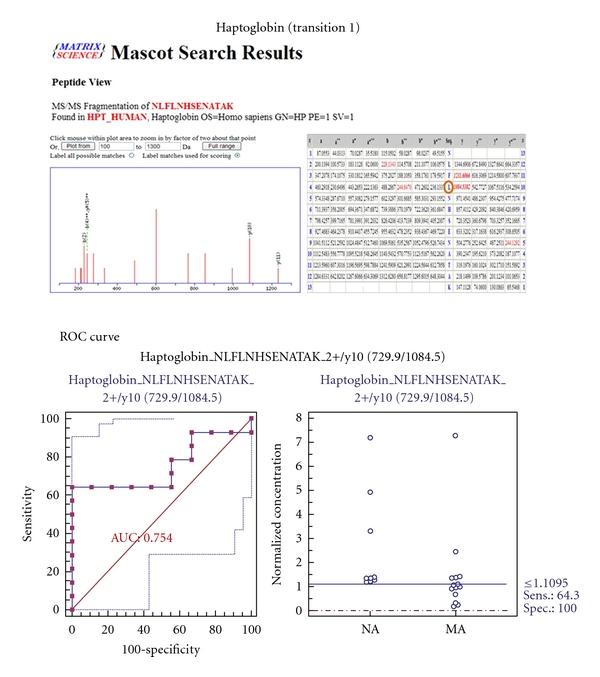
Figure 18.
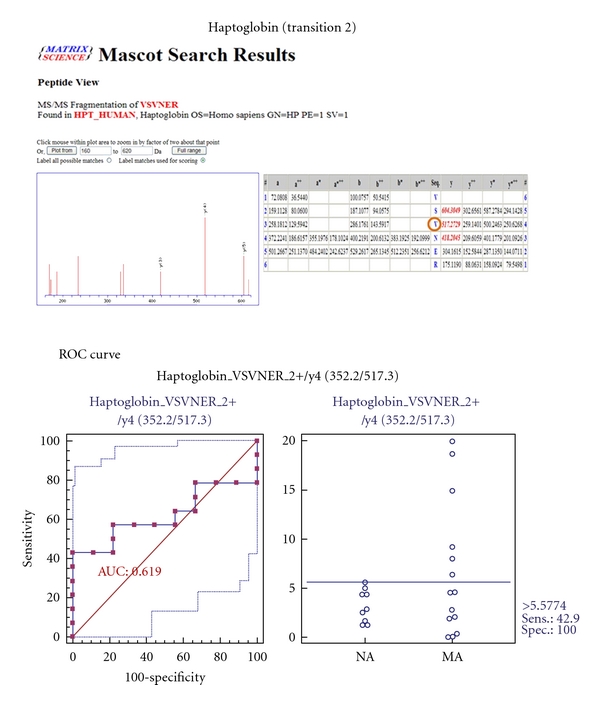
Figure 19.
References
- 1.Klein R, Klein BEK, Moss SE, Cruickshanks KJ. The wisconsin epidemiologic study of diabetic retinopathy: XVII. The 14- year incidence and progression of diabetic retinopathy and associated risk factors in type 1 diabetes. Ophthalmology. 1998;105(10):1801–1815. doi: 10.1016/S0161-6420(98)91020-X. [DOI] [PubMed] [Google Scholar]
- 2.Schena FP, Gesualdo L. Pathogenetic mechanisms of diabetic nephropathy. Journal of the American Society of Nephrology. 2005;16(supplement 1):S30–S33. doi: 10.1681/asn.2004110970. [DOI] [PubMed] [Google Scholar]
- 3.Schrijvers BF, De Vriese AS, Flyvbjerg A. From hyperglycemia to diabetic kidney disease: the role of metabolic, hemodynamic, intracellular factors and growth factors/cytokines. Endocrine Reviews. 2004;25(6):971–1010. doi: 10.1210/er.2003-0018. [DOI] [PubMed] [Google Scholar]
- 4.Wang Y, Zhou J, Minto AW, et al. Altered vitamin D metabolism in type II diabetic mouse glomeruli may provide protection from diabetic nephropathy. Kidney International. 2006;70(5):882–891. doi: 10.1038/sj.ki.5001624. [DOI] [PubMed] [Google Scholar]
- 5.Jain S, Rajput A, Kumar Y, Uppuluri N, Arvind AS, Tatu U. Proteomic analysis of urinary protein markers for accurate prediction of diabetic kidney disorder. Journal of Association of Physicians of India. 2005;53:513–520. [PubMed] [Google Scholar]
- 6.Berger M, Mönks D, Wanner C, Lindner TH. Diabetic nephropathy: an inherited disease or just a diabetic complication? Kidney and Blood Pressure Research. 2003;26(3):143–154. doi: 10.1159/000071880. [DOI] [PubMed] [Google Scholar]
- 7.Gomes MB, Nogueira VG. Acute-phase proteins and microalbuminuria among patients with type 2 diabetes. Diabetes Research and Clinical Practice. 2004;66(1):31–39. doi: 10.1016/j.diabres.2004.02.009. [DOI] [PubMed] [Google Scholar]
- 8.Hillege HL, Fidler V, Diercks GFH, et al. Urinary albumin excretion predicts cardiovascular and noncardiovascular mortality in general population. Circulation. 2002;106(14):1777–1782. doi: 10.1161/01.cir.0000031732.78052.81. [DOI] [PubMed] [Google Scholar]
- 9.Gerstein HC, Mann JFE, Yi Q, et al. Albuminuria and risk of cardiovascular events, death, and heart failure in diabetic and nondiabetic individuals. Journal of the American Medical Association. 2001;286(4):421–426. doi: 10.1001/jama.286.4.421. [DOI] [PubMed] [Google Scholar]
- 10.Yang YH, Zhang S, Cui JF, et al. Diagnostic potential of serum protein pattern in type 2 diabetic nephropathy. Diabetic Medicine. 2007;24(12):1386–1392. doi: 10.1111/j.1464-5491.2007.02312.x. [DOI] [PubMed] [Google Scholar]
- 11.Otu HH, Can H, Spentzos D, et al. Prediction of diabetic nephropathy using urine proteomic profiling 10 years prior to development of nephropathy. Diabetes Care. 2007;30(3):638–643. doi: 10.2337/dc06-1656. [DOI] [PubMed] [Google Scholar]
- 12.Rao PV, Lu X, Standley M, et al. Proteomic identification of urinary biomarkers of diabetic nephropathy. Diabetes Care. 2007;30(3):629–637. doi: 10.2337/dc06-2056. [DOI] [PubMed] [Google Scholar]
- 13.Sharma K, Lee S, Han S, et al. Two-dimensional fluorescence difference gel electrophoresis analysis of the urine proteome in human diabetic nephropathy. Proteomics. 2005;5(10):2648–2655. doi: 10.1002/pmic.200401288. [DOI] [PubMed] [Google Scholar]
- 14.Zieske LR. A perspective on the use of iTRAQ™ reagent technology for protein complex and profiling studies. Journal of Experimental Botany. 2006;57(7):1501–1508. doi: 10.1093/jxb/erj168. [DOI] [PubMed] [Google Scholar]
- 15.Aggarwal K, Choe LH, Lee KH. Shotgun proteomics using the iTRAQ isobaric tags. Briefings in Functional Genomics and Proteomics. 2006;5(2):112–120. doi: 10.1093/bfgp/ell018. [DOI] [PubMed] [Google Scholar]
- 16.Aggarwal K, Choe LH, Lee KH. Quantitative analysis of protein expression using amine-specific isobaric tags in Escherichia coli cells expressing rhsA elements. Proteomics. 2005;5(9):2297–2308. doi: 10.1002/pmic.200401231. [DOI] [PubMed] [Google Scholar]
- 17.Glen A, Gan CS, Hamdy FC, et al. ITRAQ-facilitated proteomic analysis of human prostate cancer cells identifies proteins associated with progression. Journal of Proteome Research. 2008;7(3):897–907. doi: 10.1021/pr070378x. [DOI] [PubMed] [Google Scholar]
- 18.Ogata Y, Charlesworth MC, Higgins L, Keegan BM, Vernino S, Muddiman DC. Differential protein expression in male and female human lumbar cerebrospinal fluid using iTRAQ reagents after abundant protein depletion. Proteomics. 2007;7(20):3726–3734. doi: 10.1002/pmic.200700455. [DOI] [PubMed] [Google Scholar]
- 19.Ross PL, Huang YN, Marchese JN, et al. Multiplexed protein quantitation in Saccharomyces cerevisiae using amine-reactive isobaric tagging reagents. Molecular and Cellular Proteomics. 2004;3(12):1154–1169. doi: 10.1074/mcp.M400129-MCP200. [DOI] [PubMed] [Google Scholar]
- 20.Matheson A, Willcox MDP, Flanagan J, Walsh BJ. Urinary biomarkers involved in type 2 diabetes: a review. Diabetes/Metabolism Research and Reviews. 2010;26(3):150–171. doi: 10.1002/dmrr.1068. [DOI] [PubMed] [Google Scholar]
- 21.Afkarian M, Bhasin M, Dillon ST, et al. Optimizing a proteomics platform for urine biomarker discovery. Molecular and Cellular Proteomics. 2010;9(10):2195–2204. doi: 10.1074/mcp.M110.000992. [DOI] [PMC free article] [PubMed] [Google Scholar]
- 22.Luo J, Ning T, Sun Y, et al. Proteomic analysis of rice endosperm cells in response to expression of HGM-CSF. Journal of Proteome Research. 2009;8(2):829–837. doi: 10.1021/pr8002968. [DOI] [PubMed] [Google Scholar]
- 23.Jin J, Park J, Kim K, et al. Detection of differential proteomes of human β-cells during islet-like differentiation using iTRAQ labeling. Journal of Proteome Research. 2009;8(3):1393–1403. doi: 10.1021/pr800765t. [DOI] [PubMed] [Google Scholar]
- 24.Shilov IV, Seymourt SL, Patel AA, et al. The paragon algorithm, a next generation search engine that uses sequence temperature values sequence temperature values and feature probabilities to identify peptides from tandem mass spectra. Molecular and Cellular Proteomics. 2007;6(9):1638–1655. doi: 10.1074/mcp.T600050-MCP200. [DOI] [PubMed] [Google Scholar]
- 25.Pierce A, Unwin RD, Evans CA, et al. Eight-channel iTRAQ enables comparison of the activity of six leukemogenic tyrosine kinases. Molecular and Cellular Proteomics. 2008;7(5):853–863. doi: 10.1074/mcp.M700251-MCP200. [DOI] [PubMed] [Google Scholar]
- 26.Park J, Kim S, Oh JK, et al. Identification of differentially expressed proteins in imatinib mesylate-resistant chronic myelogenous cells. Journal of Biochemistry and Molecular Biology. 2005;38(6):725–738. doi: 10.5483/bmbrep.2005.38.6.725. [DOI] [PubMed] [Google Scholar]
- 27.Park J, Kwon H, Kang Y, Kim Y. Proteomic analysis of O-GlcNAc modifications derived from streptozotocin and glucosamine induced β-cell apoptosis. Journal of Biochemistry and Molecular Biology. 2007;40(6):1058–1068. doi: 10.5483/bmbrep.2007.40.6.1058. [DOI] [PubMed] [Google Scholar]
- 28.Kim K, Kim SJ, Yu HG, et al. Verification of biomarkers for diabetic retinopathy by multiple reaction monitoring. Journal of Proteome Research. 2010;9(2):689–699. doi: 10.1021/pr901013d. [DOI] [PubMed] [Google Scholar]
- 29.Shao C, Li M, Li X, et al. A tool for biomarker discovery in the urinary proteome: a manually curated human and animal urine protein biomarker database. Molecular and Cellular Proteomics. 2011;10(11) doi: 10.1074/mcp.M111.010975. [DOI] [PMC free article] [PubMed] [Google Scholar]
- 30.Narita T, Hosoba M, Kakei M, Ito S. Increased urinary excretions of immunoglobulin G, ceruloplasmin, and transferrin predict development of microalbuminuria in patients with type 2 diabetes. Diabetes Care. 2006;29(1):142–144. doi: 10.2337/diacare.29.1.142. [DOI] [PubMed] [Google Scholar]
- 31.Anderson S, Brenner BM. Pathogenesis of diabetic glomerulopathy: hemodynamic considerations. Diabetes/Metabolism Reviews. 1988;4(2):163–177. doi: 10.1002/dmr.5610040206. [DOI] [PubMed] [Google Scholar]
- 32.Zatz R, Meyer TW, Rennke HG, Brenner BM. Predominance of hemodynamic rather than metabolic factors in the pathogenesis of diabetic glomerulopathy. Proceedings of the National Academy of Sciences of the United States of America. 1985;82(17):5963–5967. doi: 10.1073/pnas.82.17.5963. [DOI] [PMC free article] [PubMed] [Google Scholar]
- 33.Musante L, Candiano G, Bruschi M, et al. Characterization of plasma factors that alter the permeability to albumin within isolated glomeruli. Proteomics. 2002;2(2):197–205. doi: 10.1002/1615-9861(200202)2:2<197::aid-prot197>3.0.co;2-6. [DOI] [PubMed] [Google Scholar]
- 34.Thongboonkerd V, Malasit P. Renal and urinary proteomics: current applications and challenges. Proteomics. 2005;5(4):1033–1042. doi: 10.1002/pmic.200401012. [DOI] [PubMed] [Google Scholar]
- 35.Thongboonkerd V, Barati MT, McLeish KR, et al. Alterations in the renal elastin-elastase system in type 1 diabetic nephropathy identified by proteomic analysis. Journal of the American Society of Nephrology. 2004;15(3):650–662. doi: 10.1097/01.asn.0000115334.65095.9b. [DOI] [PubMed] [Google Scholar]
- 36.Ngai HHY, Sit WH, Jiang PP, Thongboonkerd V, Wan JMF. Markedly increased urinary preprohaptoglobin and haptoglobin in passive heymann nephritis: a differential proteomics approach. Journal of Proteome Research. 2007;6(8):3313–3320. doi: 10.1021/pr070245b. [DOI] [PubMed] [Google Scholar]
- 37.Tamsma JT, Van Den Born J, Bruijn JA, et al. Expression of glomerular extracellular matrix components in human diabetic nephropathy: decrease of heparan sulphate in the glomerular basement membrane. Diabetologia. 1994;37(3):313–320. doi: 10.1007/BF00398060. [DOI] [PubMed] [Google Scholar]
- 38.Hong CY, Chia KS. Markers of diabetic nephropathy. Journal of Diabetes and its Complications. 1998;12(1):43–60. doi: 10.1016/s1056-8727(97)00045-7. [DOI] [PubMed] [Google Scholar]
- 39.Ye WZ, Dubois-Laforgue D, Bellanné-Chantelot C, Timsit J, Velho G. Variations in the vitamin D-binding protein (Gc locus) and risk of type 2 diabetes mellitus in French Caucasians. Metabolism: Clinical and Experimental. 2001;50(3):366–369. doi: 10.1053/meta.2001.20172. [DOI] [PubMed] [Google Scholar]
- 40.Nykjaer A, Dragun D, Walther D, et al. An endocytic pathway essential for renal uptake and activation of the steroid 25-(OH) vitamin D3 . Cell. 1999;96(4):507–515. doi: 10.1016/s0092-8674(00)80655-8. [DOI] [PubMed] [Google Scholar]
- 41.Fournier T, Medjoubi-N N, Porquet D. Alpha-1-acid glycoprotein. Biochimica et Biophysica Acta. 2000;1482(1-2):157–171. doi: 10.1016/s0167-4838(00)00153-9. [DOI] [PubMed] [Google Scholar]
- 42.Corso A, Serricchio G, Zappasodi P, et al. Assessment of renal function in patients with multiple myeloma: the role of urinary proteins. Annals of Hematology. 1999;78(8):371–375. doi: 10.1007/s002770050531. [DOI] [PubMed] [Google Scholar]
- 43.Reece EA, Ji I, Wu YK, Zhao Z. Characterization of differential gene expression profiles in diabetic embryopathy using DNA microarray analysis. American Journal of Obstetrics and Gynecology. 2006;195(4):1075–1080. doi: 10.1016/j.ajog.2006.05.054. [DOI] [PubMed] [Google Scholar]
- 44.Gu Z, Thomas G, Yamashiro J, et al. Prostate stem cell antigen (PSCA) expression increases with high gleason score, advanced stage and bone metastasis in prostate cancer. Oncogene. 2000;19(10):1288–1296. doi: 10.1038/sj.onc.1203426. [DOI] [PubMed] [Google Scholar]


