Abstract
Background:
The quantification and interpretation of cardiorespiratory fitness (CRF) in obesity is important for adequately assessing cardiovascular conditioning, underlying comorbidities, and properly evaluating disease risk. We retrospectively compared peak oxygen uptake (o2peak) (ie, CRF) in absolute terms, and relative terms (% predicted) using three currently suggested prediction equations (Equations R, W, and G).
Methods:
There were 19 nonobese and 66 obese participants. Subjects underwent hydrostatic weighing and incremental cycling to exhaustion. Subject characteristics were analyzed by independent t test, and % predicted o2peak by a two-way analysis of variance (group and equation) with repeated measures on one factor (equation).
Results:
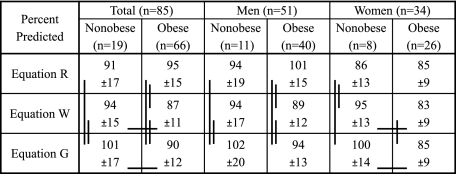
o2peak (L/min) was not different between nonobese and obese adults (2.35 ± 0.80 [SD] vs 2.39 ± 0.68 L/min). o2peak was higher (P < .02) relative to body mass and lean body mass in the nonobese (34 ± 8 mL/min/kg vs 22 ± 5 mL/min/kg, 42 ± 9 mL/min/lean body mass vs 37 ± 6 mL/min/lean body mass). Cardiorespiratory fitness assessed as % predicted was not different in the nonobese and obese (91% ± 17% predicted vs 95% ± 15% predicted) using Equation R, while using Equation W and G, CRF was lower (P < .05) but within normal limits in the obese (94 ± 15 vs 87 ± 11; 101% ± 17% predicted vs 90% ± 12% predicted, respectively), depending somewhat on sex.
Conclusions:
Traditional methods of reporting o2peak do not allow adequate assessment and quantification of CRF in obese adults. Predicted o2peak does allow a normalized evaluation of CRF in the obese, although care must be taken in selecting the most appropriate prediction equation, especially in women. In general, otherwise healthy obese are not grossly deconditioned as is commonly believed, although CRF may be slightly higher in nonobese subjects depending on the uniqueness of the prediction equation.
Obesity is a widespread and growing problem worldwide and is among the most important health challenges of the 21st century.1 Exercise is an important component in the prevention and treatment of obesity and, thus, an accurate assessment of the patient’s cardiorespiratory fitness (CRF) level to determine optimal workout intensities, exercise modes, and exercise routines is critical.2 Moreover, a proper quantification and interpretation of CRF is important for assessing who has low CRF, underlying comorbidities, and increased disease risk.
Peak oxygen uptake (o2peak) is routinely measured as a means of evaluating CRF by exercise physiologists, allied health-care providers, epidemiologists, and physicians, who are accustomed to making clinical decisions based upon comparisons with normal ranges. However, selecting the correct normal value for comparison in obesity is complicated.3‐7 When o2peak is displayed relative to total body mass, obese adults are severely penalized (ie, show lower values than nonobese) and their state of CRF is not accurately reflected (ie, maximal performance of the cardiorespiratory systems).3,4,8 o2peak relative to lean body mass (LBM) (mL/min/LBM) might be a better approach in mildly obese individuals,8 except when there is a significant increase in LBM as in moderate-to-extreme obese subjects.9,10
An alternative way to assess CRF is to predict o2peak in mL/min/kg for a given age and sex, and convert it to mL/min by multiplying by a predicted weight; then, CRF is assessed as % predicted.5‐7,11 The basic assumption is that cardiorespiratory system capacity is not related to total weight in the obese but to their height and estimated normal (predicted) weight.5 Wasserman and others12 extended this technique and adjusted the predicted value in mL/min for the increased metabolic requirements of unloaded exercise in obesity.13 Recently, Gläser et al14 developed a new prediction equation for o2peak from a population that included normal obese adults. CRF evaluations using these methods have not been compared for a large cohort of otherwise healthy adults in whom LBM was determined and included nonobese and obese men and women over a substantial range of obesity.
The purpose of our retrospective study was to carefully assess and quantify CRF using: (1) traditional methods, and (2) % predicted values by means of three different equations for predicting o2peak, in carefully selected healthy nonobese and obese men and women, who had both determinations of o2peak and body composition. We hypothesized that prediction equations with adjustments for obesity would allow for a graded assessment and quantification of CRF (ie, low, normal, or high CRF according to Wasserman et al12) in obese individuals not possible with the traditional methods.
Materials and Methods
This is a retrospective study using subjects who took part in projects related to exercise and obesity in our laboratory.15‐21 In accordance with the Institutional Review Board (University of Texas Southwestern Medical Center, STU 122010-108), all details of the experiments were discussed with the volunteers, and informed consent was obtained before participation. All subjects were selected using the same guidelines, were nonsmokers, and had the same exclusion criteria: history of asthma, cardiovascular disease, musculoskeletal abnormalities, or had participated in regular vigorous exercise for the last 6 months. Participants were instructed to avoid exercise 24 h prior to study, and food and caffeine for at least 2 h before testing. Hydrostatic weighing, with the measurement of residual volume during weighing, was performed to determine percentage of body fat, LBM, and total body fat mass.22 o2peak (open circuit spirometry) was determined by graded cycle ergometer exercise (model CPE 2000; MedGraphics) to exhaustion. Testing began with the subjects seated on an electronically braked cycle ergometer with 3 min of baseline measurements. Initial workrate was set at 20 W for women and 30 W for men. Workrate was increased each minute by 20 W in women or 30 W in men until termination of exercise test. Test termination criteria included volitional exhaustion or pedal rate ≤ 50 rpm.
Prediction Equations
Equation R (from Riddle et al23), used age and predicted weight to predict o2peak (mL/min)5,23:
Men (60 − 0.55A) × PW [PW = (4.13H/2.54 − 135)/2.2]
Women (48 − 0.37A) × PW [PW = (3.55H/0.54 − 106)/2.2]
Equation W (from Wasserman et al12), used age and predicted weight plus an adjustment for increase during cycling in obesity,13 to predict o2peak (mL/min)12:
Men nonobese [(50.72 − 0.372A) × ((PW + MW)/2)]
Men obese [(50.72 − 0.372A) × PW + (6 × (MW − PW))] [PW = 0.79H − 60.7]
Women nonobese [(22.78 − 0.17A) × ((PW + MW + 86)/2)]
Women obese [(22.78 − 0.17A) × (PW + 43) + (6 × (MW − PW))] [PW = 0.65H − 42.8]
Equation G (from Glässer et al14), used age, height, and measured weight, developed from a reference population with numerous obese individuals, to predict o2peak (mL/min)14:
Men* (−69 + 1.48A + 14.02H + 7.44MW − 0.2256A2)
Women (−588 − 11.33A + 9.13H + 26.88MW − 0.12MW2)
where A = age in y, H = height in cm, PW = predicted weight in kg, and MW = measured weight in kg. *The original equation for men in Equation G includes a correction factor for smoking (0 for no, 1 for yes), but was not included since the present subjects were nonsmokers.
Statistical Analyses
Statistical analyses were undertaken using SAS, version 9.2 (SAS Institute Inc).24 Differences in subject characteristics, absolute o2peak (defined as L/min), and relative o2peak (defined as mL/min/kg, and mL/min/LBM) between groups were tested with an independent t test. Predicted o2peak and % predicted o2peak data were analyzed with a two-way analysis of variance (group and equation) with repeated measures on one factor (equation). Multiple comparisons between groups (Tukey) and within groups (one-way analysis of variance with repeated measures) were adjusted to control for experiment-wise error. The same analyses were applied to differences between sexes. Relationships among variables were determined with Pearson correlation coefficients. A P < .05 value was considered significant.
Results
Fifty-one men (11 nonobese, 40 obese) and 34 women (8 nonobese, 26 obese) comprised the cohort of 85 adults (Table 1).
Table 1.
—Subject Characteristics
| Total (N = 85) |
Men (n = 51) |
Women (n = 34) |
||||
| Nonobese (n = 19) | Obese (n = 66) | Nonobese (n = 11) | Obese (n = 40) | Nonobese (n = 8) | Obese (n = 26) | |
| Age, y | 31.6 ± 7.6 | 35.1 ± 6.9 | 29.6 ± 6.9 | 36.5 ± 6.4b | 34.4 ± 8.1 | 32.8 ± 7.2 |
| Height, cm | 171 ± 10 | 173 ± 11 | 178 ± 7 | 180 ± 5 | 162 ± 6 | 163 ± 8 |
| Weight, kg | 67.1 ± 10.9 | 108.0 ± 17.8c | 74.2 ± 6.3 | 115.3 ± 16.3b | 57.3 ± 7.6 | 96.9 ± 13.8b |
| BMI | 22.6 ± 2.5 | 35.9 ± 4.4c | 23.2 ± 2.4 | 35.6 ± 4.4b | 21.7 ± 2.5 | 36.3 ± 4.6b |
| Body fat,a % | 18.2 ± 3.6 | 40.0 ± 5.8c | 18.1 ± 4.0 | 37.8 ± 4.7b | 18.3 ± 3.4 | 43.4 ± 5.7b |
| Fat mass, kg | 12.8 ± 3.2 | 43.4 ± 10.5c | 13.5 ± 3.4 | 44.1 ± 10.9b | 11.8 ± 2.9 | 42.4 ± 10.0b |
| Lean body mass, kg | 54.3 ± 9.2 | 64.6 ± 11.1c | 60.7 ± 5.2 | 71.2 ± 7.6b | 45.4 ± 4.9 | 54.4 ± 7.1b |
| Predicted weight, kg, R | 63.4 ± 9.1 | 65.2 ± 9.1 | 70.0 ± 5.0 | 71.5 ± 4.2 | 54.4 ± 4.1 | 55.5 ± 5.1 |
| Predicted weight, kg, W | 72.3 ± 10.1d | 74.2 ± 10.1d | 79.7 ± 5.3d | 81.3 ± 4.5d | 62.2 ± 4.2d | 63.3 ± 5.3d |
Values are means ± SD. R = equation R; W = equation W.
For the obese women, body fat range was 30% to 54%. For the obese men, body fat range was 30% to 46%.
Significantly different from nonobese within sex (P < .01).
Significantly different from all nonobese (P < .01).
Significantly different from predicted weight R (P < .001).
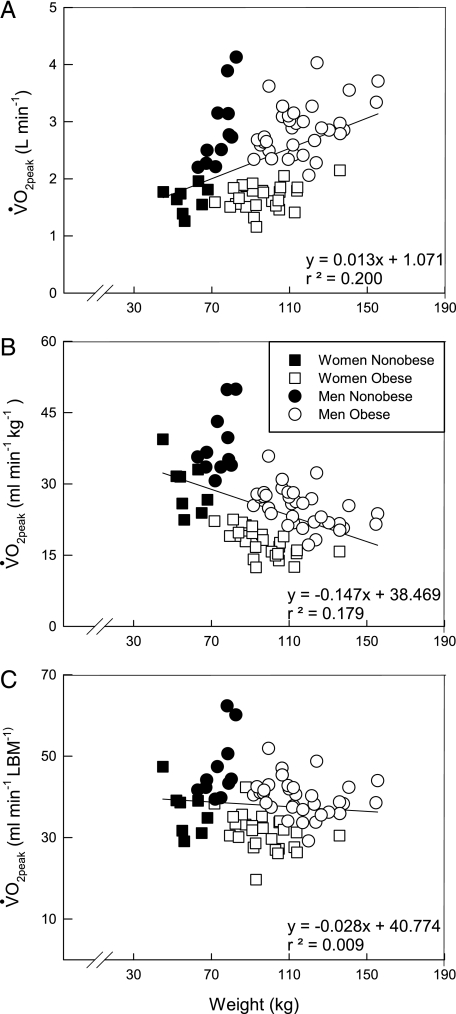
There were no differences in maximal power output (W) or absolute o2peak (L/min) between the nonobese and obese (Table 2). However, o2peak relative to body mass (mL/min/kg) and LBM (mL/min/LBM) were lower (P < .01) in the obese. The effect of body mass on all traditional displays of o2peak are shown in Figure 1. o2peak (L/min) (Fig 1A) increases while o2peak (mL/min/kg) (Fig 1B) decreases with increased body mass. o2peak (mL/min/LBM) (Fig 1C) slightly declines with body mass and penalizes the obese group to a smaller degree. This decline reflects the approximately 10 kg larger (P < .01) LBM in the obese subjects.
Table 2.
—Peak Exercise
| Total (N = 85) |
Men (n = 51) |
Women (n = 34) |
||||
| Nonobese (n = 19) | Obese (n = 66) | Nonobese (n = 11) | Obese (n = 40) | Nonobese (n = 8) | Obese (n = 26) | |
| Max power output, W | 203 ± 68 | 189 ± 51 | 243 ± 62 | 222 ± 35 | 148 ± 18 | 139 ± 20 |
| o2peak, L/min | 2.35 ± 0.80 | 2.39 ± 0.68 | 2.86 ± 0.66 | 2.86 ± 0.43 | 1.64 ± 0.23 | 1.68 ± 0.23 |
| o2peak, mL/min/kg | 34.5 ± 7.6 | 22.1 ± 5.1a | 38.3 ± 6.6 | 25.0 ± 4.0b | 29.3 ± 5.6 | 17.6 ± 2.9b |
| o2peak, mL/min/LBM | 42.4 ± 8.7 | 36.6 ± 6.3a | 46.9 ± 7.8 | 40.1 ± 4.5b | 36.4 ± 5.9 | 31.3 ± 4.5b |
Values are means ± SD. o2peak = peak oxygen uptake.
Significantly different from all nonobese (P < .01).
Significantly different from nonobese within sex (P < .01).
Figure 1.
Individual data showing the effect of body weight on o2peak. A, Displayed in absolute terms (L/min). B, Displayed relative to body weight (mL/min/kg). C, Displayed relative to LBM (mL/min/LBM). Solid line represents regression line for all subjects. o2peak = peak oxygen uptake; LBM = lean body mass.
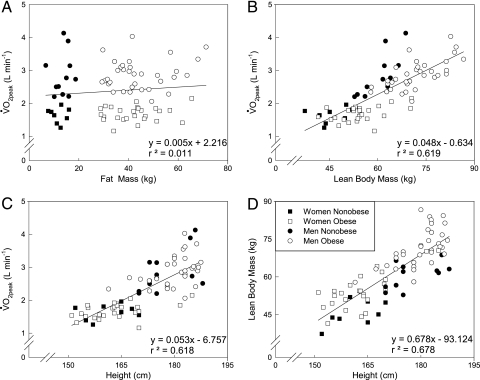
The interrelationships between LBM, fat mass, height, and o2peak are shown in Figure 2. The increase in fat mass with obesity has almost no association with o2peak (Fig 2A) while the increase in LBM is strongly correlated (P < .001) with o2peak (Fig 2B). Some of this association is related to the effect of height on both o2peak (Fig 2C) and LBM (Fig 2D). The correlation between o2peak and LBM is decreased from 0.82 to 0.40 when the effect of height is partitioned out (data not shown). Therefore, groups that vary greatly in LBM (ie, different body fat and/or different heights) will have different mL/min/LBM independent of CRF.
Figure 2.
Individual data showing relationships between different indices of body size and o2peak. A, B, o2peak vs fat mass and o2peak vs LBM relationships, respectively. C, D, o2peak vs height and LBM vs height relationships, respectively. Solid line represents regression line for all subjects. See Figure 1 legend for expansion of abbreviations.
Whole-Group Differences
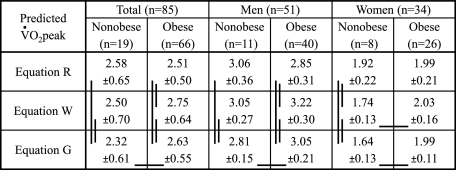
Figure 3 shows that all the equations predicted different o2peak values for all (ie, total) nonobese and obese, with the exception of Equation R and W, which yielded similar o2peak values in the nonobese (ie, vertical lines denote significant differences between equations). As expected, Equation W predicted a higher o2peak value than Equation R for the obese because only Equation W has an adjustment for obesity. Equation G was the only equation where the o2peak values were significantly different between the nonobese and obese (ie, horizontal lines denotes significant differences between groups within a specific equation).
Figure 3.
Predicted o 2 peak values. Values are means ± SD in L/min. Horizontal lines represent significant difference between groups within equation. Vertical lines represent significant difference between equations. o 2 peak 5 peak oxygen uptake.
Sex Differences
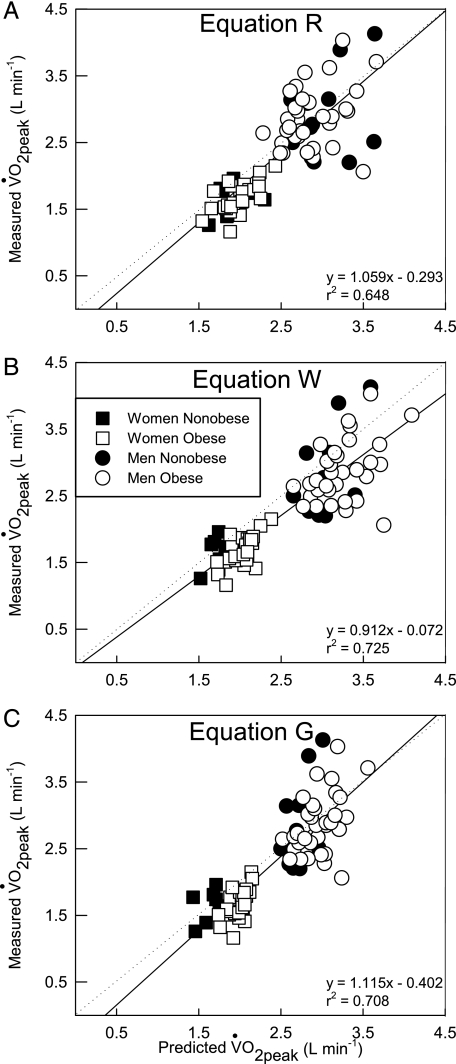
The differences between nonobese and obese were not representative of the differences observed for the men and women. As expected, in the nonobese men there were no differences between Equation R and W because neither equation has a correction factor for nonobese individuals, and for the obese men Equation W predicted a higher o2peak value than Equation R. Equation G was the only equation where the o2peak values were significantly different between the nonobese and obese men. However, the opposite pattern was observed in the nonobese and obese women; there were no differences in the predicted o2peak values between all the equations in the obese, but they all predicted different o2peak values in the nonobese women. Figure 4 shows the relationship between each prediction equation with the measured o2peak data.
Figure 4.
Relationship between each prediction method with the measured o2peak data for all individuals. A, Equation R. B, Equation W. C, Equation G. Straight line and dotted line represent the regression line and line of equality, respectively. See Figure 1 legend for expansion of abbreviation.
Whole-Group Differences
Figure 5 shows that all the equations yielded different levels of CRF (o2peak % predicted) for all (ie, total) nonobese and obese, with the exception of Equations R and W in the nonobese, and only Equation R showed CRF to be not different between the nonobese and obese. In contrast, with Equations W and G, nonobese had a higher level of CRF than obese, although obese were still within the range of normal fitness (ie, > 84% predicted12).
Figure 5.
o2peak values as % predicted. Values are means ± SD. Horizontal lines represent significant difference between groups within equation. Vertical lines represent significant difference between equations. See Figure 1 legend for expansion of abbreviation.
Sex Differences
Between nonobese and obese men, CRF was not different independent of equation. However, all the equations yielded different levels of CRF for the nonobese and obese men, with the exception of Equations R and W in the nonobese men. In the women, Equations W and G showed higher CRF in nonobese than obese. Most importantly, we observed that among equations there was an unexpected wide range of CRF in the nonobese women, and very similar values in the obese, which contrast with what was observed in the men. Nevertheless, the use of % predicted o2peak allowed a quantified assessment of CRF in both nonobese and obese adults unlike the traditional methods, although each method had its own characteristics for the effect of body mass.
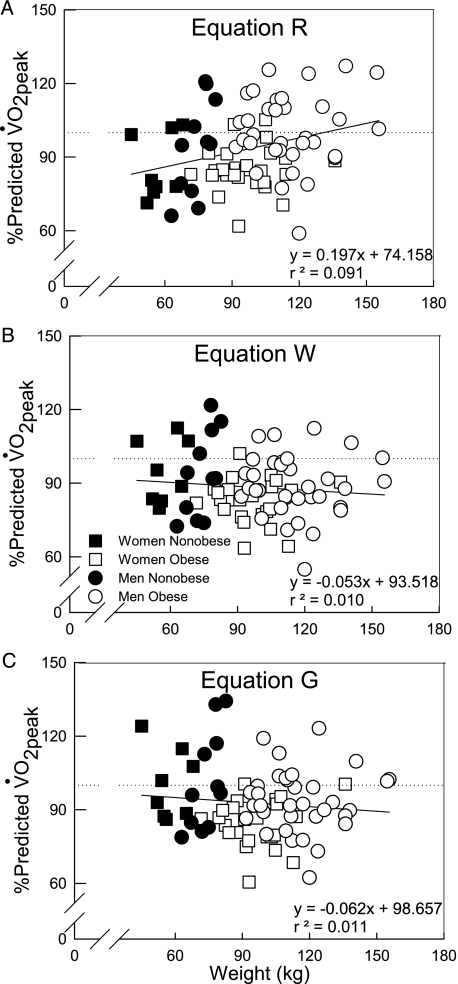
Individual data for o2peak % predicted are shown in Figure 6 demonstrating the effect of body mass on each prediction equation. The tendency for CRF to increase in heavier subjects with Equation R is shown in Figure 4A. This increase in CRF was due to the tendency for heavier subjects to have a slightly higher o2peak and Method R does not have a correction for obese individuals. With Equation W (Fig 4B), there was a tendency for CRF to decrease in heavier subjects, resulting from the correction for the increased metabolic load of cycling in obesity. The same pattern was shown in Figure 4C for Equation G, but overall CRF is increased in all subjects with this equation (ie, similar slope as in Equation W, but higher y-intercept). The % predicted approach allowed a graded quantification of CRF among obese, as well as comparisons with nonobese individuals.
Figure 6.
Individual data showing the effect of body mass on o2peak % predicted by Equations R, Equation W, and Equation G. A, Equation R. B, Equation W. C, Equation G. Dotted line and solid line represent 100% of predicted o2peak and regression lines, respectively. See Figure 1 legend for expansion of abbreviations.
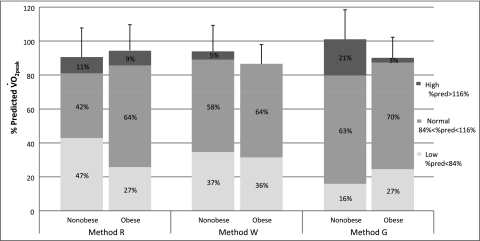
Using % predicted equations, Figure 7 illustrates the overall proportion of nonobese and obese subjects with low, normal, and high CRF.12 Although, mean CRF appeared to be slightly lower in the obese when compared with nonobese in Equations W and G, a higher percentage of the nonobese had low CRF than obese in Equations R and W. Equation G showed an opposite pattern. Furthermore, a large proportion of obese individuals (ie, 64% to 70%) have normal CRF, independent of the equation. Although the fitness categories are somewhat arbitrary, this graph still shows how similar the proportion in each fitness category in the nonobese vs obese groups is.
Figure 7.
Overall cardiorespiratory fitness in the nonobese and obese groups. Group bars (ie, Nonobese or Obese within each method) correspond to the o2peak % predicted values (y-axis) for each group. Categories were determined as follows: low = o2peak % predicted < 84%; normal = 84% < o2peak % predicted < 116%; high = % predicted o2peak > 116%. Numbers inside bars represent the overall percentage of each category. See Figure 1 legend for expansion of abbreviation.
Discussion
Our main findings are as follows: (1) Traditional methods of reporting o2peak (ie, L/min, mL/min/kg, mL/min/LBM) do not allow adequate assessment and quantification of CRF among obese and nonobese; (2) the use of a % predicted o2peak enables a graded assessment and quantification of CRF in obese, although care must be taken in selecting the most appropriate prediction equation, especially in women; (3) quantifying CRF in obesity is a complex and extremely important issue that requires careful selection, use, and interpretation of comparison techniques when assessing deconditioning and disease impairment in obese adults or patients; and (4) in general, otherwise healthy obese individuals of the degree and age from the present study are not deconditioned as is commonly believed, although CRF may be slightly higher in nonobese depending on the uniqueness of the prediction equation selected. Nevertheless, a higher proportion of obese individuals had normal CRF compared with the nonobese subjects.
Our results agree with others and show that absolute o2peak (L/min) was not different between nonobese and obese of the same height and sex.25‐27 However, our results contrast with some who observed o2peak (L/min) to be elevated in obesity.3,4,8,28 o2peak is usually increased in obesity,3,4,8,28 not because of an increased cardiorespiratory capacity or increased fat weight, but rather because of an increase in LBM to support the larger structure.3,8,29 In addition, the increased o2peak in the obese may be a result of them having to carry the added weight every day. Wasserman and Whipp13 proposed the obese to have a slightly elevated o2peak compared with the nonobese, which may increase by approximately 6 mL/min/(kg of extra body weight). Our results failed to show an increase in o2peak in the obese, which suggests that the correction factor in Equation W may not apply to all obese subjects. Alternatively, it could be that the correction does not apply to at peak exercise (correction factor was derived from unloaded cycling in men and it may not represent the same difference between obese and nonobese observed at maximal efforts) or to women (men were closer to their predicted value than the women).
We observed a decrease in relative o2peak (mL/min/kg) in the obese,25,27,30,31 although this approach is not an adequate representation of CRF in obese subjects.3,12,32 We also observed that o2peak adjusted for LBM was still significantly lower in the obese compared with the nonobese individuals. These observations agree with prior studies,10,27,32,33 but contrast with the results from others.8,28,29,31 Our obese had significantly larger LBM than the nonobese, and thus lower o2peak (36.6 mL/min/LBM vs 42.4 mL/min/LBM), which closely match the differences reported between obese and normal weight individuals in a study by Ofir et al.32 Studies with a more limited range in body fat8,28,29,31 observed similar o2peak (mL/min/LBM) values between obese and nonobese, while those studies with larger differences in body fat had similar results to ours.10,27,32,33
The interrelationships between LBM, height, and o2peak are very important, as seen in Figure 6. When taking out the effect of height on the relationship between LBM with o2peak the correlation drops by half (r = 0.40). Thus, one must use caution when comparing o2peak in mL/min/LBM between nonobese and obese if the subjects are of different heights and have large differences in adiposity. Moreover, unlike o2peak adjusted for body mass, the LBM adjustment does not have normative values to evaluate CRF, which make these data difficult to interpret,32 and makes this approach very limited for clinical use.
Depending on the prediction equation, CRF ranged from somewhat higher to slightly lower in nonobese compared with obese. Some variation in our results was expected given that all approaches had different derivations for predicting o2peak. Regardless of the equation, we expected the predicted o2peak values to be more similar among nonobese than obese, which was the case in the men but not so in the women. Therefore, CRF was not different between nonobese and obese men, but CRF was higher in nonobese than obese women (see Fig 5). All subjects who participated on this study reported similar current physical activity levels as well as exercise history, and thus, there is little reason to believe that the nonobese and obese had different CRF. Moreover, Figure 7 shows that, although the mean CRF between nonobese and obese may be slightly different, the percentage of nonobese or obese individuals under each category is roughly the same, and there is a large proportion (64%-70%) of obese individuals who have normal CRF. Taken together, most of the obese subjects have only a slight reduction in CRF, if any, and this difference should not alter prescribed treatment to increase overall CRF, cardiopulmonary health status, or exercise for weight maintenance/loss.
From our results it is apparent that the ability to predict o2peak using the present equations is certainly influenced by sex. For example, in the men we observed an increased variability for the predicted o2peak values in the obese compared with the nonobese. This could be expected as some of the prediction equations used in the present investigation have adjustments when applying them to obese individuals, while other prediction equations do not have such adjustments. On the other hand, the prediction equations for women behaved opposite to those of the men; the increased variability for the predicted o2peak values was observed in the nonobese rather than in the obese women. We are puzzled as to why this is the case, but this could be perhaps due to the different specific characteristics of the reference populations used to derive the prediction equation in women. Nonetheless, an improved prediction equation in nonobese and obese women is warranted for assessing deconditioning and disease risk.
Our cohort was very unique in the sense that we used carefully selected healthy nonobese and obese subjects who performed a peak exercise test and underwent hydrostatic weighing to estimate percent body fat, fat mass, and LBM. However, when the cohort is divided up by sex the number of control nonobese subjects is limited. Our original research interest was on obese subjects mainly, and sex differences were unexpected. Nevertheless, we were successful in showing how quantifying CRF using traditional approaches differ from prediction equations, which have not been evaluated for a large cohort of otherwise healthy obese men and women over a substantial range of obesity with body composition measurements.
These results are important for adequately assessing CRF, underlying comorbidities, and disease risk. Although many reports suggest that increased fitness is associated with lower risk of mortality regardless of the degree of adiposity,34‐39 there are no well-accepted norms to appropriately determine and quantify CRF in obesity. Some large epidemiologic studies34‐37,39‐41 have assessed CRF based upon o2peak (mL/min/kg).42 Our results suggest this method of assessing CRF in obesity is inappropriate. Thus, the impact of CRF on all-cause mortality and morbidity may be erroneously assessed and misleading in obesity.
There are several important findings from the present research. First, traditional methods of evaluating o2peak (ie, L/min, mL/min/kg, mL/min/LBM) are not appropriate when applying them in obese individuals. o2peak % predicted is probably a better alternative when assessing CRF in obesity. Based on our results, we recommend employing the Wasserman prediction equation for men (Equation W). There was greater variability between the prediction equations in the women but Equation R seems to best option to assess CRF. However, a better prediction equation for obese and nonobese women is required. These data provide substantial evidence that CRF in healthy young obese individuals is much higher than what is commonly believed. Moreover, the actual proportion of individuals with low CRF is about the same between nonobese and obese individuals and there is a large proportion of the obese with normal CRF.
Acknowledgments
Author contributions: Dr Babb had full access to all of the data in the study and takes responsibility for the integrity of the data and the accuracy of the data analysis.
Dr Lorenzo: contributed to data collection, data processing and analysis, critical input, and the writing of the manuscript.
Dr Babb: contributed to planning the project, supervising and assisting in data collection, directing data processing and analysis, and the writing of the manuscript.
Financial/nonfinancial disclosures: The authors have reported to CHEST that no potential conflicts of interest exist with any companies/organizations whose products or services may be discussed in this article.
Role of sponsors: The sponsors had no role in the design of the study, the collection and analysis of the data, or in the preparation of the manuscript.
Other contributions: We thank Jim Hansen, MD, for his input on this topic, and the various Institute for Exercise and Environmental Medicine research associates for their assistance in different stages of this project. This work was performed at the Institute for Exercise and Environmental Medicine.
Abbreviations
- CRF
cardiorespiratory fitness
- LBM
lean body mass
- MW
measured weight
- PW
predicted weight
- o2
oxygen uptake
- o2peak
peak oxygen uptake
Footnotes
Funding/Support: This work was supported by the King Charitable Foundation Trust, American Lung Association, American Heart Association, The Research and Education Institute at Texas Health Resources, Cain Foundation, National Institutes of Health [HL096782], and Texas Health Presbyterian Hospital Dallas.
Reproduction of this article is prohibited without written permission from the American College of Chest Physicians (http://www.chestpubs.org/site/misc/reprints.xhtml).
References
- 1.US Department of Health and Human Services, National Institutes of Health . Washington, DC: US Department of Health and Human Services, National Institutes of Health; 2004. Strategic Plan for NIH Obesity Research: a report of the NIH Obesity Research Task Force; pp. 1–90. NIH publication 04-5493. [Google Scholar]
- 2.Pollock ML. Exercise—a preventive prescription. J Sch Health. 1979;49(4):215–219. doi: 10.1111/j.1746-1561.1979.tb04607.x. [DOI] [PubMed] [Google Scholar]
- 3.Jones NL. The interpretation of stage 1 exercise test results. In: Trumbold C, editor. Clinical Exercise Testing. Philadelphia, PA: W.B. Saunders; 1988. pp. 158–185. [Google Scholar]
- 4.Wasserman K, Hansen JE, Sue DY, et al. Principles of Exercise Testing and Interpretation. Philadelphia, PA: Lea and Febiger; 1987. p. 261. [Google Scholar]
- 5.Younes M. Interpretation of clinical exercise testing in respiratory disease. Clin Chest Med. 1984;5(1):189–206. [PubMed] [Google Scholar]
- 6.Hansen JE, Sue DY, Wasserman K. Predicted values for clinical exercise testing. Am Rev Respir Dis. 1984;129(2 Pt 2):S49–S55. doi: 10.1164/arrd.1984.129.2P2.S49. [DOI] [PubMed] [Google Scholar]
- 7.Sue DY, Hansen JE. Normal values in adults during exercise testing. Clin Chest Med. 1984;5(1):89–98. [PubMed] [Google Scholar]
- 8.Buskirk ER, Taylor HL. Maximal oxygen intake and its relation to body composition, with special reference to chronic physical activity and obesity. J Appl Physiol. 1957;11(1):72–78. doi: 10.1152/jappl.1957.11.1.72. [DOI] [PubMed] [Google Scholar]
- 9.Babb TG, Wyrick BL, DeLorey DS, Chase PJ, Feng MY. Fat distribution and end-expiratory lung volume in lean and obese men and women. Chest. 2008;134(4):704–711. doi: 10.1378/chest.07-1728. [DOI] [PubMed] [Google Scholar]
- 10.Wood RE, Hills AP, Hunter GR, King NA, Byrne NM. Vo2max in overweight and obese adults: do they meet the threshold criteria? Med Sci Sports Exerc. 2010;42(3):470–477. doi: 10.1249/MSS.0b013e3181b666ad. [DOI] [PubMed] [Google Scholar]
- 11.Bruce RA, Kusumi F, Hosmer D. Maximal oxygen intake and nomographic assessment of functional aerobic impairment in cardiovascular disease. Am Heart J. 1973;85(4):546–562. doi: 10.1016/0002-8703(73)90502-4. [DOI] [PubMed] [Google Scholar]
- 12.Wasserman K, Hansen JE, Sue DY, et al. Normal Values. Principles of Exercise Testing and Interpretation: Including Pathophysiology and Clinical Applications. Philadelphia, PA: Lippincott Williams and Wilkins; 2005. pp. 160–182. [Google Scholar]
- 13.Wasserman K, Whipp BJ. Excercise physiology in health and disease. Am Rev Respir Dis. 1975;112(2):219–249. doi: 10.1164/arrd.1975.112.2.219. [DOI] [PubMed] [Google Scholar]
- 14.Gläser S, Koch B, Ittermann T, et al. Influence of age, sex, body size, smoking, and beta blockade on key gas exchange exercise parameters in an adult population. Eur J Cardiovasc Prev Rehabil. 2010;17(4):469–476. doi: 10.1097/HJR.0b013e328336a124. [DOI] [PubMed] [Google Scholar]
- 15.Babb TG, DeLorey DS, Wyrick BL, Gardner PP. Mild obesity does not limit change in end-expiratory lung volume during cycling in young women. J Appl Physiol. 2002;92(6):2483–2490. doi: 10.1152/japplphysiol.00235.2001. [DOI] [PubMed] [Google Scholar]
- 16.Babb TG, Ranasinghe KG, Comeau LA, Semon TL, Schwartz B. Dyspnea on exertion in obese women: association with an increased oxygen cost of breathing. Am J Respir Crit Care Med. 2008;178(2):116–123. doi: 10.1164/rccm.200706-875OC. [DOI] [PubMed] [Google Scholar]
- 17.Davidoff SL, Rowell CJ, Wood HE, et al. Exertional dyspnea in obese men is associated with low lung volume breathing. Am J Respir Crit Care Med. 2009;;179:A6053. [Google Scholar]
- 18.DeLorey DS, Wyrick BL, Babb TG. Mild-to-moderate obesity: implications for respiratory mechanics at rest and during exercise in young men. Int J Obes (Lond) 2005;29(9):1039–1047. doi: 10.1038/sj.ijo.0803003. [DOI] [PubMed] [Google Scholar]
- 19.Wood HE, Semon TL, Comeau LA, et al. The ventilatory response to exercise does not differ between obese women with and without dyspnea on exertion. Adv Exp Med Biol. 2008;605:514–518. doi: 10.1007/978-0-387-73693-8_90. [DOI] [PubMed] [Google Scholar]
- 20.Babb TG, Wyrick BL, Chase PJ, et al. Effects of weight loss on fat distribution and exercise mechanics in obese men. Med Sci Sports Exerc. 2003;35(5):S229. [Google Scholar]
- 21.Babb TG, Wyrick BL, Chase PJ, et al. Effects of fat distribution and weight loss on lung volume in obese men. Am J Respir Crit Care Med. 2003;167:A417. [Google Scholar]
- 22.Heyward VH, Stolarczyk LM. Applied Body Composition Assessment. Champaign, IL: Human Kinetics; 1996. [Google Scholar]
- 23.Riddle W, Younes M, Remmers JE, deGroot W. Graphical analysis of patient performance in the pulmonary function laboratory. Proc Annu Symp Comput Appl Med Care. 1980;1:282–290. [Google Scholar]
- 24.SAS Institute Inc . SAS 9.2 Help and Documentation. Cary, NC: SAS Institute Inc; 2008. [Google Scholar]
- 25.Loftin M, Sothern M, Trosclair L, O’Hanlon A, Miller J, Udall J. Scaling VO(2) peak in obese and non-obese girls. Obes Res. 2001;9(5):290–296. doi: 10.1038/oby.2001.36. [DOI] [PubMed] [Google Scholar]
- 26.Babb TG, Buskirk ER, Hodgson JL. Exercise end-expiratory lung volumes in lean and moderately obese women. Int J Obes. 1989;13(1):11–19. [PubMed] [Google Scholar]
- 27.Dempsey JA, Reddan W, Balke B, Rankin J. Work capacity determinants and physiologic cost of weight-supported work in obesity. J Appl Physiol. 1966;21(6):1815–1820. doi: 10.1152/jappl.1966.21.6.1815. [DOI] [PubMed] [Google Scholar]
- 28.Atomi Y, Miyashita M. Maximal oxygen uptake of obese middle-aged women related to body composition and total body potassium. J Sports Med Phys Fitness. 1984;24(3):212–218. [PubMed] [Google Scholar]
- 29.Goran M, Fields DA, Hunter GR, Herd SL, Weinsier RL. Total body fat does not influence maximal aerobic capacity. Int J Obes Relat Metab Disord. 2000;24(7):841–848. doi: 10.1038/sj.ijo.0801241. [DOI] [PubMed] [Google Scholar]
- 30.Welsman JR, Armstrong N, Nevill AM, Winter EM, Kirby BJ. Scaling peak VO2 for differences in body size. Med Sci Sports Exerc. 1996;28(2):259–265. doi: 10.1097/00005768-199602000-00016. [DOI] [PubMed] [Google Scholar]
- 31.Gitin EL, Olerud JE, Carroll HW. Maximal oxygen uptake based on lean body mass: a meaningful measure of physical fitness? J Appl Physiol. 1974;36(6):757–760. doi: 10.1152/jappl.1974.36.6.757. [DOI] [PubMed] [Google Scholar]
- 32.Ofir D, Laveneziana P, Webb KA, O’Donnell DE. Ventilatory and perceptual responses to cycle exercise in obese women. J Appl Physiol. 2007;102(6):2217–2226. doi: 10.1152/japplphysiol.00898.2006. [DOI] [PubMed] [Google Scholar]
- 33.Davies CTM, Godfrey S, Light M, Sargeant AJ, Zeidifard E. Cardiopulmonary responses to exercise in obese girls and young women. J Appl Physiol. 1975;38(3):373–376. doi: 10.1152/jappl.1975.38.3.373. [DOI] [PubMed] [Google Scholar]
- 34.Sui X, LaMonte MJ, Laditka JN, et al. Cardiorespiratory fitness and adiposity as mortality predictors in older adults. JAMA. 2007;298(21):2507–2516. doi: 10.1001/jama.298.21.2507. [DOI] [PMC free article] [PubMed] [Google Scholar]
- 35.Lee CD, Blair SN, Jackson AS. Cardiorespiratory fitness, body composition, and all-cause and cardiovascular disease mortality in men. Am J Clin Nutr. 1999;69(3):373–380. doi: 10.1093/ajcn/69.3.373. [DOI] [PubMed] [Google Scholar]
- 36.Blair SN, Brodney S. Effects of physical inactivity and obesity on morbidity and mortality: current evidence and research issues. Med Sci Sports Exerc. 1999;31(suppl 11):S646–S662. doi: 10.1097/00005768-199911001-00025. [DOI] [PubMed] [Google Scholar]
- 37.Blair SN, Cheng Y, Holder JS. Is physical activity or physical fitness more important in defining health benefits? Med Sci Sports Exerc. 2001;33(suppl 6):S379–S399. doi: 10.1097/00005768-200106001-00007. [DOI] [PubMed] [Google Scholar]
- 38.Warren TY, Barry V, Hooker SP, Sui X, Church TS, Blair SN. Sedentary behaviors increase risk of cardiovascular disease mortality in men. Med Sci Sports Exerc. 2010;42(5):879–885. doi: 10.1249/MSS.0b013e3181c3aa7e. [DOI] [PMC free article] [PubMed] [Google Scholar]
- 39.Wei M, Kampert JB, Barlow CE, et al. Relationship between low cardiorespiratory fitness and mortality in normal-weight, overweight, and obese men. JAMA. 1999;282(16):1547–1553. doi: 10.1001/jama.282.16.1547. [DOI] [PubMed] [Google Scholar]
- 40.Blair SN, Kohl HW, III, Barlow CE, Paffenbarger RS, Jr, Gibbons LW, Macera CA. Changes in physical fitness and all-cause mortality. A prospective study of healthy and unhealthy men. JAMA. 1995;273(14):1093–1098. [PubMed] [Google Scholar]
- 41.Lee DC, Sui X, Blair SN. Does physical activity ameliorate the health hazards of obesity? Br J Sports Med. 2009;43(1):49–51. doi: 10.1136/bjsm.2008.054536. [DOI] [PubMed] [Google Scholar]
- 42.Pollock ML, Bohannon RL, Cooper KH, et al. A comparative analysis of four protocols for maximal treadmill stress testing. Am Heart J. 1976;92(1):39–46. doi: 10.1016/s0002-8703(76)80401-2. [DOI] [PubMed] [Google Scholar]


