Abstract
Cold denaturation is a general property of globular proteins, and the process provides insight into the origins of the cooperativity of protein folding and the nature of partially folded states. Unfortunately, studies of protein cold denaturation have been hindered by the fact that the cold denatured state is normally difficult to access experimentally. Special conditions such as addition of high concentrations of denaturant, encapsulation into reverse micelles, the formation of emulsified solutions, high pressure or extremes of pHs, have been applied, but these can perturb the unfolded state of proteins. The cold denatured state of the C-terminal domain of the ribosomal protein L9 can be populated under native like conditions by taking advantage of a destabilizing point mutation which leads to cold denaturation at temperatures above zero °C. This state is in slow exchange with the native state on the NMR time scale. Virtually complete backbone 15N, 13C and 1H as well as side-chain 13Cβ and 1Hβ chemical shift assignments were obtained for the cold denatured state at pH 5.7, 12 °C. Chemical shift analysis, backbone N-H residual dipolar couplings, amide proton NOEs and R2 relaxation rates all indicate that the cold denatured state of CTL9 contains significant native like secondary structure, but also contains non-native structure. The regions corresponding to the two native α-helices show a strong tendency to populate helical Φ and Ψ angles. The segment which connects α-helix 2 and β-strand 2 (residues 107–124) in the native state exhibits a significant preference to form non-native helical structure in the cold denatured state. The structure observed in the cold denatured state of the I98A mutant is similar to that observed in the pH 3.8 unfolded state of wild type CTL9 at 25 °C, suggesting that it is a robust feature of the denatured state ensemble of this protein. The implications for protein folding and for studies of cold denatured states are discussed.
Introduction
Cold denaturation is a general property of globular proteins, as predicted by the Gibbs-Helmholtz equation and is believed to be driven by the increased hydration of non-polar groups of proteins at low temperatures as well as by the decrease in hydrophobic interactions within the protein (1–4). Thus the cold induced unfolding of a protein is sometimes thought to proceed via a different mechanism from thermal unfolding. The process of cold denaturation has been studied for a wide range of proteins but structural characterization of the cold unfolded state is less extensive than studies of heat or denaturant induced unfolded states. Investigating the structure of the cold denatured state and the cooperativity of cold denaturation is crucial for a complete understanding of protein folding and cooperativity (3, 5–6). An increased knowledge of the cold denatured state is also important for understanding the molecular basis for cold adaptation in psychrophilic organisms (7–8). Most studies of cold unfolding have focused on thermodynamic aspects of the process or have used relatively low resolution spectroscopic methods.
Unfortunately, the study of cold denaturation is difficult because the midpoint of the cold unfolding transition is typically well below 0 °C (3–4). As a consequence studies have been limited to a relatively small number of proteins compared to studies of thermal unfolding. Furthermore the majority of cases require special conditions such as encapsulation (9–11), high pressure (12–14), emulsified samples (15), extremes of pH (2–4, 16) or the addition of high concentrations of denaturant (2–3, 17). All of these methods have the potential to offer insight into the structural and thermodynamic aspects of cold denaturation, although some approaches may perturb the system in complicating ways. For example, encapsulation in reverse micelles has been used to study cold unfolding, but our previous NMR diffusion measurements have shown that cold denatured proteins expand as the temperature is lowered (18) and other groups have shown that under certain circumstances the reverse micelle systems used can shed water and contract as the temperature is decreased (9, 15, 19–20). The combination could lead to significant protein micelle interactions at low temperatures in certain cases. There have been very few reported high resolution studies of the cold denatured state in the absence of encapsulation, denaturant or extremes of pH or pressure(21). Here, we report the detailed characterization of the structural and dynamic properties of the cold denatured state using NMR spectroscopy. We use a destabilizing point mutant of the C-terminal domain of the ribosomal protein L9 (CTL9) to populate the cold unfolded state in homogenous solution in the absence of denaturants at near neutral pH. The implications for the folding of CTL9 are discussed as are the implications for the nature of the cold denatured state.
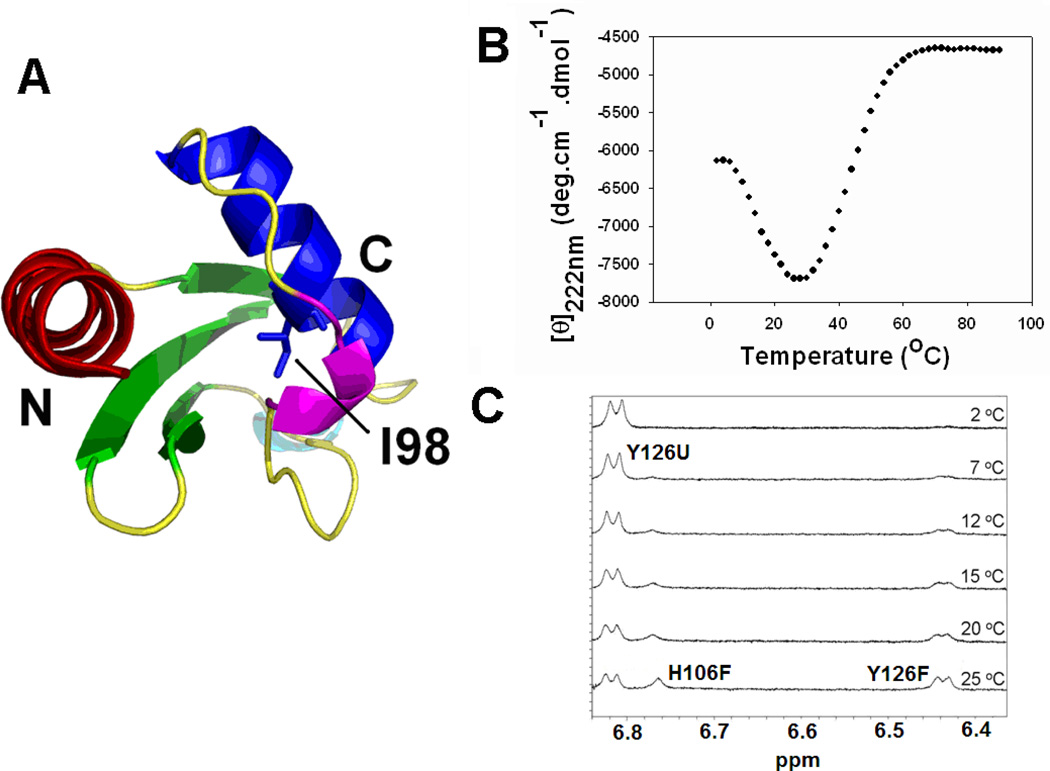
CTL9 is a 92 residue globular protein which adopts a relatively rare fold made up of two α-helices and a three stranded mixed parallel, anti-parallel β-sheet (Figure 1A) (22). An I98A point-mutation destabilizes the protein and reduces ΔH0 of unfolding at the midpoint of the thermal unfolding while increasing ΔCp0 for unfolding. As expected, this increases the temperature of cold unfolding and, in the present case, leads to observable cold-denaturation at temperatures above zero °C in the absence of denaturant or extreme pH values (18). (Figure 1B and 1C). Data presented here together with earlier hydrodynamic measurements show that the mutation does not alter the overall structure of the protein (18). We have characterized the hydrodynamic properties of the cold induced unfolded state of the I98A mutant of CTL9 under native and near native conditions using pulsed field gradient NMR diffusion experiments, and we have shown that the cold denatured state is compact relative to the acid or urea unfolded states but expands as the temperature is lowered (18).
Figure 1.
The I98A mutant undergoes cold denaturation. (A) Ribbon diagram of CTL9 (residues 58–149 of protein L9), Protein data bank entry 1DIV. The hydrophobic core residue I98 as well as the N and C-termini are labeled. The ribbon diagram was made using PyMol. (B) Thermal denaturation curve of I98A CTL9 monitored by CD at 222 nm in H2O at pH 5.7. (C) 1D 1H-NMR spectra of I98A CTL9 at different temperatures in 100% D2O at pD 6.0 (uncorrected pH meter reading). Only the aromatic region is shown, resonance assignments are labeled.
Materials and Methods
Protein expression and purification
15N-labeled CTL9 and 13C, 15N-labeled CTL9 and the labeled I98A mutant were overexpressed and purified as previously described (23–24). The identity of the proteins was confirmed using MALDI-TOF mass spectroscopy and the purity was checked using analytical HPLC. The yield of pure protein was 30 mg per liter of M9 minimal media.
Circular dichroism spectroscopy
CD experiments were carried out using a Chirascan CD spectrometer. The protein was dissolved in 20 mM acetate, 100 mM NaCl buffer, pH 5.7 at a concentration of about 18 µM. Thermal denaturation experiments were performed by monitoring the ellipticity at 222 nm with a heating rate of 1 °C/min. Data were collected from 2 °C to 94 °C, with a 2 °C increment. The experiments were repeated 3 times with independently prepared samples to access the reproducibility of the results and the experimental uncertainties. Additional CD melting experiments were conducted as a function of pH between pH 4.7 and pH 8.0.
Nuclear magnetic resonance experiments
Protein samples for NMR experiments were prepared in 90% H2O and 10% D2O at pH 5.7, with 20 mM sodium acetate and 100 mM NaCl, unless otherwise specified. The protein concentration was about 1 mM. All NMR experiments for the cold denatured state of I98A CTL9 were recorded on 800 or 900 MHz Bruker spectrometers equipped with cryogenic probes at the New York Structural Biology Center. Triple resonance experiments for establishment of the assignments for wild-type CTL9 were performed on a 600 MHz Varian spectrometer at the University of Connecticut Health Center. The 1H dimension was centered at the water resonance and the 15N offset frequency was set to 118.0 ppm for all heteronuclear NMR experiments.
15N-1H correlated heteronuclear single coherence (HSQC) spectra for the I98A mutant were recorded using 1024 × 512 complex points with 8 scans per increment and spectral widths of 9920.6 Hz and 2189.6 Hz for the 1H and 15N dimensions, respectively. The HSQC spectra of wild-type CTL9 sample had spectral widths of 6600.7 Hz (1H) and 1920.0 Hz (15N), respectively.
The HNCO/HNCACO (25–27) and the HNCACB (28–29) experiments were performed to enable sequence-specific backbone and sidechain 13Cβ assignments. The HBHACONH (29–30) experiment was carried out to obtain sidechain 1Hα and 1Hβ assignments. The watergate sequence was employed to suppress water signals in all triple resonance experiments. All spectra were processed using NMRPipe software (31), and chemical shift assignments were made using NMRViewJ (32). All the chemical shifts were referenced to the absolute frequency of DSS at 0.00 ppm. The random coil chemical shift values of Wishart were used to calculate the secondary chemical shifts (33). SSP scores were calculated based on 13Cα, 13Cβ and 1Hα shifts, using the software provided by Professor Forman-Kay at her website (http://pound.med.utoronto.ca/software.html) (34).
A 3D 15N HSQC-NOESY-HSQC experiment was performed on a 15N-labeled sample of I98A CTL9. The spectrum was acquired with spectral widths of 8012.8 (NH), 2108.8 (15N) and 2108.8 (15N) Hz and in a data matrix of 1024 × 128 × 138 complex points, with a mixing time of 300 ms. Coherence selection with gradients and sensitivity enhancement were used, and water suppression was achieved using a water flip back pulse sequence. NOESY peak volumes were measured using NMRViewJ. The NOE peak volumes were normalized as the ratio of the NN(i,i+1) cross peak to the NN(i, i) diagonal peaks to compensate for any potential relaxation effects on the NOE intensities.
15N-1H one bond residual dipolar couplings (RDC) were measured in weakly aligned bicelle media. The bicelles were prepared by mixing 450 µL of NMR buffer with 50 µL of pentaethylene glycol octylether (C8E5). The mixture was gently vortexed until the solution became clear. Then 1-octanol was added in 2 µL increments for a total additional volume of 10 to 11 µL. The bicelles were left at 10 °C overnight. Then the protein solution was added at a ratio of 1:1 to the bicelle solution and gently vortexed. The alignment of the protein with the bicelles was checked by measuring the 2H quadrupolar splitting of the water line. A 15N-1H HSQC experiment was performed on the protein sample in the bicelles. There was no significant change in either the chemical shift or peak intensity observed in any of the resonances, indicating the bicelles do not perturb the protein conformation significantly. To measure the 15N-1H RDCs, 2D inphase and antiphase-HSQC (IPAP-HSQC) spectra (35) were recorded for the sample in the bicelles and in isotropic buffer solutions. The IPAP-HSQC spectra were acquired with 2048 × 512 complex points and with spectral widths of 8012.8 Hz and 2270.7 Hz for the 1H and 15N dimension, respectively. The spectra were processed using NMRPipe software and the 15N-1H splittings were measured using NMRViewJ. The RDCs were calculated as the difference between the scalar coupling splitting in isotropic solution and the observed splitting in the anisotropic solution.
Transverse relaxation (R2) experiments were performed on a 15N-labeled sample as described using a Carr Purcell Meiboom Gill (CPMG) sequence (36). The pulse spacing in the CPMG sequence was 0.9 milliseconds. The spectra were recorded at 10 delay times: 16.96, 33.92, 50.88, 67.84, 84.8, 101.76, 118.72, 135.68, 152.64 and 169.6 ms, with a recycle delay of 3 s. To estimate the uncertainty, duplicate spectra were acquired at 50.88, 101.76 and 152.64 ms delay times. Each spectrum was collected with 4 scans and 1024 × 256 complex points. The spectral widths were 8012.8 Hz (1H) and 2027.7 (15N). R2 rates were determined by fitting the NMR resonance intensities as a function of delay times to a single exponential decay using NMRViewJ. The expected intrinsic R2 rates for a completely unstructured protein were obtained by fitting the experimental R2 rates to the phenomenological model proposed by Schwalbe and coworkers (37).
Results
The I98A mutant of CTL9 adopts the same structure as wild-type CTL9 but undergoes cold denaturation above °C
Our previous thermodynamic studies indicated that replacing the hydrophobic core residue I98 in CTL9 by an alanine causes a decrease in ΔH0(Tm) and an increase in ΔCp0, thus the temperature of the mid point of cold denaturation increases accordingly (18). At pH values near 6.0 cold denaturation was observed at temperatures above 0 °C by both CD monitored temperature melting experiments and by NMR monitored melting studies (Figure 1B and 1C and supplementary materials). As shown in Figure 1C, resonances from both the native and denatured state can be detected at 25 °C. As the temperature decreases, the resonances of the cold denatured state increase while the peaks from the native state diminish gradually. Similar to the wild-type protein, the stability of I98A CTL9 is strongly dependent on pH due to the protonation of one or more of the three histidine side-chains (23). At pH 5.7, the cold denatured state is 79% populated at 12 °C, making NMR studies of the cold denatured state feasible. Thus, we chose pH 5.7, 12 °C as the experimental condition to explore the structural and dynamic properties of the cold denatured state of I98A CTL9.
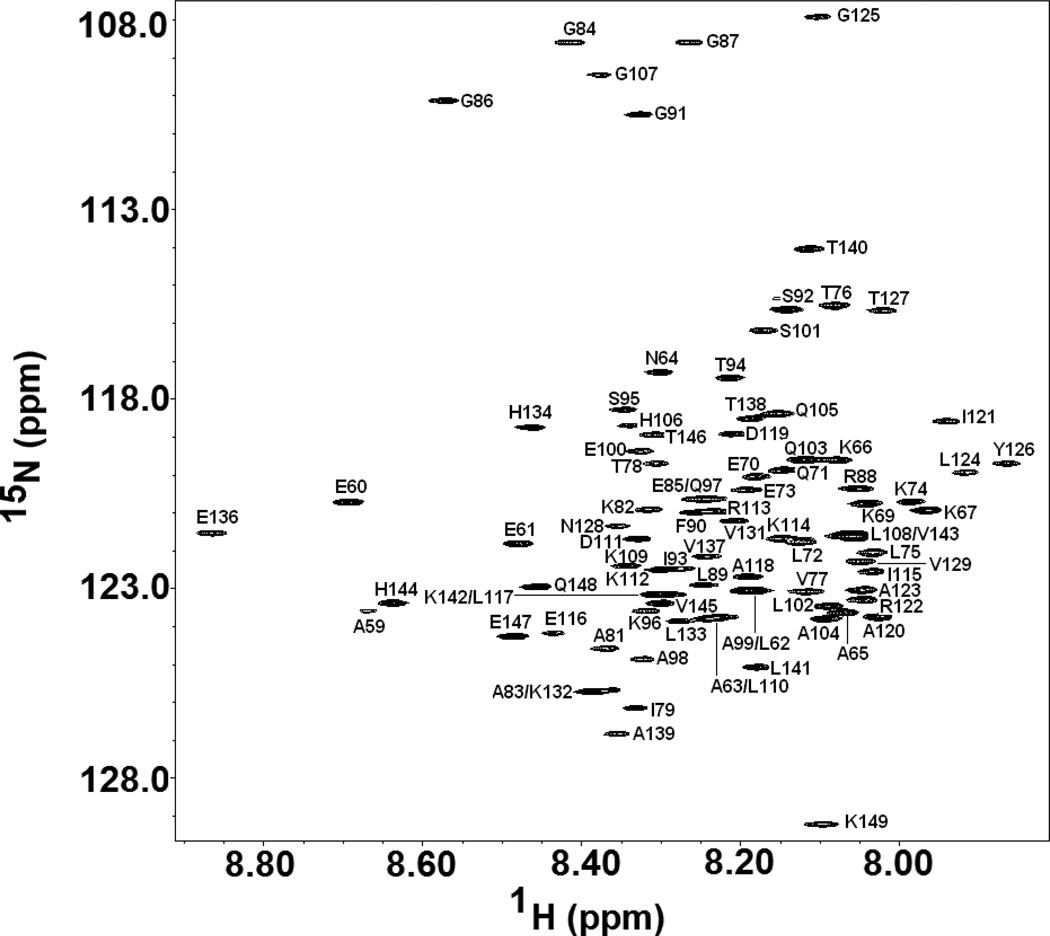
The HSQC spectrum of the cold denatured I98A CTL9 is typical for an unfolded protein (Figure 2), and one major set of peaks are observed, indicating that the cold denatured state is the dominant conformer, a result which is in agreement with the 1D NMR experiments. Peaks from the native state are observed at lower contour levels. All of the peaks are sharp as expected for a monomeric protein, which is not experiencing exchange broadening. We used pH jump fluorescence detected stopped flow measurements to directly measure the exchange rate at 12 °C (supplementary materials). The exchange rate, kex = kfolding +kunfolding is 0.49 sec−1, confirming that the system is in slow exchange on the chemical shift time scale. The folding rate is 8.8 × 10⁻² sec−1 amd the unfolding rate is 0.40 sec−1, corresponding to life times of 11 seconds amd 2.5 seconds for the cold denatured state and the native state, respectively.
Figure 2.
15N-HSQC spectrum of the cold denatured state of I98A CTL9 with the assignments indicated. The spectrum was recorded at pH 5.7, 12 °C.
Using triple resonance HNCACB, HNCO and HNCACO experiments, virtually complete backbone 13C, 1H and 15N assignments were obtained. Sidechain 1Hα and 1Hβ were also made using the HBHACONH experiment. The assignments have been deposited in the Biological Magnetic Resonance data Bank (BMRB).
Chemical shift analysis provides evidence of native and non-native secondary structure in the cold denatured state
Chemical shifts are valuable probes of protein structure because of the strong correlation between secondary chemical shifts, i.e., the deviations of observed chemical shifts from random coil chemical shifts, with protein structure. 13Cα and 13CO shifts are shifted downfield in α-helices and upfield in β-sheets, while the opposite trend is usually observed for 1Hα and 13Cβ shifts (38–40). The 13Cα, 13CO, 1Hα and 13Cβ secondary shifts of the cold denatured state of I98A CTL9 were calculated using the random coil values reported by Wishart (33). The data are presented in Table 1A and Figure S1. The various observed trends are broadly self-consistent, and indicate that the two α-helical regions (residues 58–74 and residues 95–106) in the native state have a strong tendency to form α-helical structure in the cold denatured state. In addition, the loop region which connects α-helix 2 and β-strand 2, i.e., residues 107–124 in the native state, also exhibits a clear trend to populate helical Φ and Ψ angles. This is of interest because it implies that non-native structure is formed.
Table 1.
| Table 1A. Average secondary shifts and SSP values in secondary structural elements of wild-type CTL9 at pH 5.7, 12 °C | ||||||
|---|---|---|---|---|---|---|
| 1Hα | 13Cα | 13Cβ | 13CO | 13Cα-13Cβ | SSP | |
| Helix 1 | −0.35 | 2.80 | −0.67 | 1.95 | 3.47 | 0.91 |
| Helix 2 | −0.28 | 2.91 | 0.70 | 1.90 | 2.21 | 0.78 |
| Loop | −0.09 | 0.88 | 0.67 | 0.08 | 0.21 | 0.09 |
| Strand 1 | 0.16 | −0.51 | 1.28 | −0.89 | −1.79 | −0.51 |
| Strand 2 | 0.50 | 0.04 | 1.57 | −0.98 | −1.53 | −0.42 |
| Strand 3 | 0.48 | −1.05 | 1.30 | −1.51 | −2.35 | −0.28 |
| Table 1B. Average secondary shifts and SSP values in secondary structural elements of I98A CTL9 at pH 5.7, 12 °C | ||||||
|---|---|---|---|---|---|---|
| 1Hα | 13Cα | 13Cβ | 13CO | 13Cα-13Cβ | SSP | |
| Helix 1 | −0.10 | 1.23 | −0.03 | 0.76 | 1.26 | 0.33 |
| Helix 2 | −0.08 | 0.96 | −0.05 | 0.83 | 1.01 | 0.25 |
| Loop | −0.08 | 0.87 | −0.04 | 0.43 | 0.91 | 0.20 |
| Strand 1 | −0.01 | 0.06 | 0.23 | −0.65 | −0.17 | −0.17 |
| Strand 2 | −0.03 | 0.27 | 0.23 | −0.83 | 0.04 | −0.18 |
| Strand 3 | −0.01 | 0.23 | 0.26 | −0.33 | −0.03 | 0.00 |
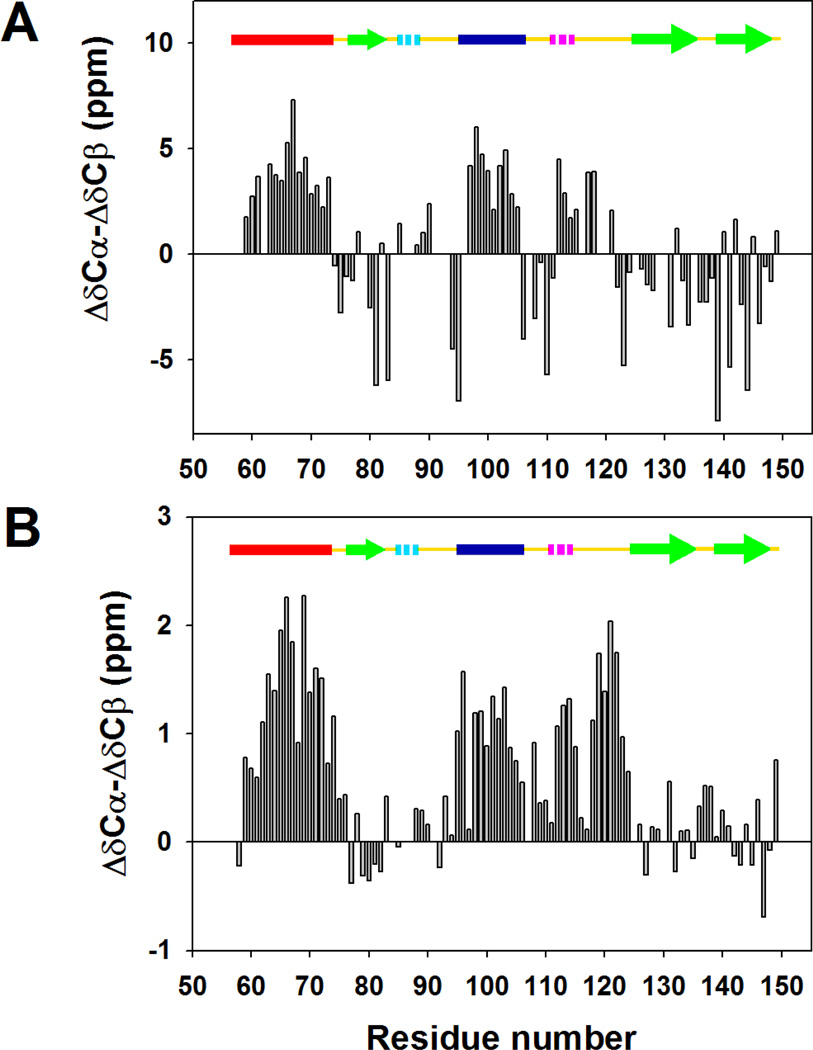
Individual secondary shifts are sensitive to protein secondary structure but their predictive value strongly depends on the choice of chemical shift standard. Combinations of secondary shift data can often provide a more accurate picture of the structural propensities for unfolded and partially unfolded proteins. We calculated the difference between 13Cα secondary shifts and 13Cβ secondary shifts, as plotted in Figure 3. The figure compares the ΔδCα-ΔδCβ values for the native state (Figure 3A) and the cold denatured state (Figure 3B). Positive ΔδCα-ΔδCβ values indicate α-helical structure and negative values indicate a propensity to adopt β-strand structure (34). Positive ΔδCα-ΔδCβ values are detected for the two helical regions as well as for the loop between α-helix 2 and β-strand 2, with average values of 1.26, 1.01 and 0.91, respectively. For comparison, the values for folded wild-type CTL9 under the same conditions are 3.47, 2.21 and 0.21 (Figure 3A and Table 1A), respectively. Negative ΔδCα-ΔδCβ values, with an average of −0.17, are observed in residues 78–82, which reside in the first β-strand in the native state, while the average is −1.79 in the wild-type CTL9 under the same conditions.
Figure 3.
Plots of the difference in the 13Cα secondary shifts and the 13Cβ secondary shifts for (A) The native state of wild-type CTL9, (B) the cold denatured state of I98A CTL9. Note that the scale is different in panel A and panel B. Assignments were obtained at pH 5.7, 12 °C. A schematic diagram of the elements of secondary structure of the native state of CTL9 is shown at the top of each panel, with solid bars, hashed bars, and open arrows indicating alpha-helix, 3–10 helix and beta-strand structure, respectively. The color coding corresponds to that used in Figure 1.
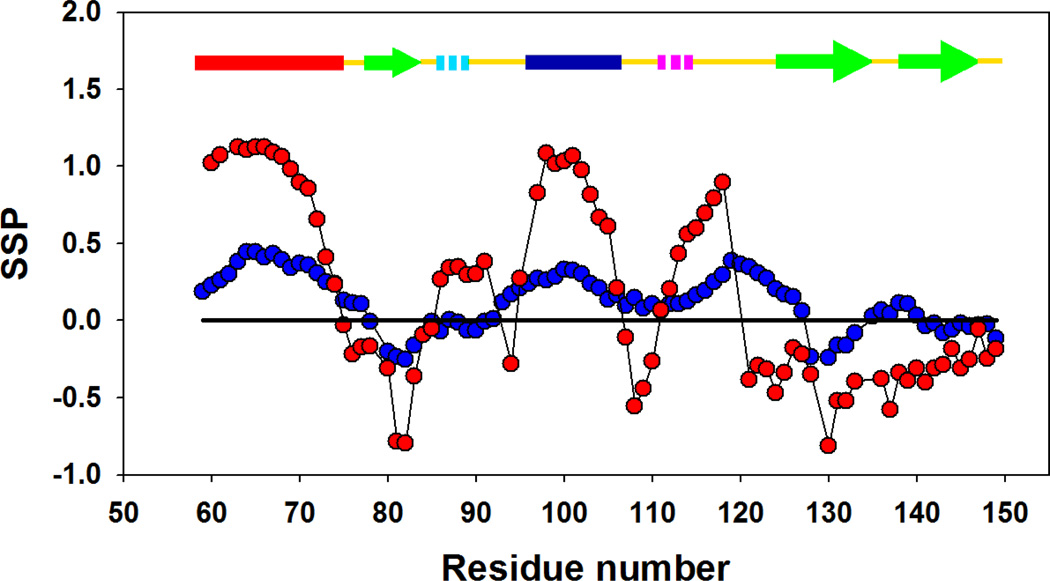
Forman-Kay and coworkers have developed the SSP (secondary structure propensity) algorithm to detect secondary structure propensities in partially unfolded and natively disordered proteins (34). The SSP score is the weighted average of the chemical shifts from different nuclei in a given residue, with the relative weighting reflecting the sensitivity of different secondary shifts to structure. A SSP score of 1.0 suggests a fully formed α-helix, while a value of −1.0 suggests a fully formed β-strand. Figure 4 displays the SSP scores of the cold denatured state of I98A at pH 5.7, 12 °C and those of the wild-type CTL9 under the same conditions. Although the SSP algorithm was developed for the analysis of secondary structure in non-native protein conformations, the SSP values for wild-type CTL9 clearly reflect the native secondary structure of the protein (Table 1A), consistent with the wild-type protein being well folded under these conditions. The cold denatured state of I98A, in comparison, is less structured and as expected, exhibits SSP scores with much smaller amplitude. Nevertheless, some obvious structural trends are detected. Positive values are observed for α-helix 1 and α-helix 2. The average is 0. 33±0.08 for α-helix 1 and 0.25±0.06 for α-helix 2. Large positive SSP scores are also found in the region which connects α-helix 2 and β-strand 2 (residues 107–124), with an average of 0.20±0.11. For comparison, the values for folded state of the wild-type CTL9 are 0.91±0.28, 0.78±0.31 and 0.09±0.50 respectively. Negative SSP scores are observed in the cold denatured state for residues 78–83 and residues 128–133, which are located in the first and second β-strand respectively, in the native state,. The average SSP values for these two segments are −0.17±0.10 and −0.18±0.06. The corresponding values for folded wild-type CTL9 are −0.51±0.32 and −0.42±0.20 under the same conditions. Fractional SSP values are normally interpreted in terms of fractional populations of secondary structures. However, the estimates of secondary structure do not have to agree with those obtained from CD because of the ways the respective spectroscopic signals depend on structure. NMR secondary shifts are primarily local in origin, and a residue which populates the helical region of the ϕ–ψ map will have helical secondary shifts. In contrast, there is length dependence to the CD signal of α-helices with the rotational strength (intensity) of the spectrum falling off for short helices. Thus, the CD spectrum of a system which has a tendency to transiently populate short helical segments may suggest, incorrectly, that there is a very low helical content while an NMR secondary shift analysis, (such as the SSP analysis), indicates a higher level of structure. The estimated fractional helical content of the cold unfolded derived from the SSP analysis is 0.13. This can be compared to that estimated from the mean residue ellipticity at 222 nm. The observed CD signal is the sum of the signal from the folded and cold denatured states. An estimate of the signal due to the cold folded state can be obtained from the measured fractional populations and the known ellipticity of the fully folded state (supplementary information). Using −11,200 deg cm−1 dmol−1 for the ellipticity of the folded state and a fractional population of 0.21 for the folded state yields a value of −4230 deg cm−1 dmol−1 for the mean residue ellipticity at 222 nm for the cold unfolded state at 12 °C. This corresponds to an estimated apparent fraction helix of ranging from 6 to 12 %. The two values reflect the choice for the expected ellipticity of a fully unfolded state with no helical structure. The larger value results if the empirical relationship proposed by Baldwin and coworkers (41) is used for the non-helical value and the smaller estimate is obtained if the actual ellipticity of CTL9 under strongly denaturing conditions is used, (pH 2 8M urea). In any case, the estimated helical content obtained from CD is in reasonable agreement with that obtained via the SPP analysis This is consistent with the notation that that the helical structure detected by the chemical shift analysis corresponds to segments of the chain in which consecutive residues adopt helical conformations. NOE measurements, described in subsequent subsections, are consistent with this interpretation. The SSP analysis is in excellent agreement with the secondary shifts analysis, which argues that the cold denatured state of I98A CTL9 contains both native like and non-native α-helical as well as a tendency to sample native like β-strand or extended structures.
Figure 4.
SSP analysis of wild-type CTL9 ( ) and I98A CTL9 (
 ) at pH 5.7, 12 °C. A schematic diagram of the elements of secondary structure of the native state of CTL9 is shown at the top of each panel.
Residual dipolar couplings confirm α-helical secondary structure in the cold denatured state
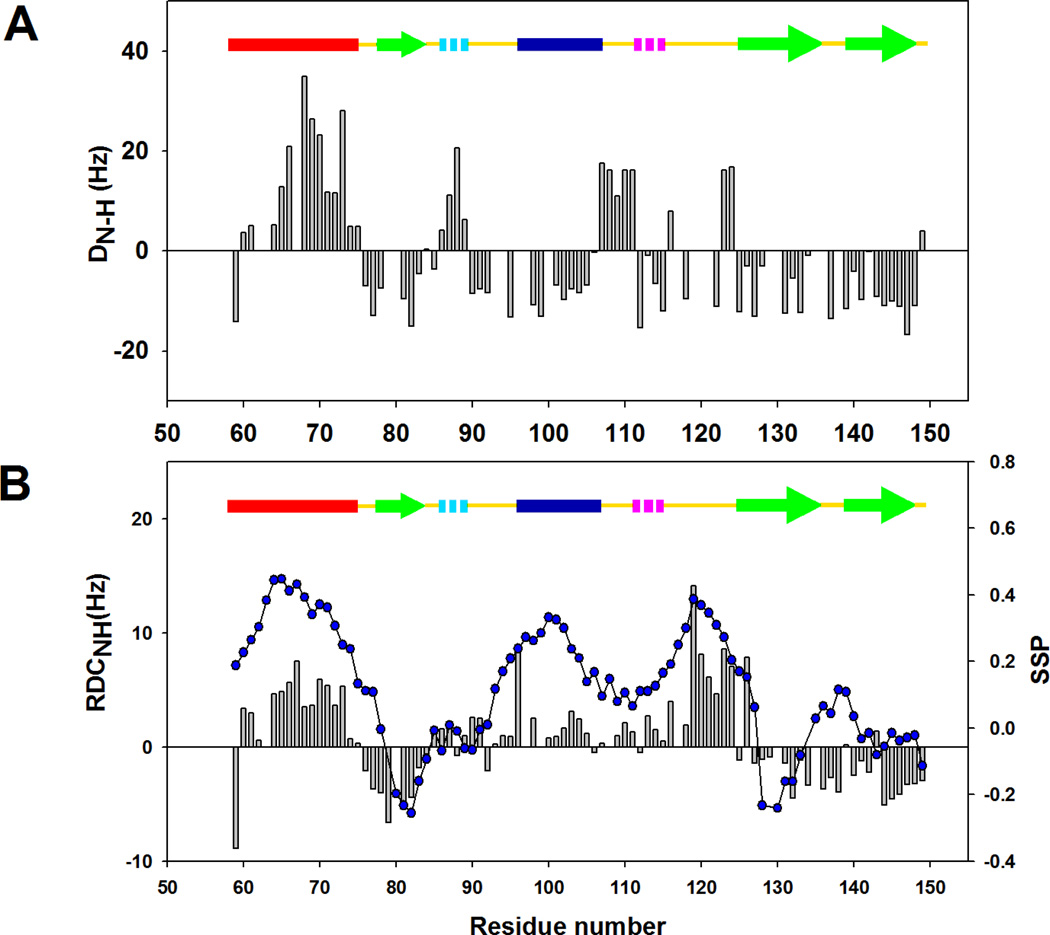
Residual dipolar couplings (RDC) are playing an increasingly important role in structural determination of macromolecules (42–43). For well folded globular proteins, the magnitude and sign of the RDCs depend on the orientation of the bond vectors relative to the alignment tensor of the entire molecule. In contrast, unfolded proteins generally can not be described by a global alignment tensor. Instead, the polypeptide chain can be viewed as behaving like a collection of short segments of polypeptide in which each short segment transiently aligns relative to the external magnetic field. The length of the segment, often termed the persistence length, reflects the number of amino acid residues within which the polypeptide chain has a correlated orientation. Previous work has suggested that the NH bond vectors adopt alignments that are approximately perpendicular for α-helical and β-strand or extended structure. Thus the NH RDCs in independently aligning α-helices and β-strand have opposite signs since the NH vector is aligned parallel to the long axis of an α-helix but perpendicular to the long axis of a β-strand (44–47). As a result, NH RDCs can report on residual secondary structure in unfolded proteins. In contrast, the RDCs of highly unfolded proteins usually have the same sign. Recent work has shown that RDCs for denatured states with little or no residual structure can be reasonably well predicted using ensembles constructed from dihedral angle choices derived from certain regions of protein structure contained in the protein data bank (48–49). The predicted RDCs are dominated by those that come from highly extended conformations, since these align most strongly with the field and thus explain the observation that highly unfolded proteins exhibit strong RDCs with mostly the same sign. If there is local residual structure such as helices in an otherwise extended polypeptide, then the alignment of the NH bond vectors in the helical segments will tend to be perpendicular to that of the NH bond vectors in the extended regions. Irrespective of whether one wishes to describe this as local alignment of persistence-length segments or alignment of highly extended conformations, the end result is that RDCs are well suited for probing residual structure, and especially residual helical structure, in unfolded proteins. In the current study, NH RDCs of the cold denatured state of I98A CTL9 were measured in weakly aligned bicelles. The HSQC spectrum obtained in the bicelle media (data not shown) are identical to those collected in isotropic solution, indicating that the alignment media does not significantly perturb the conformation. Figure 5A displays the NH RDCs measured for the wild-type CTL9 at pH 5.7, 12 °C. Although the globular wild-type protein aligns in the bicelle medium as a rigid structure, one can note that the NH RDCs are positive for α-helix 1 and negative in α-helix 2, consistent with the native structure in which the two helices are oriented perpendicular to each other. All of the NH RDCs are of the same sign (negative) in the β-strand regions, consistent with the β-strands being oriented either parallel or anti-parallel to each other. Thus, the RDC data of the native state of CTL9 agree qualitatively with the crystal structure. The NH-RDCs for the cold denatured state of I98A CTL9 are plotted in Figure 5B. The segments which are predicted to populate α-helical structure based on the chemical shift analysis, including the loop connecting α-helix 2 and β-strand 2, exhibit RDCs which have opposite signs relative to the β-strand regions or extended regions. The three β-strand segments display negative RDCs. It is worth noting that β-strand 3 (residues 138–147) displays significant negative RDCs in the cold denatured state in spite of the small SSP scores in this region. A plausible explanation is that the alignment of the NH vectors is similar in both β-strands and extended structure in unfolded proteins (44). Other than the β-strand 3 region, the pattern of the RDC data is in excellent agreement with the SSP scores and the RDC data offer additional evidence that there is significant helical structure in the cold denatured state. It is noteworthy that all RDCs have much smaller amplitude in the cold denatured state than in the native state. Since the experimentally measured RDCs are population weighted averages of an ensemble of conformations, the small magnitudes of the RDC reveal that the residual secondary structure in the cold denatured state is only partially developed. Note that the measured RDCs for the cold denatured state do not include any contributions from averaging from the native structure since the native and the cold denatured states are in slow exchange.
Figure 5.
Residual dipolar couplings for CTL9 and the I98A mutant. Measurements were made at pH 5.7, 12 °C. (A) Plot of DNH for the wild-type CTL9 versus residue numner. (B) Plot of DNH (black bars) and SSP scores ( ) for I98A CTL9 versus residue number. A schematic diagram of the elements of secondary structure of the native state of CTL9 is shown at the top of each panel.
Amide proton NOEs are consistent with native like structure in the cold denatured state
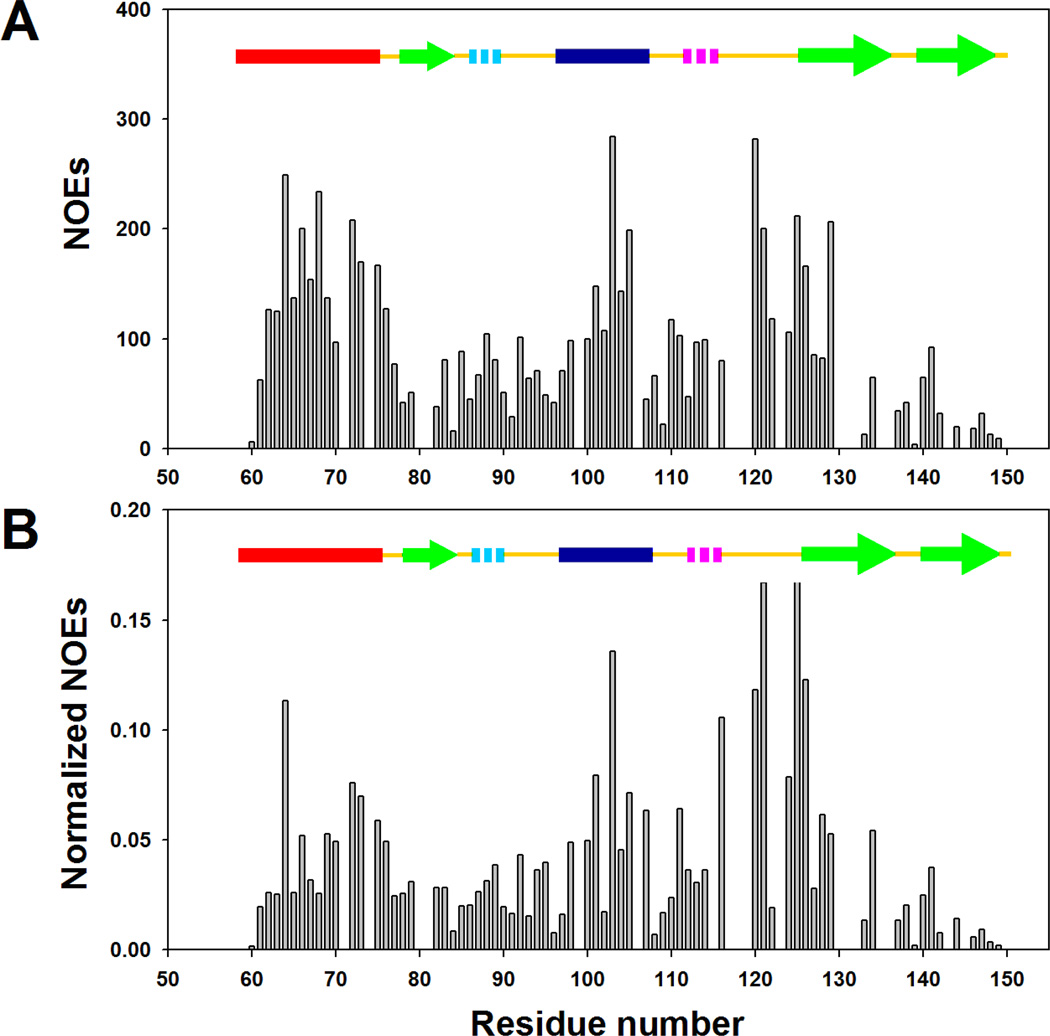
Proton NOEs provide valuable structural probes: Short-range and medium range NOEs are widely used to delineate protein secondary structure and long-range NOEs are particularly useful for defining the global topology of proteins (50). However, measurements of NOEs in unfolded proteins are quite difficult due to the flexible nature of the polypeptide chain in the unfolded state ensemble and the high degeneracy of the resonances. Nevertheless, sufficient spectral resolution can be obtained using the 15N-HSQC-NOESY-HSQC experiment, provided that the population of a conformation with a defined secondary structure is high enough. Sequential amide proton NOEs, which are often used to distinguish α-helices (stronger NOEs) from β-strand and extended structure (weaker or absent NOEs), are detected throughout the protein in the cold denatured state (Figure 6A and 6B). The two α-helical regions as well as the loop region connecting α-helix 2 and β-strand 2, display sequential amide NOEs which have higher intensities than the NOEs observed for other segments of the polypeptide chain. The average intensities of the normalized NOEs are 1.7 times as large in these three regions as those observed for other residues. Thus, the observed NOEs are consistent with the chemical shift and RDC measurements.
Figure 6.
Summary of NOEs observed for I98A CTL9 at pH 5.7, 12 °C. (A) Plot of the volume of the sequential amide proton NOEs versus residue number. (B) Plot of normalized sequential amide proton NOEs versus residue numner. Peak volumes are normalized as the ratio of observed dNN(i,i+1) NOE crosspeaks to the diagonal peaks.
Because a low population of native state I98A CTL9 is present under our conditions, the possibility exists that some of the observed NOEs could in fact be transferred from this native state population. Transferred NOE experiments are typically measured for systems in fast exchange (51–52), but can also be observed for proteins in slow exchange (53–55). In the present case the NOE mixing time was 300 milliseconds and the measured exchange rate between the cold denatured state and the native state is 0.49 sec−1, and the calculated life times are 2.5 seconds for the folded state and 11 seconds for the cold denatured state. In principle, some degree of NOE transfer could potentially contribute to the measured data. However, the observation of strong NOEs for residues 120–126, a region with no regular secondary structure in the native state of the protein, suggests that the major contribution to the observed NOEs is from the cold denatured state. In addition, the data are consistent with the chemical shift and RDC data, and those measurements are not affected under conditions of slow exchange.
15N transverse relaxation rate analysis of the cold denatured state
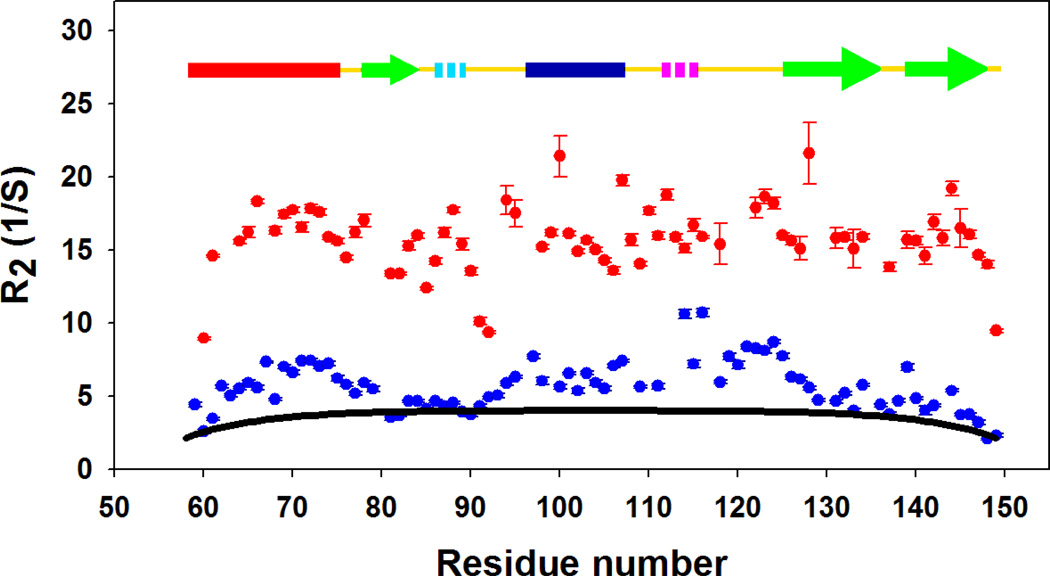
Relaxation rate measurements have been widely used to study the structure and dynamics of unfolded proteins (56–57). Transverse 15N relaxation rates (R2) are particularly useful because they are very sensitive probes of deviations from random coil behavior in unfolded proteins. For a completely unstructured peptide with only local interactions, the 15N R2 relaxation rates are expected to be uniform in the center of the polypeptide chain and slightly smaller at the ends (37, 58). The observation of significantly larger R2 rates is thought to reflect the formation of local residual structure such as hydrophobic clusters (37–38, 58–59). Figure 7 plots the measured relaxation rates for wild type CTL9 and I98A CTL9 at 12 °C, and the relaxation rates calculated based on the Schwalbe phenomenological model (37). The slow exchange between the folded and the cold denatured state will not affect the measured R2 rates. The calculated relaxation rates follow the expected inverted U-shaped profile. The fit yields an apparent persistence length of 8 residues, which is consistent with previous estimates (60) and supports the analysis of the RDC data. Not surprisingly, the native state displays large systematic deviations from the values calculated using the Schwalbe random coil model. The 15N relaxation rates for the cold denatured state exhibit smaller but still significant positive deviations from the random coil model. In particular, the largest deviations are found in the two α-helical regions as well as in the loop connecting α-helix 2 and β-strand 2. No significant deviations from the model random coil relaxation rates are found in the β-strand regions, suggesting that the α-helical structure is better formed in the cold denatured state than the β-strand structure.
Figure 7.
Plots of 15N R2 relaxation rates for wild-type CTL9 ( ) and the cold denatured state of I98A CTL9 (
 ). The black solid line (−) is the best fit to the phenomenological model of Schwalbe and coworkers. Data was collected at 12°C for both proteins.
Discussion
Studies of the cold denatured state have often relied on special conditions such as addition of denaturants, high pressure, encapsulation, emulsified samples or extremes of pH, under which the structural and dynamic properties of the protein may be perturbed. Nevertheless these investigations have provided valuable information about unfolded proteins. There have also been a few reported studies of cold denaturation under near native conditions (5, 21, 61–62), The current study provides a detailed residue specific characterization of the cold denatured state of a protein under near physiological conditions. We have obtained essentially complete 1H, 13C and 15N backbone assignments as well as 13Cβ and 1Hβ sidechain assignments for the cold denatured state of I98A CTL9 at pH 5.7 and 12 °C. The chemical shift analysis, NOE analysis, RDC data and transverse relaxation rates all yield a consistent picture. Residues in the two α-helical regions in the native state have a strong tendency to sample the α-helical region of the Ramachandran plot. Residues 107–124, which form a short 310 helix and the connecting loop linking α-helix 2 and β-strand 2 in the native state, also preferentially form α-helical structure in the cold denatured state. The R2 values for each of these three segments exhibit deviations from the phenomenological model for R2 values in fully unfolded states.
Previous studies of the structure of cold denatured states, particularly pressure dependent studies, have suggested that cold denatured states either contain significant residual structure, that often mimics early intermediates that are populated during the kinetic refolding pathway, or are largely unstructured (12, 63–65). The cold denatured state of CTL9 exhibits behavior intermediate between these two extremes. The folding of CTL9 has been well documented to be two-state. The work presented here provides additional evidence that the protein folds from a state which contains significant residual secondary structure
The observed secondary structure and the deviations of the R2 values from the random coil model are consistent with previous hydrodynamic measurements, which have demonstrated that the cold denatured state of the I98A mutant is more compact than the highly denatured pH 2.0 state or the urea denatured state of the wild-type (18). NMR characterization of the acid denatured state and the urea denatured state revealed that significantly less residual structure is present.
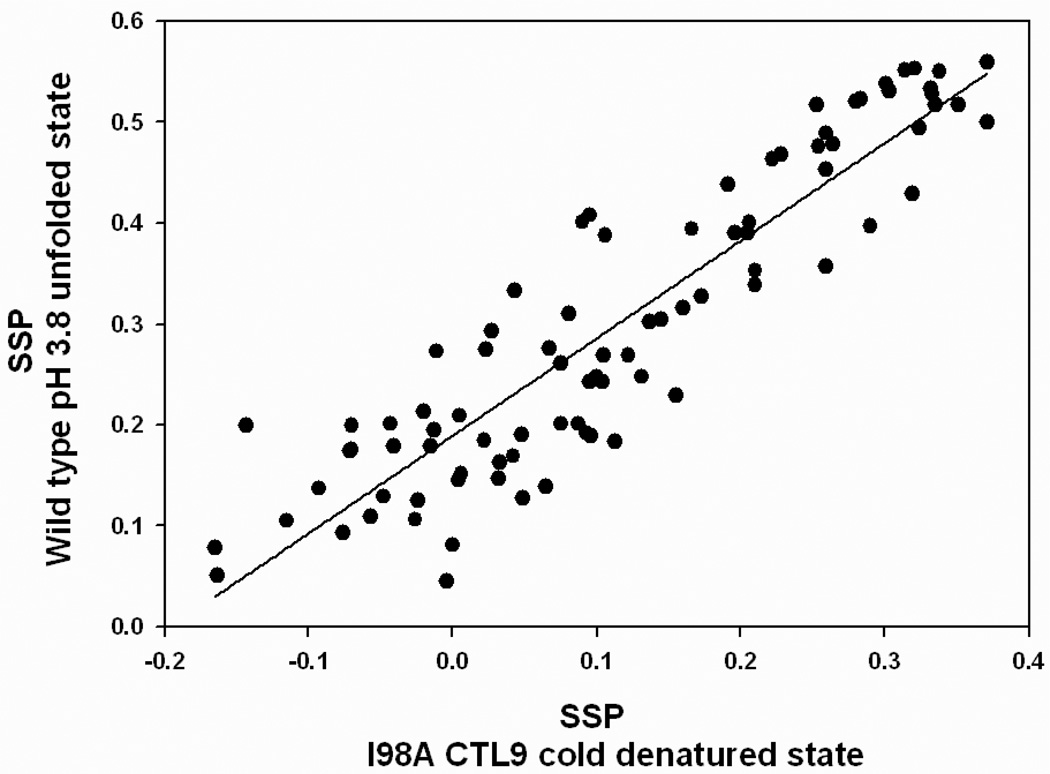
The cold denatured state of the I98A mutant is more similar to the pH 3.8 unfolded state of wild type CTL9: both are compact and both contain native and non-native secondary structure in the same regions of the chain. Indeed, there is a strong correlation between the SSP scores of these two unfolded states, with a r2 value of 0.84 (p-value<10−4) (Figure 8). The similarity between these two unfolded states of CTL9 strongly suggest that the residual structure observed is robust and is not an artifact of the conditions used to populate the unfolded states. It is difficult to detect experimentally when a mutation alters the unfolded state structure or energetics, but the observation of similar helical structural propensities in the cold denatured state of the I98A mutant and the pH 3.8 unfolded state of the wild-type (60) argues that the isoleucine to alanine mutation at residue 98 may have little impact on the unfolded state of CTL9. Thus the native and non-native structure observed in the I98A mutant is highly likely to be formed in the unfolded state which is populated under refolding conditions.
Figure 8.
Comparison of the SSP scores determined for the pH 3.8 unfolded state of wild type CTL9 with those determined for the cold denatured state of I98A CTL9. The SSP scores for the pH 3.8 unfolded state were previously reported (60).
Nascent residual structure in the unfolded state can reduce the conformational search in the early stages of protein folding. As a consequence, structural information about the unfolded state of CTL9 may have important implications for the folding of this protein (17). A previously reported φ-value analysis of the transition state for the folding of CTL9 revealed small φ-values for the α-helices and somewhat larger but still modest φ-values in β-strand 2, β-strand 3 and the loop which connects the two strands (66). φ-value analysis 1reports on the development of interactions in the transition state relative to the unfolded state and given the significant helical structure in the unfolded state of CTL9, the transition state for the folding of CTL9 likely contains significant helical structure as well. One should also bear in mind that a mutation which destabilizes the unfolded state may decrease the φ-value relative to the value which would be measured for the case where the mutation does not affect unfolded state energetics (67).
Supplementary Material
Acknowledgements
This work was supported by NIH grants GM070941 and NSF MCB0919860 (DPR), AG019391 and AG025440 (DE) and NS058137 (SM), and by the Irma T. Hirschl Foundation and a gift from Herbert and Ann Siegel (DE). DPR and DE are members of the New York Structural Biology Center, which is a STAR center supported by the New York State Office of Science, Technology and Academic Research, by NIH grant P41 GM66354, and which received funds from NIH, USA, the Keck Foundation, New York State, and the NYC Economic Development Corporation for the purchase of 900 MHz spectrometers. We thank Dr. Shibani Bhattacharya and Mr. Mark W. Maciejewski for help with NMR experiments and Mr. Wenli Meng for comments on the manuscript. Prof. Jeff Hoch is greatly appreciated for generously providing NMR time at the NMR facility at the University of Connecticut Health Center.
Abbreviations used
- CTL9
the C-terminal domain of the ribosomal protein L9
- I98A CTL9
the isoleucine to alanine point mutant of CLT9 at residue 98
- NOE
nuclear overhauser effect
- PFG NMR
pulsed-field gradient nuclear magnetic resonance
- RDC
residual dipolar coupling
- SSP
secondary structure propensity
Footnotes
Supporting Information Available
A plot of CD detected thermal unfolding curves for I98A CTL9 at different pH values; a plot of the fluorescence detected stopped-flow pH jump experiment, and plots of 13Cα, 13Cβ, 13CO and 1Hα secondary shifts for the cold denatured state of I98A CTL9 at pH 5.7, 12 °C. This material is available free of charge via the Internet at http://pubs.acs.org.
References
- 1.Clark JH. J. Gen. Physiol. 1945;28:539–545. doi: 10.1085/jgp.28.6.539. [DOI] [PMC free article] [PubMed] [Google Scholar]
- 2.Brandts JF. J.Am.Chem.Soc. 1964;86:4291–4301. [Google Scholar]
- 3.Privalov PL. Crit. Rev. Biochem. Mol. Biol. 1990;25:281–305. doi: 10.3109/10409239009090612. [DOI] [PubMed] [Google Scholar]
- 4.Privalov PL, Gill SJ. Adv. Protein Chem. 1988;39:191–234. doi: 10.1016/s0065-3233(08)60377-0. [DOI] [PubMed] [Google Scholar]
- 5.Sanfelice D, Tancredi T, Politou A, Pastore A, Temussi PA. J. Am. Chem. Soc. 2009;131:11662–11663. doi: 10.1021/ja904462n. [DOI] [PubMed] [Google Scholar]
- 6.Martin SR, Esposito V, Rios PDL, Pastore A, Temussi PA. J. Am. Chem. Soc. 2008;130:9963–9970. doi: 10.1021/ja803280e. [DOI] [PubMed] [Google Scholar]
- 7.Lonhienne T, Gerday C, Feller G. Biochim. Biophys. Acta. 2000;1543:1–10. doi: 10.1016/s0167-4838(00)00210-7. [DOI] [PubMed] [Google Scholar]
- 8.Feller G, Gerday C. Nat. Rev. Microbiol. 2003;1:200–208. doi: 10.1038/nrmicro773. [DOI] [PubMed] [Google Scholar]
- 9.Van Horn WD, Simorellis AK, Flynn PF. J. Am. Chem. Soc. 2005;127:13553–13560. doi: 10.1021/ja052805i. [DOI] [PubMed] [Google Scholar]
- 10.Babu CR, Hilser VJ, Wand AJ. Nat. Struct. Mol. Biol. 2004;11:352–357. doi: 10.1038/nsmb739. [DOI] [PubMed] [Google Scholar]
- 11.Pometun MS, Peterson RW, Babu CR, Wand AJ. J. Am. Chem. Soc. 2006;128:10652–10653. doi: 10.1021/ja0628654. [DOI] [PMC free article] [PubMed] [Google Scholar]
- 12.Jonas J. Biochim. Biophys. Acta. 2002;1595:145–159. doi: 10.1016/s0167-4838(01)00341-7. [DOI] [PubMed] [Google Scholar]
- 13.Kunugi S, Tanaka N. Biochim. Biophys. Acta. 2002;1595:329–344. doi: 10.1016/s0167-4838(01)00354-5. [DOI] [PubMed] [Google Scholar]
- 14.Kitahara R, Okuno A, Kato M, Taniguchi Y, Yokoyarnal S, Akasaka K. Magn.Reson. Chem. 2006;44:S108–S113. doi: 10.1002/mrc.1820. [DOI] [PubMed] [Google Scholar]
- 15.Davidovic M, Mattea C, Qvist J, Halle B. J. Am. Chem. Soc. 2009;131:1025–1036. doi: 10.1021/ja8056419. [DOI] [PubMed] [Google Scholar]
- 16.Privalov PL, Griko YV, Venyaminov SY, Kutyshenko VP. J. Mol. Biol. 1986;190:487–498. doi: 10.1016/0022-2836(86)90017-3. [DOI] [PubMed] [Google Scholar]
- 17.Wong KB, Freund SMV, Fersht AR. J. Mol. Biol. 1996;259:805–818. doi: 10.1006/jmbi.1996.0359. [DOI] [PubMed] [Google Scholar]
- 18.Li Y, Shan B, Raleigh DP. J. Mol. Biol. 2007;368:256–262. doi: 10.1016/j.jmb.2007.02.011. [DOI] [PubMed] [Google Scholar]
- 19.Van Horn WD, Ogilvie ME, Flynn PF. J. Am. Chem. Soc. 2009;131:8030–8039. doi: 10.1021/ja901871n. [DOI] [PubMed] [Google Scholar]
- 20.Simorellis AK, Van Horn WD, Flynn PF. J. Am. Chem. Soc. 2006;128:5082–5090. doi: 10.1021/ja0568401. [DOI] [PubMed] [Google Scholar]
- 21.Pastore A, Martin SR, Politou A, Kondapalli KC, Stemmler T, Temussi PA. J. Am. Chem. Soc. 2007;129:5374–5375. doi: 10.1021/ja0714538. [DOI] [PMC free article] [PubMed] [Google Scholar]
- 22.Hoffman DW, Cameron CS, Davies C, White SW, Ramakrishnan V. J. Mol. Biol. 1996;264:1058–1071. doi: 10.1006/jmbi.1996.0696. [DOI] [PubMed] [Google Scholar]
- 23.Sato S, Raleigh DP. J. Mol. Biol. 2002;318:571–582. doi: 10.1016/S0022-2836(02)00015-3. [DOI] [PubMed] [Google Scholar]
- 24.Shan B, Bhattacharya S, Eliezer D, Raleigh DP. Biochemistry. 2008;47:9565–9573. doi: 10.1021/bi8006862. [DOI] [PMC free article] [PubMed] [Google Scholar]
- 25.Grzesiek S, Bax A. J. Magn. Reson. 1992;96:432–440. [Google Scholar]
- 26.Kay LE, Xu GY, Yamazaki T. J. Magn. Reson. A. 1994;109:129–133. [Google Scholar]
- 27.Clubb RT, Thanabal V, Wagner T. J. Magn. Reson. 1992;97:213–217. [Google Scholar]
- 28.Wittekind M, Mueller L. J. Magn. Reson. B. 1993;101:201–205. [Google Scholar]
- 29.Muhandiram DR, Kay LE. J. Magn. Reson. B. 1994;103:203–216. [Google Scholar]
- 30.Grzesiek S, Bax A. J. Biomol. NMR. 1993;3:185–204. doi: 10.1007/BF00178261. [DOI] [PubMed] [Google Scholar]
- 31.Delaglio F, Grzesiek S, Vuister GW, Zhu G, Pfeifer J, Bax A. J. Biomol. NMR. 1995;6:277–293. doi: 10.1007/BF00197809. [DOI] [PubMed] [Google Scholar]
- 32.Johnson BA. Methods Mol. Biol. 2004;278:313–352. doi: 10.1385/1-59259-809-9:313. [DOI] [PubMed] [Google Scholar]
- 33.Wishart DS, Bigam CG, Holm A, Hodges RS, Sykes BD. J. Biomol. NMR. 1995;5:67–81. doi: 10.1007/BF00227471. [DOI] [PubMed] [Google Scholar]
- 34.Marsh JA, Singh VK, Jia Z, Forman-Kay JD. Protein Sci. 2006;15:2795–2804. doi: 10.1110/ps.062465306. [DOI] [PMC free article] [PubMed] [Google Scholar]
- 35.Ottiger M, Delaglio F, Bax A. J. Magn. Reson. 1998;131:373–378. doi: 10.1006/jmre.1998.1361. [DOI] [PubMed] [Google Scholar]
- 36.Farrow NA, Zhang O, Forman-Kay JD, Kay LE. Biochemistry. 1995;34:868–878. doi: 10.1021/bi00003a021. [DOI] [PubMed] [Google Scholar]
- 37.Schwalbe H, Fiebig KM, Buck M, Jones JA, Grimshaw SB, Spencer A, Glaser SJ, Smith LJ, Dobson CM. Biochemistry. 1997;36:8977–8991. doi: 10.1021/bi970049q. [DOI] [PubMed] [Google Scholar]
- 38.Eliezer D. Methods Mol. Biol. 2007;350:49–67. doi: 10.1385/1-59745-189-4:49. [DOI] [PMC free article] [PubMed] [Google Scholar]
- 39.Spera S, Bax A. J. Am. Chem. Soc. 1991;112:5490–5492. [Google Scholar]
- 40.Wishart DS, Sykes BD, Richards FM. J. Mol. Biol. 1991;22:311–333. doi: 10.1016/0022-2836(91)90214-q. [DOI] [PubMed] [Google Scholar]
- 41.Luo P, Baldwin RL. Biochemistry. 1997;36:8413–8421. doi: 10.1021/bi9707133. [DOI] [PubMed] [Google Scholar]
- 42.Tjandra N, Bax A. Science. 1997;278:1111–1114. doi: 10.1126/science.278.5340.1111. [DOI] [PubMed] [Google Scholar]
- 43.Tolman JR, Flanagan JM, Kennedy MA, Prestegard JH. Proc. Natl. Acad. Sci. U. S. A. 1995;92:9279–9283. doi: 10.1073/pnas.92.20.9279. [DOI] [PMC free article] [PubMed] [Google Scholar]
- 44.Mohana-Borges R, Goto NK, Kroon GJA, Dyson HJ, Wright PE. J. Mol. Biol. 2004;340:1131–1142. doi: 10.1016/j.jmb.2004.05.022. [DOI] [PubMed] [Google Scholar]
- 45.Louhivuori M, Paakkonen K, Fredriksson K, Permi P, Lounila J, Annila A. J. Am. Chem. Soc. 2003;125:15647–15650. doi: 10.1021/ja035427v. [DOI] [PubMed] [Google Scholar]
- 46.Ohnishi S, Lee AL, Edgell MH, Shortle D. Biochemistry. 2004;43:4064–4070. doi: 10.1021/bi049879b. [DOI] [PubMed] [Google Scholar]
- 47.Ohnishi S, Shortle D. Proteins. 2004;50:546–551. doi: 10.1002/prot.10327. [DOI] [PubMed] [Google Scholar]
- 48.Jha AK, Colubri A, Freed KF, Sosnick TR. Proc. Natl. Acad. Sci. U. S. A. 2005;102:13099–13104. doi: 10.1073/pnas.0506078102. [DOI] [PMC free article] [PubMed] [Google Scholar]
- 49.Bernado P, Blanchard L, Timmins P, Marion D, Ruigrok RWH, Blackledge M. Proc. Natl. Acad. Sci. U. S. A. 2005;102:17002–17007. doi: 10.1073/pnas.0506202102. [DOI] [PMC free article] [PubMed] [Google Scholar]
- 50.Wuthrich K. NMR of proteins and nucleic acids. New York: John Wiley & Sons Inc.; 1986. [Google Scholar]
- 51.Clore GM, Gronenborn AM. J. Magn. Reson. 1983;53:423–442. [Google Scholar]
- 52.Post CB. Curr. Opin. Struct. Biol. 2003;13:581–588. doi: 10.1016/j.sbi.2003.09.012. [DOI] [PubMed] [Google Scholar]
- 53.Bodner CR, Dobson CM, Bax A. J. Mol. Biol. 2009;390:775–790. doi: 10.1016/j.jmb.2009.05.066. [DOI] [PMC free article] [PubMed] [Google Scholar]
- 54.Mok YK, Kay CM, Kay LE, Forman-Kay JD. J. Mol. Biol. 1999;289:619–638. doi: 10.1006/jmbi.1999.2769. [DOI] [PubMed] [Google Scholar]
- 55.Mok YK, Kay CM, Kay LE, Forman-Kay JD. J. Mol. Biol. 2003;329:185–187. [Google Scholar]
- 56.Palmer AG. Curr. Opin. Struct. Biol. 1997;7:732–737. doi: 10.1016/s0959-440x(97)80085-1. [DOI] [PubMed] [Google Scholar]
- 57.Kay LE. Nat. Struct. Biol. 1998;5:513–517. doi: 10.1038/755. [DOI] [PubMed] [Google Scholar]
- 58.Klein-Seetharaman J, Oikawa M, Grimshaw SB, Wirmer J, Duchardt E, Ueda T, Imoto T, Smith LJ, Dobson CM, Schwalbe H. Science. 2002;295:1719–1722. doi: 10.1126/science.1067680. [DOI] [PubMed] [Google Scholar]
- 59.Platt GW, McParland VJ, Kalverda AP, Homans SW, Radford SE. J. Mol. Biol. 2005;346:279–294. doi: 10.1016/j.jmb.2004.11.035. [DOI] [PubMed] [Google Scholar]
- 60.Shan B, Eliezer D, Raleigh DP. Biochemistry. 2009;48:4707–4719. doi: 10.1021/bi802299j. [DOI] [PMC free article] [PubMed] [Google Scholar]
- 61.Antonino LC, Kautz RA, Nakano T, Fox RO, Fink AL. Proc. Natl. Acad. Sci. U. S. A. 1991;88:7715–7718. doi: 10.1073/pnas.88.17.7715. [DOI] [PMC free article] [PubMed] [Google Scholar]
- 62.Szyperski T, Mills JL, Perl D, Balbach J. Eur. Biophys. J. 2006;35:363–366. doi: 10.1007/s00249-005-0028-4. [DOI] [PubMed] [Google Scholar]
- 63.Jonas J, Jonas A. Annu.Rev. Biophys. Biomol. Struct. 1994;23:287–318. doi: 10.1146/annurev.bb.23.060194.001443. [DOI] [PubMed] [Google Scholar]
- 64.Jonas J. ACS Symp. S. 1997;676:310–323. [Google Scholar]
- 65.Jonas J, Ballard L, Nash D. Biophys. J. 1998;75:445–452. doi: 10.1016/S0006-3495(98)77532-0. [DOI] [PMC free article] [PubMed] [Google Scholar]
- 66.Li Y, Gupta R, Cho JH, Raleigh DP. Biochemistry. 2007;46:1013–1021. doi: 10.1021/bi061516j. [DOI] [PubMed] [Google Scholar]
- 67.Cho JH, Raleigh DP. J. Am. Chem. Soc. 2006;128:16492–16493. doi: 10.1021/ja0669878. [DOI] [PubMed] [Google Scholar]
Associated Data
This section collects any data citations, data availability statements, or supplementary materials included in this article.


