Abstract
Background & Aims
The extensive infiltration of CD8+ T cells in the intestinal mucosa of celiac disease (CD) patients is a hallmark of the disease. We identified a gliadin peptide (pA2) that is selectively recognized by CD8+ T cells infiltrating intestinal mucosa of HLA-A2+ CD patients. Herein, we investigated the phenotype, the tissue localization, and the effector mechanism of cells responsive to pA2 by using the organ culture of CD intestinal mucosa. The target of pA2-mediated cytotoxicity was also investigated by using the intestinal epithelial cell lines Caco2 and HT29, A2+ and A2-, respectively, as target cells.
Methods
Jejunal biopsy specimens from CD patients were cultured in vitro with pA2, and cellular activation was evaluated by immunohistochemistry and cytofluorimetric analysis. Cytotoxicity of pA2-specific, intestinal CD8+ T cells was assayed by granzyme-B and interferon-γ release and by apoptosis of target cells.
Results
pA2 challenge of A2+ CD mucosa increased the percentage of CD8+CD25+ and of CD80+ cells in the lamina propria, the former mainly localized beneath the epithelium, as well as the number of terminal deoxynucleotidyltransferase-mediated dUTP nick-end labeling-positive cells (TUNEL+) in the epithelium. Intraepithelial CD3+ cells and enterocyte expression of Fas were also increased. CD8+ CD25+ and CD8+ FASL+ T cells were significantly increased in cell preparations from biopsy specimens cultured with pA2. CD8+ T-cell lines released both granzyme-B and interferon-γ following recognition of pA2 when presented by Caco2 and not by HT29.
Conclusions
These data indicate that gliadins contain peptides able to activate, through a TCR/HLA class I interaction, CD8-mediated response in intestinal CD mucosa and to induce the enterocyte apoptosis.
Celiac disease (CD) is one of the most thoroughly investigated and characterized forms of food intolerance. Ingestion of wheat gliadins and related prolamines leads to enteropathy in genetically susceptible individuals.1
The characteristic features of CD inflammation are villous atrophy, crypt hyperplasia, and increased number of both intraepithelial lymphocytes (IELs) and lamina propria lymphocytes (LPLs). Although CD4+ T-cell-mediated hypersensitivity to gluten plays a crucial role in tissue injury in CD, its pathogenesis still remains unclear.2–4 Although the role of HLA class II-restricted CD4+ T cells in CD pathogenesis is well documented, recent evidence also supports the involvement of both HLA class I-restricted CD8+ T cells5 and of the innate immune system.6–12 Several studies reported a marked increase of activated CD8+ T cells containing large granzyme-B (GrB)-positive granules and of cell surface expression of FASL in intestinal mucosa of untreated CD patients.6,7 Additionally, FAS-FASL-mediated killing of enterocytes by CD8+ lymphocytes has been reported in mucosa from patients with active disease.8 Finally, recent studies have demonstrated a marked expression of the stress molecule MICA on enterocytes in patients with active disease and the involvement of MICA-NKG2D interaction in the enterocyte lysis by CD8+ IELs.9,10 Interestingly, the activation of these killer IELs, although gliadin-triggered, is T-cell receptor (TCR) independent and most likely mediated by interleukin (IL)-15, an inflammatory cytokine highly up-regulated in patient-derived mucosa.11,13,14 We have previously reported a TCR-dependent activation of intestinal CD8+ T cells by a gliadin-derived peptide (pA2) in patients either on a gluten-free or gluten-containing diet.5 This peptide was selectively recognized in the context of the HLA-A*0201 molecule and induced interferon (IFN)-γ production and lysis of target cells by specific CD8+ T cells. Importantly, IFN-γ is a proinflammatory cytokine dominant in untreated and in gliadin-challenged treated CD mucosa,15,16 and it is produced by TCR α/β CD8+ T cells in both epithelium and lamina propria.17,18
The aim of the present study was to characterize further the gliadin-specific, HLA class I-restricted CD8+ T cells and their role in CD pathogenesis by using the organ culture system of treated CD mucosa and combined immunohistochemistry (IHC) and flow cytometry (FACS) ex vivo analysis. Both IHC and FACS were complementarily used to investigate immunologic activation following mucosal challenge with the cytotoxic gliadin peptide. Expression of activation (CD25), effector (FASL, FAS), and costimulatory (CD80) molecules, as well as mucosal localization of activated cells, were evaluated in intestinal explants cultured for 24 hours in presence of pA2, a peptic-tryptic digested gliadin (PT-gliadin) or an HLA-A2-restricted, control peptide. Finally, the role of pA2-activated intestinal CD8+ T cells in damage of the epithelial layer was also investigated.
Materials and Methods
Patients and HLA Typing
Twenty-two patients with CD (5 male and 17 female; mean age, 35 years; range 20–57 years) on a gluten-free diet for at least 2 years were recruited (see Supplemental Table 1 online at www.gastrojournal.org). Jejunum biopsy specimens were also obtained from 8 non-CD individuals (4 male and 4 female; mean age, 43 years; range 21–58 years): 3 had esophagitis, 3 gastritis without Helicobacter pylori infection, and 2 gastritis with Helicobacter pylori infection. All controls had a normal intestinal mucosa and a negative serology for antigliadin/ antibodies and antiendomysium antibodies. All patients and controls were serologically typed for major histocompatibility complex (MHC) class I alleles using commercial kit (EsseMedical, Milan, Italy); 11 of 22 patients and 2 of 8 controls were HLA-A2+. DQA1, DQB1, and DRB1 genotypes were determined using a commercial kit (Dynal, Oslo, Norway) (see Supplemental Table 1 online at www.gastrojournal.org). All patients and controls were recruited from the Avellino area and gave their informed consent to the study approved by the local ethical committee of Hospital Moscati.
Antigen
Peptides were synthesized as previously reported.19 pA2 corresponds to the residues 123–132 (QLIPCMDVVL) of A-gliadin. The A2-restricted, HIVgag17 peptide (SLYNTVATL) was used as a negative control (pctl); PT-gliadin was used as a positive control.
Organ Culture and Immunohistochemistry
Intestinal biopsy specimens were cultured as described elsewhere.20 Briefly, biopsy specimens were placed on iron grids in an organ culture dish in the presence of medium alone, pA2, or pctl (100 μg/mL) or PT-gliadin (1 mg/mL). After 24 hours, biopsy specimens were embedded in OCT and snap frozen in liquid nitrogen. Acetone-fixed sections (5 μm) were stained with the monoclonal antibodies (mAb) (see Supplemental Table 2 online at www.gastrojournal.org), and peroxidase-antiperoxidase immunodetection was used for CD3 and Fas; alkaline-phosphatase/antialkaline-phosphatase was used for CD25 and CD80. Mouse immunoglobulins were used as isotype control. The sections were finally stained with Mayer's hematoxylin. In experiments to detect CD8+CD25+ cells, immunofluorescence with confocal microscopy (Leica TCS-SP, Heidelberg, Germany) was used. Cryosections were fixed in acetone and incubated with mouse anti-CD25 and rat anti-CD8 antibodies, followed by a mixture of horse anti-mouse fluorescein isothiocyanate (FITC) (1:200; Vector Laboratories, Milan, Italy) and rabbit anti-rat tetramethylrhodamine isothiocyanate (TRITC) conjugated (1:300; Dako, Milan, Italy). Sections were counterstained with ToPro-3 (Molecular Probes, Leiden, The Netherlands) and mounted in phosphate-buffered saline (PBS)/glycerol (1:1). The density of intraepithelial CD3+ cells was calculated on 100 enterocytes; the number of CD25+ and CD80+ cells was evaluated within 1 mm2 of lamina propria. Percentage of CD25+CD8+ T cells was calculated on total of CD8+ LPLs. Staining of intestinal epithelial cells (IEC) expressing Fas was graded as weak, moderate, or strong. Cell apoptosis was detected on frozen tissue fixed with 4% paraformaldehyde using the terminal deoxynucleotidyltransferase-mediated dUTP nick-end labeling (TUNEL) assay (Roche, Mannheim, Germany). Reagents were incubated for 1 hour at 37°C. To highlight the epithelium, the same slides were next incubated with mouse anti-human epithelial antigen (DAKO) for 1 hour at room temperature (RT), followed by 1 hour of incubation with horse anti-mouse FITC. Finally, the samples were counterstained with ToPro-3 and imaged with confocal microscope. All slides were blindly analyzed by 2 observers.
Ex Vivo Cytofluorimetric Analysis
Jejunal biopsy specimens, either following 24 hours of peptides/gliadin challenge or freshly processed, were digested with collagenase-A, as previously described.4 Immediately after the isolation from mucosal explant, cells were analyzed for surface phenotype by fluorescence-activated cell sorter (FACS) using 2- or 3-color immunostainings: 2 × 10⁴ cells were washed in FACS buffer (PBS containing 2% fetal calf serum [FCS] and 0.05% sodium azide) and stained for 30 minutes at RT with fluorochrome-conjugated antibodies (see Supplemental Table 2 online at www.gastrojournal.org). Iso-type control immunoglobulins (Igs) were also used in each set of analysis. Cell fluorescence was analyzed using a FACSalibur (Becton Dickinson). Viable cells were delimited by the exclusion of propidium iodide (Sigma); lymphocytes were gated on the base of the forward/side scattered (FCS/SSC) profile or CD45 expression. Analysis was performed on gated cells using the Cell Quest software (Becton Dickinson).
Generation of pA2-Specific CD8+ Cytotoxic T Lymphocytes From CD Mucosa
pA2-specific CD8+ cytotoxic T lymphocytes (CTLs) lines were generated from treated mucosa as previously described.12 Briefly, mucosal cells were suspended at 2–5 × 10⁵ in 1 mL of complete medium (RPMI plus 10% human serum and antibiotics, purchased from Bio-Whittaker, Bergamo Italy) and plated in the presence of 1 × 10⁶ irradiated (3000 rad) autologous peripheral blood mononuclear cells (PBMC) and pA2 (20 μg/mL). Twenty-four hours later and every 3 days, cultures were fed with 1 mL fresh medium and 10 ng/mL IL-15 (R&D Systems, Minneapolis, MN). Every 7 days, CTLs were restimulated with pA2/PBMC.
T-Cell Assays
CTLs were tested for pA2 recognition by both IFN-γ and GrB release. HLA-A2+ EBV-transformed B-cell line, JY, were used as antigen-presenting cells (APCs). T cells were plated at 3 × 10⁴ in the presence of 1 × 10⁵ APCs and pA2 at 20 μg/mL and incubated for 20–48 hours, as indicated. IFN-γ enzyme-linked immunospot (ELISPOT) was performed as previously described.5 Levels of IFN-γ in cell supernatants were determined by sandwich enzyme-linked immunosorbent assay (ELISA), as described.21 ELISPOT/ELISA commercial kits for GrB detection were purchased from Sanquin (Amsterdam, The Netherlands). Spot-forming cells (SFC) were counted by an immunospot analyzer (A.EL.VIS, Hannover, Germany). In the experiments with blocking mAbs, T-cells and JY were preincubated for 10 minutes with anti-human NKG2D (10 μg/mL; clone 1D11; Biolegend, San Diego, CA) and anti-HLA class I (10 μg/mL; clone W6-32; Biolegend), respectively, before addition of peptide. For pentamer experiments, 96-well round-bottom plates were coated with pA2- or pctl-pentamers (ProImmune, Oxford, UK) at concentration of 1.0, 0.5, and 0.1 μg/mL in 100 μL PBS overnight at 4°C. Following 2 washings with PBS, 0.3 × 10⁵ cells were plated in 200 μL complete medium. After 48 hours of incubation, supernatants were collected and assayed for IFN-γ ELISA. All experiments were performed in duplicate.
Assays With Epithelial Cells as APC
In some experiments, human colon adenocarcinoma Caco2 (HLA-A2+) and HT29 (HLA-A2–) cells were used as APCs. EC were grown in Dulbecco's modified Eagle medium (DMEM)/10% FCS medium supplemented with glucose 4.5 g/mL and harvested at subconfluence by a 10-minute incubation with trypsin-EDTA (Bio-Whittaker). In all coculture experiments, except those for apoptosis evaluation, 1–2 × 10⁵ EC were irradiated (10,000 rad) before being added to 0.5–1 × 10⁵ T cells (T/EC ratio, 1:2). Apoptosis of Caco2 was determined using the FITC-Annexin-V/propidium staining kit (Sigma). Percentage of apoptotic cells was calculated in the region of epithelial (EpCAM+) cells.
Statistical Analysis
Student 2-tailed t test was used to compare responses of specimens cultured with peptides/PT-gliadin with those cultured with medium alone. A P value ≤.05 was considered statistically significant.
Results
pA2 Induced Activation of Lamina Propria Cells in HLA-A2+ CD Patients
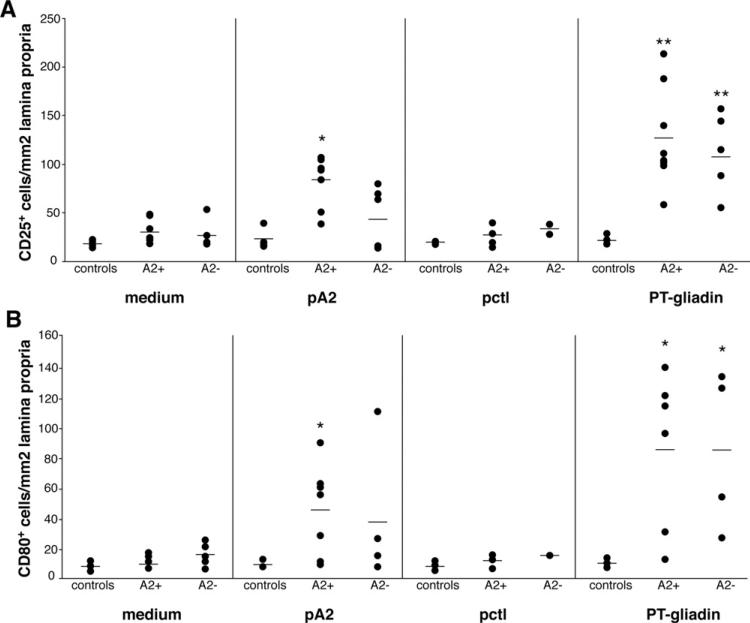
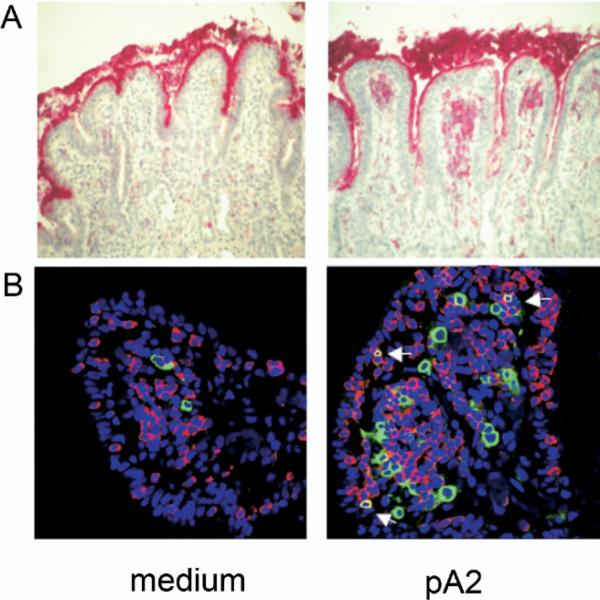
Consistent with previous results,16,20 the number of cells/mm2 expressing CD25 was significantly higher in biopsy specimens cultured with PT-gliadin than in those cultured with medium alone, both in HLA-A2+ (n = 8) and HLA-A2– (n = 6) CD patients: (mean ± SD): 126 ± 51 and 114 ± 41 in PT-gliadin-challenged biopsy specimens and 30 ± 11 and 26 ± 3 in medium-challenged biopsy specimens in A2+ and A2– CD patients, respectively (P < .001) (Figure 1A). The number of CD25+ cells in A2+ CD patients was significantly higher in specimens cultured with pA2 (84 ± 25, P < .001) than in those cultured with medium. By contrast, no significant differences were noted in A2– patients in biopsy specimens cultured with pA2 (43 ± 31, compared with medium, P > .05; Figure 1A), although in 2 patients CD25+ cells appeared increased. Furthermore, CD25+ cells did not increase in biopsy specimens cultured with pctl both in A2+ (25 ± 10) and A2– (33 ± 7) CD patients (P > .2), as well as in healthy controls (n = 4) (Figure 1A). In accordance with previous studies,16,20 CD25+ activated cells were not found in the epithelium layer but were mainly localized beneath the epithelium, both in pA2– and/or PT-gliadin-challenged mucosa (Figure 2A and B).
Figure 1.
pA2 challenge increased CD25+ and CD80+ mononuclear cells in jejunal biopsy specimen from A2+ CD patients. Mucosal explants from HLA-A2+, HLA-A2– CD patients and controls were cultured in vitro with medium alone, gliadin peptide (pA2), control peptide (pctl), or PT-gliadin. CD25+ (A) and CD80+ (B) mononuclear cells were counted per square millimeter of lamina propria. Dashes indicate the mean values. Statistical significance was evaluated comparing responses to peptides/ PT-gliadin with responses to medium alone for each group of subjects. *P < .01, **P < .001.
Figure 2.
Activated CD25+ cells localized in the subepithelial region. (A) Mononuclear cells expressing CD25 were evaluated by IHC on 5-mm cryostat sections of jejunal mucosa cultured as described in Figure 1 legend. Mucosal sections from a representative A2+ CD patient cultured in vitro with medium only or with pA2 are illustrated. Activated CD25+ cells were observed only in the lamina propria and in the subepithelial region. (B) Immunofluorescence staining for CD8 and CD25. Number of CD8+ intraepithelial lymphocytes (red) were increased following pA2 challenge compared with medium alone; also evident is the increase of CD25+ cells (green) and of CD8+CD25+ activated T cells (yellow), particularly in the subepithelial region (arrows). A similar pattern was observed when the mucosa were cultured with the peptic-tryptic digest of gliadin.
A significant increase of CD8+CD25+ double positive cells was observed in the lamina propria of biopsy specimens challenged with PT-gliadin in both A2+ (4.2 ± 1.3 vs 1.2 ± 0.3, respectively, n = 8, P < .001) and A2– (3.5 ± 1.2 vs 1.2 ± 0.6, respectively, n = 6, P < .001) CD patients; only the A2+ CD mucosa showed a significant increase of CD8+CD25+ cells in response to pA2 (2.8 ± 1.2 vs 1.2 ± 0.3 with medium, respectively, P < .01) (Table 1, Figure 2B). Conversely, no significant increase of CD8+CD25+ cells was observed in biopsy specimens cultured with pctl both in A2+ (1.3 ± 0.2) and A2– (1.0 ± 0.3) patients.
Table 1.
Percentage of Lamina Propria CD8+CD25+ Cells
| HLA-A2+ CD patients (n = 8) | HLA-A2– CD patients (n = 6) | |
|---|---|---|
| Medium | 1.2 ± 0.3 | 1.2 ± 0.6 |
| PT-gliadin | 4.2 ± 1.3a | 3.5 ± 1.2a |
| pA2 | 2.8 ± 1.2a | 1.8 ± 0.9 |
| pctl | 1.3 ± 0.2 | 1.0 ± 0.3 |
NOTE. Values represent mean ± SD.
P < .05.
CD80 Expression in Lamina Propria Mononuclear Cells
The number of CD80+ cells/mm2 (mean ± SD), mainly lamina propria mononuclear cells, was significantly increased in A2+ (86 ± 51, n = 7) and A2– (86 ± 52, n = 5) CD biopsy specimens cultured with PT-gliadin, compared with those cultured with medium (11 ± 4, P < .001, and 16 ± 8, P < .01, in A2+ and A2–, respectively) (Figure 1B). Importantly, only in A2+ biopsy specimens, CD80+ cells were significantly enhanced in the presence of pA2 (46 ± 30, P < .01). No differences were obtained in biopsy specimens from A2– patients cultured with pA2 (38 ± 41) compared with medium (16 ± 8, P > .3) (Figure 1B), although in 1 A2– patient the CD80+ cells were increased. Finally, in the case of the control mucosa (n = 4), no significant variation of CD80+ cells, compared with the medium control, was observed in any condition analyzed.
The pA2-induced cell maturation was also investigated on monocyte-derived dendritic cells generated from 5 A2+ patients, as previously described.22 With the exception of 1 patient, in which percentage of CD80+ dendritic cells markedly increased following an overnight pA2-incubation (42.3% vs 67.5%, respectively), no variation was observed in the remaining 4 patients (mean ± SD: 54.9% ± 3.8% vs 52.4% ± 4.2%, respectively, data not shown). Collectively, our data suggested that the cell maturation occurring in pA2-challenged biopsy specimens is a phenomenon not dependent from gliadin peptide itself but most likely secondary to the local activation of CD8+ T-cell response.23,24
Increased Percentage of CD8+ CD25+ and CD8+ FASL+ in pA2 Challenged CD Mucosa
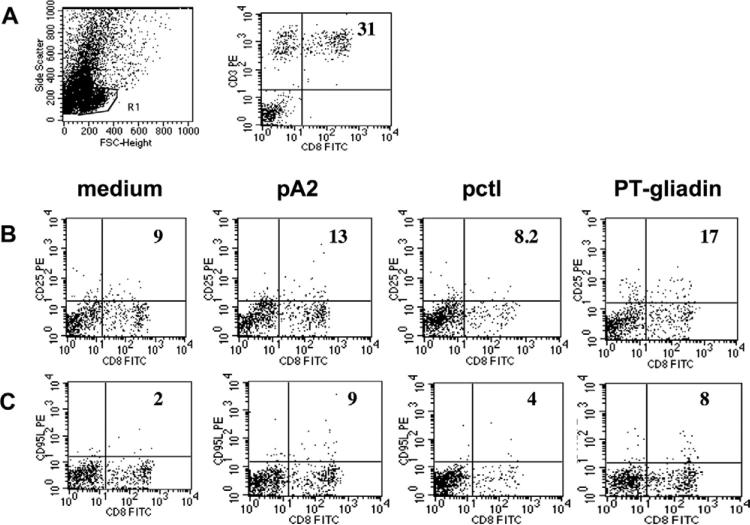
To investigate further the immune response arising in CD intestinal mucosa upon pA2 stimulation, we used FACS analysis of T cells soon after their isolation from primary tissue. Specifically, we evaluated the percentage of different cell subsets infiltrating the intestinal mucosa. The frequency of CD3+CD8+ cells was significantly higher than CD3+CD4+ cells in CD patients (mean ± SD): CD3+CD8+: 23.7% ± 10.6; CD3+CD4+: 11.8% ± 5.6% (P < .005, n = 11) (Figure 3A). By contrast, both cell subsets did not differ in control mucosa: CD3+CD8+: 15.8% ± 3.2; CD3+CD4+: 12% ± 5.7% (P < .5, n = 4).
Figure 3.
Ex vivo flow cytometry profile of cells infiltrating the organ-cultured intestinal mucosa. (A) FACS profile of intestinal cells and percentage of CD3+CD8+ cells infiltrating intestinal CD mucosa. R1 indicates the gate of live cells analyzed. (B) Percentage of CD8+CD25+ and (C) of CD8+CD95L+ cells observed in intestinal biopsy specimens cultured with medium alone, pA2, pctl, or PT-gliadin from 1 representative A2+ CD patient. Numbers indicate percentage of double positive cells normalized on total number of CD8+ cells gated in R1.
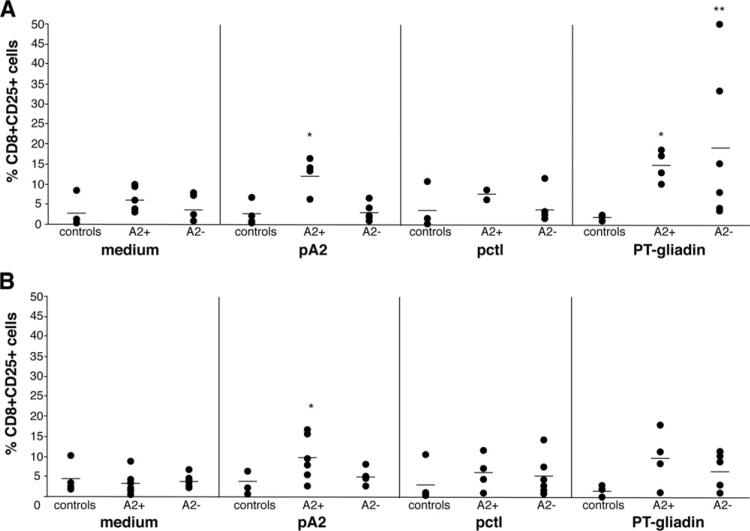
Next, the percentage of CD8+ cells expressing CD25 and CD95(FAS)L was evaluated in organ cultured biopsy specimens. The percentage of CD8+CD25+ and CD8+CD95L+ cells was normalized to the total CD8+ cells (gated in R1; Figure 3B and C). CD8+CD25+ cells were significantly increased in A2+ CD biopsy specimens cultured with pA2: (mean ± SD) 11.6% ± 4.3% compared with a baseline value of 5.9% ± 3.0% (P < .02, n = 6). A significant increase of CD8+CD25+ cells was also observed in PT-gliadin-challenged biopsy specimens: 15.0% ± 3.12% (P < .001, n = 4). No increment of CD8+CD25+ cells was observed in A2+ mucosa challenged with pctl: 7.3% ± 1.3% (P = .4, n = 4) (Figure 4A). In A2– patients, a significant variation of CD8+CD25+ cells was observed only in biopsy specimens cultured with PT-gliadin: 18.8% ± 18.7% compared with a baseline value of 3.6% ± 3.1% (P < .05, n = 4). No significant activation of CD8+ cells was detected in biopsy specimens from controls in any experimental condition tested.
Figure 4.
pA2 challenge of treated mucosa induced the expression of CD25 and CD95L molecules on CD8+ T cells. (A) Immunostaining for CD8CD25 and (B) for CD8CD95L was performed on cells immediately after their isolation from intestinal biopsy specimens cultured as described in Figure 1 legend. Percentage of double positive cells were evaluated as shown in Figure 3. Dashes indicate the mean value obtained for each group of subjects. Statistical significance was evaluated comparing responses to peptides/ PT-gliadin with responses to medium alone. **P < .001, *P < .05.
Similarly to CD25, a marked increase of CD8+ cells expressing the CD95(FAS)L occurred in A2+ biopsy specimens cultured with pA2: 9.3% ± 5.3% vs baseline: 3.2% ± 2.8%; (P < .03, n = 6); in PT-gliadin-cultured biopsy specimens, CD8+CD95L+ cells were also increased, but this trend did not reach statistical significance: 9.1% ± 6.7% (P < .08, n = 4) (Figure 3B and Figure 4B). No significant variation in the number of CD8+CD95L+ cells was found in A2+ biopsy specimens in response to pctl (5.6% ± 4.3%, P < .3, n = 4) and in biopsy specimens from either A2– patients or controls in any condition analyzed.
Immune Activation and Apoptosis in the Epithelium of pA2 Challenged Biopsy Specimens
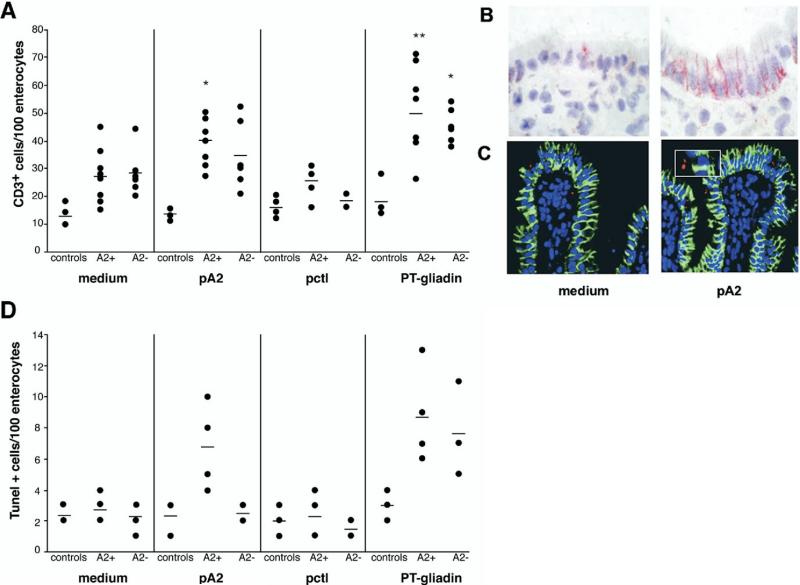
A significant increase in the number of CD3+ cells was observed in the epithelium of A2+ CD biopsy specimens (n = 8) cultured with PT-gliadin (50 ± 15, P < .001) or pA2 (40 ± 9, P < .01) compared with those cultured with medium (27± 10) (Figures 2B and 5A). By contrast, in A2– CD mucosa (n = 6), the number of IELs was significantly enhanced only in those cultured with PT-gliadin (42 ± 6 vs 16.4 ± 7.6, respectively, P < .001), consistently with previous studies.25 With the exception of 1 A2– patient, no differences were noted in the number of intraepithelial CD3+ cells in biopsy specimens stimulated with either pA2 or pctl (34 ± 10 and 18 ± 4, respectively), compared with baseline (27 ± 9, P > .2; Figure 5A). No T-cell infiltration was observed in control biopsy specimens (n = 4) in any of the experimental conditions tested. In accordance with previous studies,8,26 FAS epithelial expression was markedly increased after 24 hours of challenge with PT-gliadin, and particularly evident in basolateral membranes of enterocytes, both in biopsy specimens of A2+ (n = 6) and of A2– (n = 6) CD patients as compared with control samples cultured with medium only. Similarly, a high FAS expression was observed in A2+ CD biopsy specimens cultured with pA2, compared with those cultured with medium or pctl (Figure 5B, see Supplemental Table 3 online at www.gastrojournal.org). Noteworthy, the pA2-induced FAS expression was an A2-restricted and disease-specific phenomenon because no FAS up-regulation occurred in A2– or control biopsy specimens (n = 4) in response to pA2 (see Supplemental Table 3 online at www.gastrojournal.org).
Figure 5.
pA2-induced immune activation in the epithelium compartment. (A) Number of CD3+ cells infiltrating the epithelium of jejunal specimens cultured in vitro with medium alone, A2-restricted peptide (pA2), control peptide (pctl), or PT-gliadin. CD3+ cells were counted in at least 3 different fields containing 100 enterocytes each. The mean value is reported for each subject, and dashes indicate the mean values obtained for each group. (B) FAS epithelium expression in the jejunal mucosa from an A2+ CD patient. (C) Villous epithelium of mucosal ex-plants from a representative A2+ CD patient showing apoptotic bodies (red) and cytokeratin+ cells (green; image magnification, ×40; inset, ×60). (D) Overall results of TUNEL+ cells counted in the villous epithelium of organ cultured biopsy specimens. TUNEL+ cells were counted in at least 3 different fields containing 100 enterocytes each. The mean value is reported for each subject, and dashes indicate the mean values obtained for each group. Statistical significance was evaluated for panel A as indicated in Figure 1. *P < .01, **P < .001.
An increase of apoptotic (TUNEL positive) cells was observed in the villous epithelium of A2+ (9 ± 3; n = 4) and A2– (8 ± 4; n = 4) CD biopsy specimens cultured with PT-gliadin compared with those cultured with medium alone (3 ± 1 and 2 ± 1 in A2+ and A2–, respectively) (Figure 5C and 5D). pA2 induced apoptosis only in A2+ biopsy specimens (7 ± 3); conversely, no differences were noted in the number of TUNEL-positive cells when A2– biopsy specimens were cultured with pA2 (3 ± 1) compared with the baseline value (2 ± 1). Similarly, apoptosis was not induced in biopsy specimens of controls (n = 3) either cultured with PT-gliadin/gliadin or control peptide.
TCR/HLA Class I Interaction Is Involved in pA2 Recognition by Intestinal CD8+ T Cells
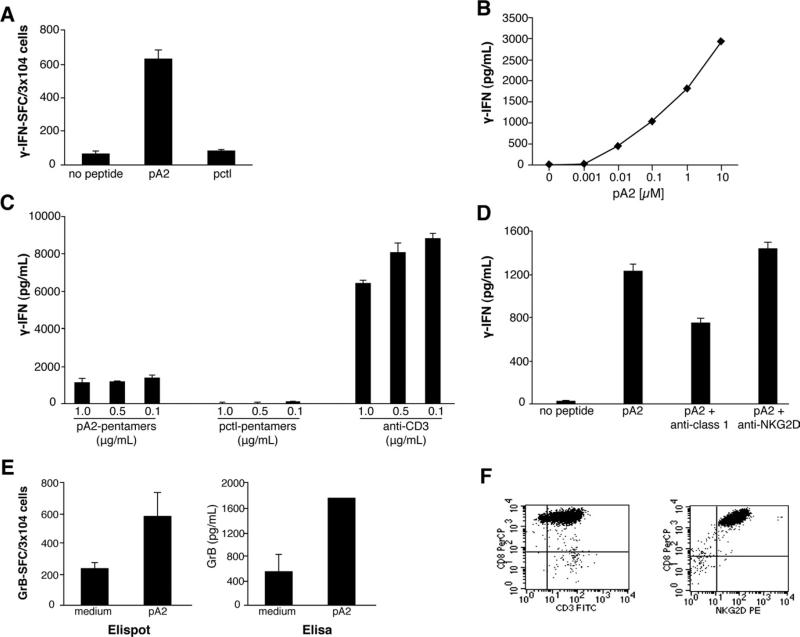
We have previously shown that pA2-specific CD8+ CTLs can be generated from A2+ CD mucosa.5 Herein, we further investigated the intestinal CD8+ T-cell-mediated response to pA2. Consistently with the organ culture results, pA2 induced IFN-γ responses by intestinal CD8+ CTLs (Figure 6A) and were still detectable in response to very low peptide dose (less than 0.01 μmol/L) (Figure 6B).
Figure 6.
pA2 recognition by intestinal CD8+ T cells occurs in the context of HLA-A2 restriction and via the TCR activation. (A and B) CD8+ CTL generated from intestinal mucosa of A2+ CD mucosa were assayed for IFN-γ release upon pA2 recognition by both ELISPOT (A) and ELISA (B) assays. CD8+ T cells (0.3 × 10⁵) were stimulated with HLA-A2+ JY cells (1 × 10⁵) in the presence of medium alone or pA2 at 20 μg/mL (A) or in a dose curve response (B) for 20–48 hours. (C) Peptide-HLA-A2.1 pentamers or anti-CD3 were immobilized onto 96-well plate and used to stimulate CD8+ CTLs. (D) pA2 recognition by CD8+ CTLs in the absence or presence of blocking anti-HLA class I or anti-NKG2D monoclonal antibodies (10 μg/mL of each monoclonal antibody). (E) pA2-induced GrB production was assessed by both ELISPOT and ELISA. Results are shown as mean ± SD of duplicate experiments. (F) FACS profile of pA2-specific intestinal CD8+ CTL.
Only pA2-pentamers and not pctl-pentamers were able to stimulate the IFN-γ production by cognate CTLs when immobilized on culture plates (Figure 6C);27 furthermore, the HLA-A2 restriction of pA2 was confirmed by the partial inhibition of IFN-γ production in the presence of blocking anti-HLA class I antibodies (Figure 6D). Recent studies showed that CD8+ T cells can lyse IEC and have a role in the tissue damage through the ligation of the NKG2D receptor.9,10 Herein, we demonstrated that GrB, one of the molecules involved in cytotoxicity,28 is released by intestinal CD8+ T cells upon pA2 stimulation (Figure 6E). Interestingly, we found that anti-NKG2D blocking antibodies did not affect the pA2-induced IFN-γ release by specific cells (Figure 6D), although they expressed high level of NKG2D (Figure 6F). Altogether, these results demonstrated that pA2 activates cytotoxic CD8+ T cells in the context of HLA-A2 restriction and via TCR stimulation.
Epithelial Cells Are Targets of pA2-Specific CD8+T Cells
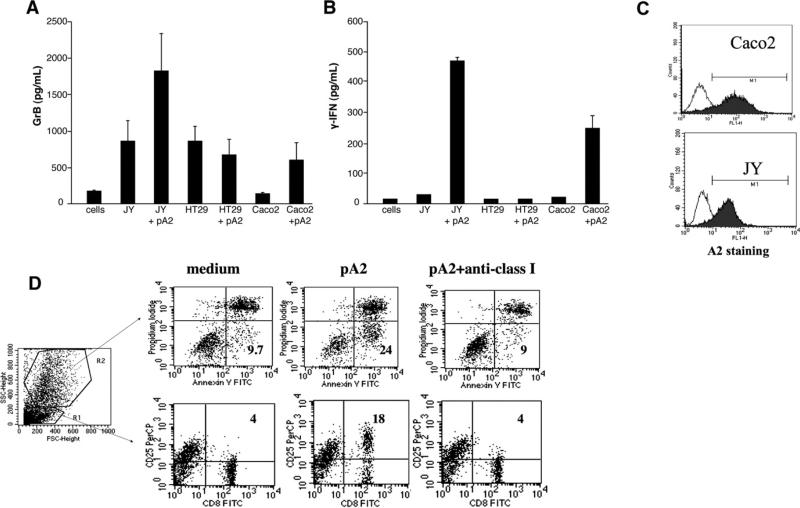
One of the recurrent histologic features of untreated CD mucosa is damage of the epithelial layer, and apoptosis is one of the pathways responsible of the gluten-triggered villous atrophy.7–11,14,26 For this reason, we next investigated whether epithelial cells can be targeted by pA2-mediated cytolytic activity by intestinal CD8+ CTLs by using Caco2 and HT-29 as APCs. As clearly shown in Figure 7A and 7B, only Caco2 cells (A2+ cells, Figure 7C) were able to present pA2 and to induce both IFN-γ and GrB production. Furthermore, in coculture experiments, pA2 induced an increase of apoptosis of Caco2 (gated in R2) after 72 hours of incubation (Figure 7D). Importantly, an almost complete abrogation of apoptosis was observed in the presence of anti-HLA class I antibody. Similarly, a marked increase of CD25 expression on CD8+ cells (gated in R1) occurred in response to pA2, a phenomenon completely abrogated when blocking the HLA class I. Collectively, these results indicate that epithelial cells can load pA2 in the context of HLA-A2 restriction molecules and stimulate specific intestinal CD8+ T cells.
Figure 7.
HLA-A2+ epithelial cells are target of pA2-induced CD8+ T-cell activation. (A and B) The epithelial cell lines Caco2 (A2+) and HT29 (A2–) were used as APC (1 × 10⁵) to stimulate pA2-specific CD8+ T cells (0.3 × 10⁵). Levels of IFN-γ and GrB were evaluated in cell supernatants following 48 hours of incubation. (C) Basal level of HLA-A2 expressed on cell's surface of APCs (JY and Caco2). (D) Apoptosis of epithelial cells (gated in R2) and CD25 expression on T cells (gated in R1) were analyzed in coculture experiments.
Discussion
We have previously shown that a short gliadin peptide (A-gliadin123–132, pA2) is recognized by CD8+ T cells infiltrating CD intestinal mucosa, from both untreated and treated patients. We also demonstrated that, following recognition of pA2, in the context of the HLA-A2 molecule, CD8+ T cells produced IFN-γ,5 a key cytokine in the induction of mucosa damage in CD patients.4,15,16 In this study, we demonstrated that challenge with pA2 of intestinal mucosa from A2+-treated patients induced typical events occurring both in the epithelium and in lamina propria compartments following incubation with gliadin.16,20,29 More specifically, we observed an increased expression of CD25 and CD80 on mononuclear cells of the lamina propria. Expression of FAS and apoptosis was also markedly increased in the epithelium of pA2-challenged biopsy specimens. Several cells expressing CD25 were of CD8+ phenotype, and, remarkably, most of them were found beneath the epithelium or near macrophages. The up-regulation of CD80 on mononuclear cells and of CD25 on CD8+ cells is consistent with the hypothesis that an active presentation of pA2 to cognate T cells occurs in CD mucosa following pA2 exposure.
Previous studies have demonstrated that gliadin can induce maturation of peripheral blood dendritic cells.23 However, we did not observed any significant increase of CD80 expression on dendritic cells from A2+ CD patients, thus suggesting that the mononu-clear cells maturation observed in pA2-challenged biopsy specimens could be due to bystander activation following the stimulation of specific CD8+ T cells.24 Although we observed pA2-induced intestinal immune activation in A2+ CD patients, 2 patients not carrying this HLA allele were also responsive to pA2. A possible explanation is that pA2 could be cross presented by different HLA class I molecules.30–33 No pA2 binding was observed to purified HLA-A1, -A11, and -A3 molecules (data not shown). We hypothesize that pA2 could cross-react with HLA-C molecules, given the strong similarity of binding motif between HLA-A2 and certain HLA-C molecules.33
Analysis of cells from cultured biopsy specimens indicated that CD8+CD25+ activated cells cultured with pA2 were T lymphocytes (CD3+). Furthermore, increased frequencies of CD8+CD25+ cells were also observed in the lamina propria in response to PT-gliadin in both A2+ and A2– CD patients, strongly suggesting the existence of additional gliadin peptides eliciting a CD8-mediated responses and restricted by other HLA class I molecules.
Challenge of intestinal mucosa with pA2 and PT-gliadin also results in a migration of CD3+ cells in the epithelium, consistent with previous reports.16,20,25 Because no activated cells were detected in the epithelium following pA2– or PT-gliadin-challenged mucosa, the CD3+ cell migration might be a phenomenon secondary to the activation of lamina propria CD8+ T cells secreting IFN-γ, a cytokine known to induce cell trafficking into the epithelium.34,35 Interestingly, the CD3+ cell migration induced by pA2 was weaker than that induced by PT-gliadin. One possible explanation is that PT-gliadin includes several immunogenic peptides that activate CD4+ T cells and, collectively, trigger a stronger IFN-γ release. Importantly, the absence of an overall significant mucosal response to pA2 in A2– CD patients and in controls confirms that gliadins contain peptides able to activate HLA class I restricted and disease-specific intestinal CD8+ T cells.
The higher expression of FAS molecule on epithelial cells upon pA2-incubation of treated mucosa suggested an investigation into whether up-regulation of FASL could also occur on CD8+ T cells. Although we found a significant increase of CD8+ T cells expressing FASL in pA2-challenged biopsy specimens, further studies are required to demonstrate unequivocally the involvement of FAS-FASL interaction in the pA2-triggered, mucosal CD8+ T-cell activation.
To provide further evidence that enterocytes might be one of the target cells of pA2-induced cytotoxicity, we generated pA2-specific CD8+ CTLs from treated CD mucosa and used pA2-pulsed adenocarcinoma cells as target cells. In coculture experiments, we observed a consistent production of the cytotoxicity mediators IFN-γ and GrB. Furthermore, an increased up-regulation of CD25 on CD8+ CTLs occurred concomitantly with a sustained apoptosis of target epithelial (EpCAM+) cells. Collectively, our results demonstrate that IEC can efficiently load and present pA2 in the context of HLA-A2 molecule to intestinal CD8+ T cells and that cells recognizing pA2 induce apoptosis of enterocytes.
It is still unresolved how gluten peptides pass through the intestinal epithelial cell barrier and activate pathogenic T cells. Intracellular epithelial transport and processing of gliadin peptides has been recently reported,36 thus suggesting that IEC can internalize gliadin peptide and present them on their surface. The findings that, following pA2 challenge of treated CD mucosa, the great majority of activated CD8+ T cells are found in strict contact with the basal epithelial layer suggest that CD8+ T cells might have a role in the CD intestinal damage. The observation that Caco2 cells can in vitro efficiently present pA2 to cognate cells strongly supports this hypothesis and confirms that IEC can present antigens of different origin to both CD8 and CD4 T cells.37
Recent studies have focused the central role of intraepithelial CD8+ T cells, activated in a TCR-independent manner by gluten stimulation, to induce epithelial damage.9,10 To date, a TCR-mediated, T-cell activation by gliadin peptides has been demonstrated only for CD4+ cells restricted by the HLA class II molecules DQ2 and DQ8. Our data clearly show that a gliadin peptide activates mucosa infiltrating CD8+ T cells in the context of HLA class I restriction and suggest a role of these cells in the death of CD epithelial cells.
In conclusion, we have shown that the intestinal mucosa of CD patients harbors CD8+ T cells, which can be activated by a short gliadin peptide following in vitro challenge of intestinal mucosa. These cells recognize gliadin peptide when presented by epithelial cells, produce IFN-γ, and contribute to the lesion of intestinal epithelial layer by inducing apoptosis of enterocytes.
Supplementary Material
Acknowledgments
Supported by MiPAF: Programma triennale di ricerca “Qualità alimentare” and Regione Campania, ex LR 5/2002.
The authors thank Clemente Meccariello and Dr Luigi Cipriano for technical assistance.
Abbreviations used in this paper
- CD
celiac disease
- CTL
cytotoxic T lymphocytes
- GrB
granzyme-B
- IEC
intestinal epithelium cells
- IELs
intraepithelium lymphocytes
- LPLs
lamina propria lymphocytes
- PT
peptic-tryptic
Footnotes
Supplementary Data
Supplementary data associated with this article can be found, in the online version, at doi:10.1053/j .gastro.2008.01.008.
References
- 1.Sollid LM. Celiac disease: dissecting a complex inflammatory disorder. Nat Rev Immunol. 2002;2:647–655. doi: 10.1038/nri885. [DOI] [PubMed] [Google Scholar]
- 2.Lundin KE, Scott H, Hansen T, et al. Gliadin-specific HLA-DQ(a1*0501,b1*0201) restricted T-cells isolated from the small intestinal mucosa of celiac disease patients. J Exp Med. 1993;178:187–196. doi: 10.1084/jem.178.1.187. [DOI] [PMC free article] [PubMed] [Google Scholar]
- 3.van de Wal Y, Kooy Y, van Veelen P, et al. Small intestinal T cells of celiac disease patients recognize a natural peptide fragment of gliadin. Proc Natl Acad Sci U S A. 1998;95:10050–10054. doi: 10.1073/pnas.95.17.10050. [DOI] [PMC free article] [PubMed] [Google Scholar]
- 4.Troncone R, Gianfrani C, Mazzarella G, et al. Majority of gliadin-specific T-cell clones from celiac small intestinal mucosa produce interferon-γ and interleukin-4. Dig Dis Sci. 1998;43:156–161. doi: 10.1023/a:1018896625699. [DOI] [PubMed] [Google Scholar]
- 5.Gianfrani C, Troncone R, Magione P, et al. Celiac disease association with CD8+ T-cell responses: identification of a novel gliadin-derived HLA-A2 restricted epitope. J Immunol. 2003;170:2719–2726. doi: 10.4049/jimmunol.170.5.2719. [DOI] [PubMed] [Google Scholar]
- 6.Oberhuber G, Vogelsang H, Stolte M, et al. Evidence that intestinal intraepithelial lymphocytes are activated cytotoxic T cells in celiac disease but not in giardiasis. Am J Pathol. 1996;148:1351–1357. [PMC free article] [PubMed] [Google Scholar]
- 7.Ciccocioppo R, Di Sabatino A, Parroni R, et al. Cytolytic mechanisms of intraepithelial lymphocytes in coeliac disease (CoD). Clin Exp Immunol. 2000;120:235–240. doi: 10.1046/j.1365-2249.2000.01200.x. [DOI] [PMC free article] [PubMed] [Google Scholar]
- 8.Di Sabatino A, Ciccocioppo R, D'Alò S, et al. Intraepithelial and lamina propria lymphocytes show distinct patterns of apoptosis, whereas both populations are active in Fas based cytotoxicity in coeliac disease. Gut. 2001;49:380–386. doi: 10.1136/gut.49.3.380. [DOI] [PMC free article] [PubMed] [Google Scholar]
- 9.Meresse B, Chen Z, Ciszewski C, et al. Coordinated induction by IL15 of a TCR-independent NKG2D signaling pathway converts CTL into lymphokine-activated killer cells in coeliac disease. Immunity. 2004;21:357–366. doi: 10.1016/j.immuni.2004.06.020. [DOI] [PubMed] [Google Scholar]
- 10.Hue S, Mention JJ, Monteiro R, et al. A direct role for NKG2D/MICA interaction in villous atrophy during coeliac disease. Immunity. 2004;21:367–377. doi: 10.1016/j.immuni.2004.06.018. [DOI] [PubMed] [Google Scholar]
- 11.Jabri B, Patey-Mariaud De Serre N, Cellier C, et al. Selective expansion of intraepithelial lymphocytes expressing the HLA-E-specific natural killer receptor CD94 in coeliac disease. Gastroenterology. 2000;118:867–879. doi: 10.1016/S0016-5085(00)70173-9. [DOI] [PMC free article] [PubMed] [Google Scholar]
- 12.Gianfrani C, Auricchio S, Troncone R. Adaptive and innate immune responses in coeliac disease. Immunol Lett. 2005;99:141–145. doi: 10.1016/j.imlet.2005.02.017. [DOI] [PubMed] [Google Scholar]
- 13.Maiuri L, Ciacci C, Auricchio S, et al. Interleukin 15 mediates epithelial changes in coeliac disease. Gastroenterology. 2000;119:996–1006. doi: 10.1053/gast.2000.18149. [DOI] [PubMed] [Google Scholar]
- 14.Mention JJ, Ahmed MB, Begue B, et al. Interleukin 15: a key to disrupted intraepithelial lymphocyte homeostasis and lymphomagenesis in coeliac disease. Gastroenterology. 2003;125:730–745. doi: 10.1016/s0016-5085(03)01047-3. [DOI] [PubMed] [Google Scholar]
- 15.Nilsen EM, Jahnsen FL, Lundin KEA, et al. Gluten induces an intestinal cytokine response strongly dominated by interferon-γ in patients with coeliac disease. Gastroenterology. 1998;115:551–563. doi: 10.1016/s0016-5085(98)70134-9. [DOI] [PubMed] [Google Scholar]
- 16.Salvati V, Mazzarella G, Gianfrani C, et al. Recombinant human IL-10 suppresses gliadin-dependent T-cell activation in ex vivo cultured coeliac intestinal mucosa. Gut. 2005;54:46–53. doi: 10.1136/gut.2003.023150. [DOI] [PMC free article] [PubMed] [Google Scholar]
- 17.Forsberg G, Hernell O, Hammarström S, et al. Concomitant increase of IL-10 and pro-inflammatory cytokines in intraepithelial lymphocyte subsets in celiac disease. Int Immunol. 2007;19:993–1001. doi: 10.1093/intimm/dxm077. [DOI] [PubMed] [Google Scholar]
- 18.Leon F, Sanchez L, Camarero C, et al. Cytokine production by intestinal intraepithelial lymphocytes subsets in celiac disease. Dig Dis Sci. 2005;50:593–600. doi: 10.1007/s10620-005-2480-5. [DOI] [PubMed] [Google Scholar]
- 19.Gulukota K, Sidney J, Sette A, et al. Two complementary methods for predicting peptides binding major histocompatibility complex molecules. J Mol Biol. 1997;267:1258–1267. doi: 10.1006/jmbi.1997.0937. [DOI] [PubMed] [Google Scholar]
- 20.Mazzarella G, Maglio M, Paparo F, et al. An immunodominant DQ8 restricted gliadin peptide activates small intestinal immune response in in vitro cultured mucosa from HLA-DQ8 positive but not HLA-DQ8 negative coeliac patients. Gut. 2003;52:57–62. doi: 10.1136/gut.52.1.57. [DOI] [PMC free article] [PubMed] [Google Scholar]
- 21.Gianfrani C, Levings MK, Sartirana C, et al. Gliadin-specific type 1 regulatory T cells from the intestinal mucosa of treated celiac patients inhibit pathogenic T cells. J Immunol. 2006;177:4178–4186. doi: 10.4049/jimmunol.177.6.4178. [DOI] [PubMed] [Google Scholar]
- 22.Terrazzano G, Sica M, Gianfrani C, et al. Gliadin regulates the NK-dendritic cell cross-talk by HLA-E surface stabilization. J Immunol. 2007;179:372–381. doi: 10.4049/jimmunol.179.1.372. [DOI] [PubMed] [Google Scholar]
- 23.Palová-Jelínková L, Rozková D, Pecharová B, et al. Gliadin fragments induce phenotypic and functional maturation of human dendritic cells. J Immunol. 2005;175:7038–7045. doi: 10.4049/jimmunol.175.10.7038. [DOI] [PubMed] [Google Scholar]
- 24.Acuto O, Michel F. CD28-mediated costimulation: a quantitative support for T-cell signaling. Nat Rev Immunol. 2003;3:939–951. doi: 10.1038/nri1248. [DOI] [PubMed] [Google Scholar]
- 25.Maiuri L, Picarelli A, Boirivant M, et al. Definition of initial immuno-logic modifications upon in vitro gliadin challenge in the small intestine of celiac patients. Gastroenterology. 1996;110:1368–1378. doi: 10.1053/gast.1996.v110.pm8613040. [DOI] [PubMed] [Google Scholar]
- 26.Maiuri L, Ciacci C, Raia V, et al. Fas engagement drive apoptosis of enterocytes of celiac patients. Gut. 2001;48:418–424. doi: 10.1136/gut.48.3.418. [DOI] [PMC free article] [PubMed] [Google Scholar]
- 27.Quarsten H, McAdam SN, Jensen T, et al. Staining of celiac disease-relevant T cells by peptide-DQ2 multimers. J Immunol. 2001;167:4861–4868. doi: 10.4049/jimmunol.167.9.4861. [DOI] [PubMed] [Google Scholar]
- 28.Shresta S, Pham C, Thomas D, et al. How do cytotoxic lymphocytes kill their targets? Curr Opin Immunol. 1998;10:581–587. doi: 10.1016/s0952-7915(98)80227-6. [DOI] [PubMed] [Google Scholar]
- 29.Halstensen TS, Scott H, Fausa O, et al. Gluten stimulation of coeliac mucosa in vitro induces activation (CD25) of lamina propria CD4+ T cells and macrophages but no crypt-cell hyperplasia. Scand J Immunol. 1993;38:581–590. doi: 10.1111/j.1365-3083.1993.tb03245.x. [DOI] [PubMed] [Google Scholar]
- 30.Frahm N, Yusim K, Suscovich TJ, et al. Extensive HLA class I allele promiscuity among viral CTL epitopes. Eur J Immunol. 2007;37:2419–2433. doi: 10.1002/eji.200737365. [DOI] [PMC free article] [PubMed] [Google Scholar]
- 31.Sabbaj S, Bansal A, Ritter GD, et al. Cross-reactive CD8+ T cell epitopes identified in US adolescent minorities. J Acquir Immune Defic Syndr. 2003;33:426–438. doi: 10.1097/00126334-200308010-00003. [DOI] [PubMed] [Google Scholar]
- 32.Peters B, Sidney J, Bourne P, et al. The immune epitope database and analysis resource: from vision to blueprint. PLoS Biol. 2005;3:e91. doi: 10.1371/journal.pbio.0030091. [DOI] [PMC free article] [PubMed] [Google Scholar]
- 33.Barber LD, Percival L, Valiante NM, et al. The inter-locus recombinant HLA-B*4601 has high selectivity in peptide binding and functions characteristic of HLA-C. J Exp Med. 1996;184:735–740. doi: 10.1084/jem.184.2.735. [DOI] [PMC free article] [PubMed] [Google Scholar]
- 34.Hayday A, Theodoridis E, Ramsburg E, et al. Intraepithelial lymphocytes: exploring the Third Way in immunology. Nat Immunol. 2001;11:997–1003. doi: 10.1038/ni1101-997. [DOI] [PubMed] [Google Scholar]
- 35.Shibahara T, Miyazaki K, Sato D, et al. Alteration of intestinal epithelial function by intraepithelial lymphocyte homing. J Gastroenterol. 2005;40:878–886. doi: 10.1007/s00535-005-1631-y. [DOI] [PubMed] [Google Scholar]
- 36.Matysiak-Budnik T, Candalh C, Dugave C, et al. Alteration of intestinal transport and processing of gliadin peptides in celiac disease. Gastroenterology. 2003;125:696–707. doi: 10.1016/s0016-5085(03)01049-7. [DOI] [PubMed] [Google Scholar]
- 37.Hershberg RM, Mayer LF. Antigen processing and presentation by intestinal epithelial cells—polarity and complexity. Immunol Today. 2000;123:123–128. doi: 10.1016/s0167-5699(99)01575-3. [DOI] [PubMed] [Google Scholar]
Associated Data
This section collects any data citations, data availability statements, or supplementary materials included in this article.


