

Abstract
Herein we report the discovery and SAR of a novel antagonist of metabotropic glutamate receptor 4 (mGlu4). The antagonist was discovered via a molecular switch from a closely related mGlu4 positive allosteric modulator (PAM). This antagonist (VU0448383) displays an IC50 value of 8.2 ± 0.4 μM and inhibits an EC80 glutamate response by 63.1 ± 6.6%.
Keywords: Metabotropic glutamate receptor 4, mGlu4, Molecular switch, Antagonist
G-protein coupled receptor (GPCR) orthosteric ligands currently represent the largest class of drug molecules. However, over the past several years, modulation of these targets via a novel mechanism, allosteric modulation, has generated much attention and research focus.1–3 One phenomenon that has been reported recently is the notion of ‘molecular switching’, referring to allosteric ligands that switch modes of pharmacology upon subtle modifications of the chemical scaffold.4 While there have been a number of reports of molecular switches within the Groups I5,6 and II7 metabotropic glutamate receptors, to the best of our knowledge, this is the first report of a molecular switch within allosteric ligands of the Group III subfamily.
As part of the Molecular Libraries Production Center Network (MLPCN),8 we had previously performed a high throughput screen of the NIH Molecular Libraries Small Molecule Repository (MLSMR) collection of compounds to identify muscarinic acetylcholine receptor 4 (M4)-specific antagonists using a cell line expressing M4 with a chimeric G protein, Gqi5, to induce calcium mobilization. During primary and confirmation screening, VU0219493 was flagged as an M4 antagonist when screened at a single dose of 10 μM. The compound was then evaluated for concentration-dependent activity at M4, a stage which involved counter screening using four cell lines, one of which was a cell line co-expressing metabotropic glutamate receptor 4 (mGlu4) and Gqi5.9 The purpose of this counter screen was to control for nonspecific GPCR or Gqi5-mediated effects of HTS hits. While VU0219493 failed to confirm as active in these follow-up screens for muscarinic receptors (IC50 >30 μM for both M4 and M1), surprisingly, the compound robustly potentiated the mGlu4/Gqi5 calcium response with a potency of 1.4 ± 0.4 μM (Fig. 1). The activity of this hit was also verified in cells co-expressing rat mGlu4 with GIRK potassium channels10 (EC50 = 1.1 μM) and a 30 μM concentration of the compound shifted a concentration-response curve for glutamate ninefold to the left (data not shown).
Figure 1.

VU0219493 (inset structure) potentiates glutamate-induced calcium stimulation in human mGlu4/Gqi5 cells in a concentration-dependent fashion. Data represent the mean ± SEM of three independent experiments performed in triplicate.
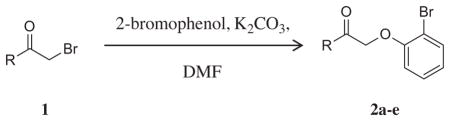
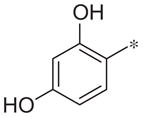
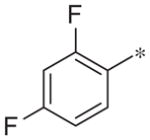
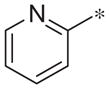
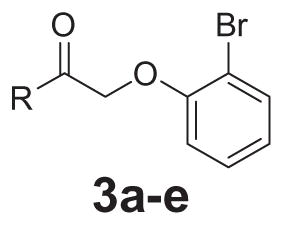
With a verified positive allosteric modulator (PAM) hit in hand,11 we began a chemical optimization program around this scaffold. SAR exploration was begun by reacting commercially available α-bromoketones with 2-bromophenol to yield the desired compounds. Methylation of the phenolic groups or replacing the phenols with fluorine led to inactive compounds (2b and 2c). The 2,4-dihydrophenyl group could be replaced with 2-pyridyl (2d; 4.6 ± 1.4 μM); however, a significant loss of potency was observed.
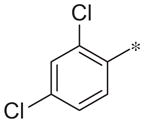
In our screening program, we routinely assess compound activity in the presence of glutamate concentrations that generate a response that is either 20% (to detect potentiators) or 80% (to identify antagonists) of a maximal agonist response. Using this strategy, we found that inclusion of a 4-chloro-3-pyridyl group engendered a ‘molecular switch’ within the scaffold, resulting in a compound with mGlu4 antagonist activity (2e, 7.8 μM, blockade of the EC80 glutamate response by approximately 75%, Table 1).
Table 1.
Initial SAR for mGlu4 PAM VU0219493
| |||
|---|---|---|---|
| Compd | R | hmGlu4 EC50 (μM)a | Efficacy %PHCCC |
| 2a |
|
1.4 ± 0.4 | 79.0 ± 3.1 |
| 2b |

|
Inactive | 12.1 ± 3.1 |
| 2c |
|
Inactive | 12.2 ± 4.7 |
| 2d |
|
4.6 ± 1.4 | 81.9 ± 2.7 |
| 2e |
|
Antagonistb(IC50 = 7.8) | %Inhibition 74.4 |
Potentiation EC50 and efficacy (% PHCCC) are the average of at least three independent determinations performed in triplicate (mean ± SEM shown in table). The maximal response generated in mGlu4 CHO cells in the presence of mGlu4 PAMs varies slightly in each experiment; therefore, PAM data are normalized to a control PAM, PHCCC, response obtained in each day’s run.
For 2e, potency and efficacy (% inhibition) data are for blockade of an EC80 glutamate response.
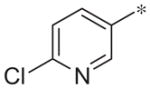
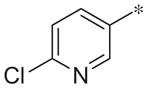
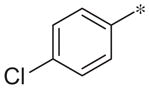
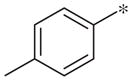
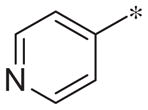
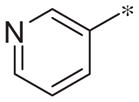
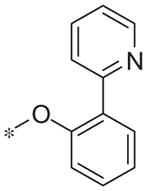
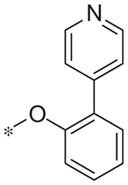
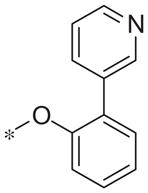
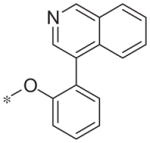
Based on the activity of 2e, a brief SAR around the left-hand pyridyl moiety was undertaken (Table 2). Removal of the pyridine nitrogen led to inactive compounds (3a, 3b, and 3e). In addition, moving the nitrogen around the ring also was unproductive and led to inactive compounds (3c and 3d). Interestingly, the 2-pyridyl compound was an activator (2d), but other regioisomers were inactive.
Table 2.
SAR of the pyridyl group
| |||
|---|---|---|---|
| Compd | R | hmGlu4 IC50 (μM)a | % Inhibition |
| 2e |
|
8.2 ± 0.4 | 63.1 ± 6.6 |
| 3a |
|
Inactive | −3.1 ± 1.3 |
| 3b |
|
Inactive | −6.9 ± 3.0 |
| 3c |
|
Inactive | −4.0 ± 6.1 |
| 3d |
|
Inactive | −1.5 ± 1.5 |
| 3e |
|
Inactive | 2.3 ± 1.6 |
Antagonist activity at mGlu4 is assessed by measuring the ability of a compound to concentration-dependently inhibit an EC80 glutamate response. IC50 and % inhibition values are the average of at least three independent determinations (mean ± SEM shown in table). Compounds were ranked as active if they inhibited the EC80 response by at least 20%.
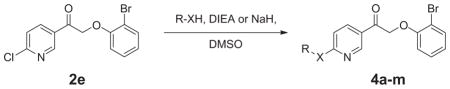
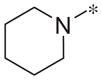
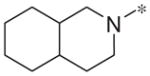
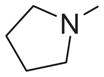
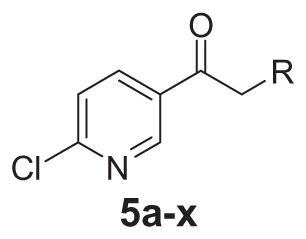
A more extensive SAR optimization was undertaken to further evaluate compounds as antagonists of the mGlu4 receptor (Table 3). The initial antagonist hit was re-synthesized and evaluated in antagonist mode where potency and efficacy were confirmed (8.2 ± 0.4 μM; 63.1% inhibition). Further evaluation by displacement of the 4-chloro, however, was not productive as all compounds were inactive (4a–h and 4j–m) or very weak in their activity (4i, >10 μM, 25.5% inhibition).
Table 3.
SAR of substituted pyridine compounds
| |||
|---|---|---|---|
| Compd | R-X | hmGlu4 IC50 (μM)a | % Inhibition |
| 2e | cl | 8.2 ± 0.4 | 63.1 ± 6.6 |
| 4a |
|
Inactive | −5.4 ± 6.1 |
| 4b |
|
Inactive | −7.3 ± 3.9 |
| 4c |
|
Inactive | −7.2 ± 4.8 |
| 4d |
|
Inactive | −7.2 ± 2.3 |
| 4e |
|
Inactive | −9.9 ± 4.9 |
| 4f |
|
Inactive | −2.9 ± 5.8 |
| 4g |
|
Inactive | −15.8 ± 6.1 |
| 4h |
|
Inactive | 2.2 ± 6.0 |
| 4i |
|
>10 | 25.5 ± 9.2 |
| 4j |
|
Inactive | −4.8 ± 3.0 |
| 4k |
|
Inactive | 0.9 ± 5.4 |
| 4l |
|
Inactive | 14.0 ± 15.5 |
| 4m |
|
Inactive | 4.3 ± 13.9 |
Antagonist activity at mGlu4 is assessed by measuring the ability of a compound to concentration-dependently inhibit an EC80 glutamate response. IC50 and % inhibition values are the average of at least three independent determinations performed in triplicate (mean ± SEM shown in table). Compounds were ranked as active if they inhibited the EC80 response by at least 20%.
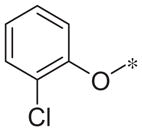
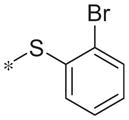
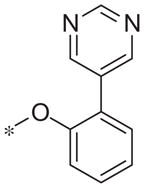
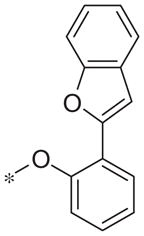
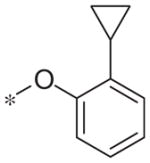
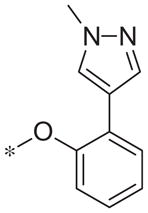
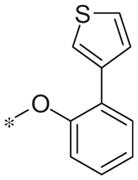
In contrast to the 4-chloro-3-pyridyl portion of the molecule, there was somewhat more tractable SAR on the right-hand aryl portion of the scaffold (Table 4). These compounds were either made in an analogous fashion as shown in Table 1, or, for the biaryl compounds, they were synthesized from compound 2e via a palladium- mediated Suzuki cross coupling.12 The ether could not be replaced by a thio-ether (5a) or an unsubstituted phenyl derivative (5b); however, the 2-bromo could be substituted with a 3-bromo without significant loss in potency or efficacy (5d, 7.7 ± 0.8 μM; 58.5% inhibition). 2-fluoro (5c), 3-methoxy (5e), 3-dimethyl amine (5f), 4-methyl (5h), 3-methyl ester (5g) and 4-methoxy (5i) groups were not tolerated. In contrast, 4-trifluoromethyl was similar in potency to the original antagonist (5j, 4.7 ± 0.5 μM; 59.8% inhibition). The SAR of the 2-substituted phenyl derivatives was not predictive and rather shallow. For example, the 2-phenyl and 2-(2-pyridyl) derivatives were active with weak inhibition (5n, >10 μM; 31.1% inhibition and 5o, 8.0 ± 0.9 μM; 60.0% inhibition, respectively). In contrast, the other two pyridyl regioisomers (5p and 5q), as well as a cyclohexyl or other replacements (5s, 5u, 5v, and 5x), were inactive. Several other compounds evaluated exhibited weak antagonist activity (5t; >10 μM, 56.2% inhibition, 5w; >10 μM; 36.5% inhibition).
Table 4.
| |||
|---|---|---|---|
| Compd | R1 | hmGlu4 EC50 (μM)a | % Inhibition |
| 5a |
|
Inactive | 12.0 ± 12.2 |
| 5b |
|
Inactive | −8.7 ± 4.2 |
| 5c |
|
Inactive | −10.7 ± 10.2 |
| 5d |
|
7.7 ± 0.8 | 58.5 ± 16.3 |
| 5e |
|
Inactive | −2.8 ± 5.0 |
| 5f |
|
Inactive | 4.4 ± 9.9 |
| 5g |
|
Inactive | 12.9 ± 13.2 |
| 5h |
|
Inactive | 16.9 ± 11.0 |
| 5i |
|
Inactive | −18.3 ± 12.0 |
| 5j |
|
4.7 ± 0.5 | 59.8 ± 14.6 |
| 5l |
|
Inactive | −17.0 ± 3.6 |
| 5m |
|
Inactive | −14.8 ± 8.7 |
| 5n |
|
>10 | 31.1 ± 15.8 |
| 5o |
|
8.0 ± 0.9 | 60.0 ± 9.4 |
| 5p |
|
Inactive | −3.4 ± 2.4 |
| 5q |
|
Inactive | −4.8 ± 6.4 |
| 5r |
|
Inactive | 7.8 ± 3.3 |
| 5s |
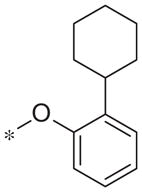
|
Inactive | 7.4 ± 5.2 |
| 5t |
|
>10 | 56.2 ± 12.7 |
| 5u |
|
Inactive | −10.4 ± 9.4 |
| 5v |
|
Inactive | −0.1 ± 4.6 |
| 5w |
|
>10 | 36.5 ± 13.7 |
| 5x |
|
Inactive | −7.1 ± 9.2 |
IC50 and % EC80 values are the average of at least three independent determinations performed in triplicate (mean ± SEM shown in table). Compounds were ranked as active if they inhibited the EC80 response by at least 20%.
To confirm that these compounds were specific to mGlu4, we counter screened the entire set against the original screening cell line which contains the human M4 muscarinic receptor co-expressed with Gqi5. No compounds significantly affected an EC20 response to the M4 agonist acetylcholine; 5r and 5s, which were inactive at mGlu4, weakly inhibited EC80 responses to ACh by 26% and 23%, respectively. As a further validation that these compounds were inhibitors of mGlu4, the lead antagonist for this series, VU0448383, was confirmed to be active in the rat mGlu4 thallium flux assay (Fig. 2). Although this antagonist, and the series in general, is of low potency, it is important to note that in our previous reports exploring the structure activity relationships of other mGlu4 PAM scaffolds (representing approximately 5,000 compounds), we have never observed a similar pharmacology ‘switch’ for mGlu4, suggesting that this compound represents a major advance as a tool compound for the study of mGlu4 biology.
Figure 2.

VU0448383 antagonizes glutamate induced responses in human mGlu4/Gqi5 cells (calcium assay) and rat mGlu4/GIRK cells (thallium assay) in a concentration-dependent fashion.
In conclusion, we have shown that slight structural modifications to a novel mGlu4 PAM scaffold lead to a ‘molecular switch’, resulting in a novel mGlu4 antagonist. Specifically, changing the 2,4-dihydroxyphenol to a 4-chloro-3-pyridyl moiety resulted in the switch from PAM to antagonist (2e). Further modifications of the 4-chloro-3-pyridyl moiety were not tolerated suggesting a shallow binding pocket for that portion of the molecule. The far right side of the molecule did allow for some modification; however, all compounds were shown to be equipotent with 2e. Although ‘molecular switches’ have been reported for other mGlu receptors, to our knowledge this is the first report for a Group III mGlu receptor, namely, mGlu4. Further studies are planned and will be reported in due course.
Acknowledgments
The authors acknowledge C. David Weaver, Emily Days, and Christopher Farmer of the Vanderbilt High Throughput Screening facility. This work was supported by Grants from the NIH and Michael J. Fox Foundation.
References and notes
- 1.Conn PJ, Christopoulos A, Lindsley CW. Nat Rev Drug Disc. 2009;8:41. doi: 10.1038/nrd2760. [DOI] [PMC free article] [PubMed] [Google Scholar]
- 2.Conn PJ, Lindsley CW, Jones C. Trends Pharm Sci. 2009;30:25. doi: 10.1016/j.tips.2008.10.006. [DOI] [PMC free article] [PubMed] [Google Scholar]
- 3.Hopkins CR, Lindsley CW, Niswender CM. Future Med Chem. 2009;1:501. doi: 10.4155/fmc.09.38. [DOI] [PMC free article] [PubMed] [Google Scholar]
- 4.Wood MR, Hopkins CR, Brogan JT, Conn PJ, Lindsley CW. Biochemistry. 2011;50:2403. doi: 10.1021/bi200129s. [DOI] [PMC free article] [PubMed] [Google Scholar]
- 5.Sharma S, Kedrowski J, Rook JM, Smith RL, Jones CK, Rodriguez AL, Conn PJ, Lindsley CW. J Med Chem. 2009;52:4103. doi: 10.1021/jm900654c. [DOI] [PMC free article] [PubMed] [Google Scholar]
- 6.Lamb JP, Engers DW, Niswender CM, Rodriguez AL, Venable DF, Conn PJ, Lindsley CW. Bioorg Med Chem Lett. 2011;21:2711. doi: 10.1016/j.bmcl.2010.11.119. [DOI] [PMC free article] [PubMed] [Google Scholar]
- 7.Schann S, Mayer S, Franchet C, Frauli M, Steinberg E, Thomas M, Baron L, Neuville P. J Med Chem. 2010;53:8775. doi: 10.1021/jm101069m. [DOI] [PubMed] [Google Scholar]
- 8.For information on the Molecular Libraries Probe Production Centers Network (MLPCN,) see: http://mli.nih.gov/mli/.
- 9.Calcium mobilization assays. FBS, 20 mM HEPES, 100 units/ml penicillin/streptomycin, and 1 mM sodium pyruvate (Plating Medium). The cells were grown overnight at 37 °C in the presence of 5% CO2. During the day of assay, the medium was replaced with 20 μL of 1 μM Fluo-4, AM (Invitrogen, Carlsbad, CA) prepared as a 2.3 mM stock in DMSO and mixed in a 1:1 ratio with 10% (w/v) pluronic acid F-127 and diluted in Assay Buffer (Hank’s balanced salt solution, 20 mM HEPES and 2.5 mM Probenecid (Sigma–Aldrich, St. Louis, MO)) for 45 min at 37 °C. Dye was removed and replaced with 20 μL of Assay Buffer. For concentration-response curve experiments, compounds were serially diluted 1:3 into 10 point concentration response curves and were transferred to daughter plates using the Echo. Test compounds were again applied and followed by EC20 concentrations of glutamate. Test compounds were transferred to daughter plates using an Echo acoustic plate reformatter (Labcyte, Sunnyvale, CA) and then diluted into Assay Buffer. Ca2+ flux was measured using the Functional Drug Screening System 6000 (FDSS6000, Hamamatsu, Japan). Baseline readings were taken (10 images at 1 Hz, excitation, 470 ± 20 nm, emission, 540 ± 30 nm) and then 20 μl/well test compounds were added using the FDSS’s integrated pipettor. Cells were incubated with compounds for approximately 2.5 min and then an EC20 concentration of glutamate was applied. Curves were fitted using a four point logistical equation using Microsoft XLfit (IDBS, Bridgewater, NJ). Thallium flux assays have been described in detail in Ref. 9.
- 10.Niswender CM, Johnson KA, Luo Q, Ayala JE, Kim C, Conn PJ, Weaver CD. Mol Pharmacol. 2008;73:1213. doi: 10.1124/mol.107.041053. [DOI] [PubMed] [Google Scholar]
- 11.All new compounds were characterized by LCMS and/or 1H NMR and found to be in agreement with their structures.
- 12.Miyaura N, Suzuki A. Chem Rev. 1995;95:2457. [Google Scholar]