Abstract
The diffusive transfer, or paracrine delivery, of chemical factors during the interaction of an emitting cell and a receiving cell is a ubiquitous cellular process that facilitates information exchange between the cells an/or to bystander cells. In the cellular immune response this exchange governs the magnitude and breadth of killing of cellular targets, inflammation or tolerance. Paracrine delivery is examined here by solving the the steady-state diffusion equation for the concentration field surrounding two intensely interacting, equi-sized cells on which surface kinetics limits the rates of factor emission and absorption. These chemical factors may be cytokines, such as Interlukins and Interferons, but the results are presented in a generic form so as to be applicable to any chemical factor and/or cell-type interaction. In addition to providing overall transfer rates and transfer efficiencies, the results also indicate that when the receiving cell is naïve, with few factor receptors on its surface, there may be a significant accumulation of factor in the synaptic region between the cells with a consequent release of factor to the medium where it can signal bystander cells. This factor accumulation may play a critical role in activating a naïve receiving cell. As the receiving cell activates and becomes more absorbent, the factor accumulation diminishes, as does potential bystander signaling.
Keywords: Biomedical engineering, Cellular biology and engineering, paracrine delivery, mathematical modeling, mass transfer, diffusive interactions
1. INTRODUCTION
It is well known that the diffusive transfer from volatile particles/droplets is affected by the proximity of their neighbors. When the interacting particles/droplets have the same composition, transfer is lower than the single, isolated rate. The effect of these diffusive interactions has been studied extensively over the years due to their relevance to atmospheric clouds/aerosols and liquid fuel spray combustion (see, for example, Sirignano, 2010; Annamalai and Ryan, 1992; Labowsky, 1976,1978,1980; Sangiovanni and Labowsky, 1982). Diffusive interactions, however, are also important in biological systems. Cells communicate and signal through the diffusive transfer, referred to as paracrine delivery, of certain chemical factors. For example, cytokine factors such as interlukin (IL-2, IL-10, IL-12), regulate the activation, stimulation, differentiation, and proliferation of T-cells to perform their proper immune response function (Pardoll, 2002; Sharpe and Abbas, 2006). Biological interactions (Huse et al. 2006; Huse et al. 2008), however, differ from those of volatile droplets in at least three significant ways: first, the interactions are much more intense due to the nano-range spacing between cells; second, the cells are animate and respond to their environment; and finally, interacting cells have different emission/absorption characteristics with an emitting cell (EMC) acting as a source and a receiving cell (REC) acting as a sink whereas volatile particles with the same composition experience source/source interactions. The terms EMC and REC used here are generic and may represent, for example, a T-cell interacting with an antigen-presenting cell (APC) (Grakoui et al. 1999; Monks et al. 1998) or an artificial APC (Kress et al. 2009; Steenbok and Fahmy, 2008) interacting with a Tcell (Steenblock et al. 2011). Indeed, the process of paracrine delivery is ubiquitous in cell biology and is used by other cell types such as neurons (Li et al. 2009; Robinson et al. 1996, Takeda et al. 2008) and epithelial cells (Lieblein et al. 2008; Jankoski, et al. 2007; Greiff et al. 2002) for specific chemical information transfer.
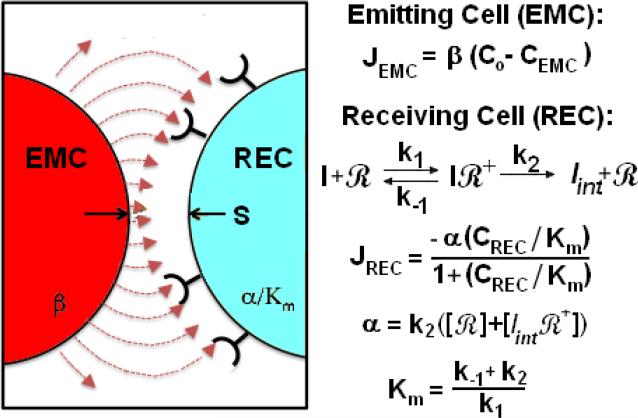
Paracrine delivery has been modeled in the past by treating the cells as perfect sources and sinks (Kress et al. 2009). While this approach is reasonable and amenable to solution using classical techniques like the Method of Images, it is incomplete because it only applies to cases where the transfer is diffusion-limited. A perfect source has a uniform factor surface concentration and an infinite capacity to supply factor. A perfect sink has an infinite capacity to absorb any factor that reaches its surface. Perfect/perfect interaction depends on geometric parameters such as relative size and intercellular separation. Transfer between biological cells, however, is not perfect/perfect but is limited by the finite surface kinetics. The rate at which the REC absorbs factor depends on the number and quality of the factor receptors on its surface. These receptors (schematically represented in Figure 1) may be viewed in a similar light as active sites on a catalyst pellet. During the initial phase of cellular interaction, the REC is often naïve with few if any receptors and, thus, unable to absorb factor. The result is an accumulation of factor in the synaptic region, the region between the cells. It is conjectured that bathing in this accumulated factor is necessary to activate a naïve cell (Steenblock et al. 2011;Grakoui et al. 1999; Dustin, 2002,2006). Over time, as the cell (REC) activates, more factor receptors slowly appear on its surface, resulting in increased absorption and decreased synaptic factor concentration. Further, any factor that cannot be absorbed by the kinetic limitations of the REC diffuses to the ambience and provides a chemical signal for neighboring bystander cells (Huse et al. 2006; Huse et al. 2008). It is important, therefore, to study cellular interactions in a more general way by including surface kinetics in the calculations. While it is desirable to examine arrays of interacting kinetically-limited cells, it is fundamentally important to understand the behavior of the basic unit in such arrays: a single EMC/REC pair as considered here.
Figure 1.
A schematic of paracrine delivery interaction between an EMC and an REC with a synaptic point separation of S. Red lines are representative flux-lines of the paracrine factor emitted by a first order rate law from the EMC towards the receiving cell. Diffusing factor binds and is internalized by the REC according to Michaelis-Menten kinetics. Transfer of factor is a function of emission (β) and absorption (α/Km, Km) rate constants.
The case of a cell that emits factor at a constant rate, interacting with a non-absorbing REC was examined in Steenblock et al. (2011). The results of these calculations were used, in part, to explain the experimentally observed increase in proliferation rates of CD8 T-cells when interacting with artificial APCs. This type of analysis will be extended below to the more general (and more challenging) cases of arbitrary emission and absorption characteristics. The results will be presented in dimensionless form, so they are not limited to a specific pair of cells, but may be applied to a range of chemical factors and interacting cell-types.
2. ASSUMPTIONS AND METHOD OF SOLUTION
The cells are assumed to be spherical and equi-sized with REMC (= RREC) denoting the radius of the EMC (and REC), and are separated at their synaptic point (SP), the point of closest contact, by a distance S (see Figure 1). It is further assumed that the concentration (C) of the diffusing factor is quasi-steady (QS), implying the C-field varies slowly with time in comparison with the characteristic diffusion time. The ambient medium is assumed to be factor-free (C∞=0) and non-reactibe with the factor. Under these conditions, the steady-state diffusion equation governing the C-field reduces to the Laplace Equation:
| (1) |
where the dimensionless concentration is
| (2) |
Dimensionless quantities are designated with an asterisk (*) when they have a dimensional counterpart. Distances are measured in units of REMC, thus: REMC*=1 (RREC*=RREC/REMC=1) and the dimensionless synaptic point separation (S*) is S/REMC. The Laplacian operator in Equation 1 is normalized by REMC2. The use of dimensionless quantities allows one calculation to be applied to many situations. For example, the S* = 0.005 results reported here, can be applied to two interacting 8μ diameter cells (typical of T-cells) separated by 20nm (typical cell separation), or two 4μ diameter cells separated by 10nm or the interaction of any other sized cells for which the spacing is proportional.
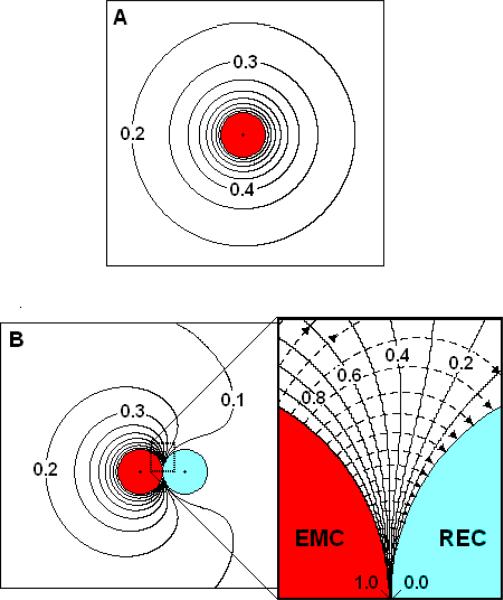
CEMCiso denotes the surface concentration of factor on the EMC if it were isolated (far away) from the REC. The QS field near an isolated EMC spherical cell is spherically symmetrical, with C* decreasing inversely with distance (r*) from the center of the cell [Figure 2a]. The transfer rate from an isolated EMC in a factor-free environment is:
| (3) |
where Dext is the diffusion coefficient of the factor in the surrounding medium. For a prefect/perfect, diffusion-limited, interaction, the problem would then be analogous to finding the electrostatic potential between two conducting spheres of unit size: one raised to a uniform potential of unity and the other uniformly at ground; and could perhaps be solved using some variant of the classical Method of Images (Labowsky 1976, 1978, 1980a, 1980b). Since for equi-sized cells the interaction would depend only on the geometric parameter, S*, a perfect/perfect model implies kinetic processes such as factor synthesis and absorption/internalization occur with characteristic times that are small in comparison with the characteristic intercellular diffusion time. That this is not the case consider that high-affinity IL-2 receptors, composed of alpha, beta, and gamma subunits, do not appear on the surface of an APC until approximately 24 hours following antigen encounter (Huse et. al. 2008; Malek, 2008; Sabatos, et. al. 2008). The characteristic diffusion time (S2/Dext) over a 20nm synaptic gap, on the other hand, is 4×10⁻⁵ sec using a Dext for IL-2 of 10μ2/sec.
Figure 2. The dimensionless concentration field (C*) and flux-lines near a perfect source and perfect sink.
(A) The C*-field surrounding an isolated EMC. (B) The C*-field (solid curves) and flux-lines (dashed curves) surrounding a perfect source and sink pair separated by S*=0.005. Inset: A close up view of the synaptic region.
In light of the limitations of a diffusion-limited calculation, finite surface kinetics must be considered. To this end, in the following, the local normal flux (JEMC= JEMC • en) is assumed to be first order dependent on the local EMC surface concentration (CEMC):
| (4) |
Co may be interpreted as an equilibrium surface concentration, at or above which JEMC is zero (JEMC= 0 if CEMC ≥Co) and β is the emission rate constant. This restriction is placed on Co because the EMC must be a net emitter of factor. If the factor is modeled as being released through surface receptors, then β= kon [REu] and Co = koff [REo]/kon [REu] where kon, koff are the receptor association and dissociation constants and [REo] are [REu] the number of occupied and unoccupied receptors per unit EMC surface area. These parameters need to be experimentally determined and appropriately expressed so that β has units of speed. Alternatively, if factor is modeled as diffusing through a membrane in order to be released, then Co is the internal reservoir concentration and β is the inverse diffusive resistance. In this case, β= Dint(REMC -δR/)(REMC δR) where Dint is the diffusion coefficient of the membrane and δR is the thickness of the membrane. Artificial cells as in Steenblock et al. 2011 are comprised of factor embedded in a plastic binder (PLGA). As the binder decomposes with time internally releasing the factor, the factor must then diffuse through the remaining outer part of the cell to reach the surface. This internal diffusion process is somewhat analogous to diffusion through a pseudo-membrane an effective and time-varying thickness.
In dimensionless form, the local normal EMC surface flux becomes:
| (5a) |
where
| (5b) |
is the dimensionless emission rate constant. By definition JEMC*=1 for an isolated EMC, hence Co* is related to β* by
| (5c) |
Thus, when β* <<1, Co*>>1. CEMC*, on the other hand, will be shown in Section 3.2 to be of order unity so in this limit JEMC* becomes a constant with a value of β*Co*, independent of interactions. Under these conditions, the EMC is referred to as a constant source. Except when the cells are “fresh” and the effective membrane thickness (δR) is small, the artificial cells used in Steenblock et.al, 2011 are examples of a constant source cell, because Dint for factor diffusion through the PLGA that comprises these cells is typically several orders of magnitude lower than Dext (Raman et al. 2005; Almeria et al. 2011) and so β will be small. A large Co* does not imply an absurdly large factor concentration, but only that Co is much greater than CEMC. While interactions do not affect the transfer rate of a constant source cell, they will result in a non-uniform surface concentration. CEMC* will, therefore, be a function of position on the surface.
Conversely, as will also be seen in Section 3.4, when β* >>1, both Co* and CEMC*->1 and the EMC behaves like a perfect source with a uniform surface concentration of unity. While the surface concentration is uniform and independent of interaction, the transfer rate will depend on the strength of the interaction. β* is, therefore, a measure of the “perfection” of the EMC.
Consider next, the REC. For this cell to be absorbent, a factor molecule must first bind to an unoccupied receptor on the cell's surface. Once bond, the factor can either desorb or be internalized. Another factor molecule cannot be absorbed at that site until the receptor recyles (or a new receptor appears). The surface kinetics on the REC depicted in Figure 1 depends on the rate constants for factor absorption (k1), factor desorption (k-1) and for the internalization of the factor and re-cycling of the receptor (k2). In Figure 1, R and IR+ represent unoccupied and occupied REC receptor sites, I represents the unbound factor, and Iint is internalized factor, respectively. Borrowing from the well-known Michaelis-Menten kinetics, the local normal surface flux on the REC (JREC*) is
| (6a) |
The absorption rate of the REC is, therefore, characterized by two kinetic parameters: the dimensionless maximal velocity,
| (6b) |
and the dimensionless Michaelis constant,
| (6c) |
where [RRT] is the concentration of the total number of receptors ([R] + [IR+]) on the REC. A more elaborate kinetic scheme can be used, but at the cost of additional independent variables.
As in catalysis, a large Km* implies the most of the receptors are unoccupied, while a small Km* implies a high occupancy. The ratio α*/Km* is a measure of the degree of “perfection” of the REC. When α*/Km*-> 0, the REC becomes non-absorbent with a non-uniform surface concentration (CREC). When α*/K*m (and Km*) is large the REC approaches a perfect sink with CREC*-> 0 uniformly on the surface. Note that both β* and α* depend inversely on Dext. When Dext is large, β* and α* tend to be small and the paracrine delivery is likely kinetic-limited. When Dext is small, β* and α* will tend to be large and the process is likely diffusion-limited. It is important to bear in mind that the QS analysis used here will reflect the fields near interacting cells at a given instant in time. As the REC activates and more high quality receptors appear on its surface, α*/Km* increases from a value near zero with time. β may also vary with time as the number of occupied cell receptors changes or, as in the case of artificial cells, as the outer part of the cell is depleted of factor and the effective membrane thickness increases. QS analysis does not preclude such changes, only that these changes occur on a time scale that is much less than the characteristic diffusion time.
The equivalent S* for the clouds/sprays previously studied is typically several orders of magnitude greater than the characteristic S*-values for cellular interactions. Cellular interactions, therefore, are much more intense than in clouds/sprays and coupled with the fact the cells are not perfect sources/sinks require a different numerical approach. Equation 1, subject to the surface conditions (Equations 5 and 6), is solved here using the boundary collocation method described in the Appendix. This method is similar to that in Steenblock, et al. (2011), but iteratively modified in light of the non-linear REC boundary condition (Equation 6a). Once Equation 1 is solved and C* is known everywhere, the EMC emission rate follows by integrating JEMC* over the surface of the EMC to obtain:
| (7) |
where ηEMC, the integral of JEMC* over the surface ((AEMC* = 4 π) of the EMC, is the dimensionless ratio of the actual to the isolated EMC emission rates. When ηEMC <1, ηEMC >1, or ηEMC =1, the emission rate is, respectively, less than, greater than, or equal to the rate of an isolated EMC. Similarly, the absorption rate of the REC can be written as:
| (8) |
where ηREC is the integral of -JREC* over the surface of the REC. When ηREC =0 the REC is non-absorbing and all emitted factor diffuses to the medium. An ηREC > 0 reflects the degree of absorbance. The larger the value of ηREC, the greater is the absorbance. A negative transfer rate indicates transfer to the cell and, hence, the minus sign in Equation 8.
3. RESULTS AND DISCUSSION
3.1 Perfect source/Perfect sink (diffusion-limited) interaction
The C*-field surrounding an isolated EMC is spherically symmetric and decreases inversely with distance from the cell (Figure 2a). The cell has a uniform surface concentration C*=1.0 (CEMC=CEMCiso). As the cell interacts with an REC, the C*-field is distorted. The degree of distortion depends on both geometric (S*) and kinetic parameters (β*α*, Km*).
For the limiting case of intensely interacting (S*=0.005) diffusion-limited (β*= 10000, α*/Km* =10000) transfer between nearly perfect source and sink cells, the surface concentrations (Figure 2b) are uniform (CEMC*=1.0 and CREC*=0.0) although the C*-field (solid curves) has lost its spherical symmetry. In the synaptic region (Figure 2b, inset), representative flux-lines (dashed curves with arrows) emanate from the EMC and mostly terminate on the REC. At the synaptic point (SP), the C*-curves are evenly spaced and the SP flux approaches that between two parallel plates (parp):
| (9) |
With S*=0.005, JEMCsp* = -JRECsp* ~ Jparp*= 200, indicating a very large SP diffusive flux directed from the EMC into the REC. The correction factors for a perfect/perfect pair are ηEMCpp = 2.3 and ηRECpp =1.6 yielding a transfer efficiency (E = 100 ηRECpp / ηEMCpp ) of 70%, meaning that 70% of the emitted factor is absorbed by the REC with only 30% diffusing to the medium where it is available to signal bystander cells.
3.2 Interactions with a constant source
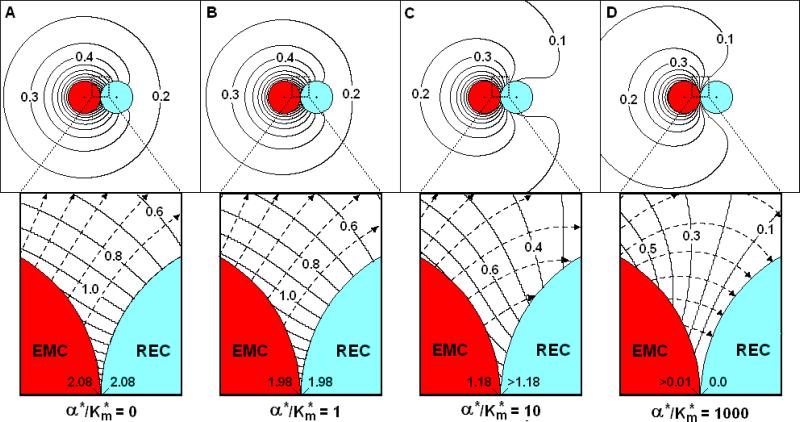
Given the fact that factors are transcriptionally regulated and hence emission is severely restricted, it is reasonable to expect an EMC to often behave as a constant source. Figures 3a-d show C*-fields for a constant source EMC (β* = 10-4) interacting with RECs with various values of α*/Km* (Km* = 0.05 in all figures) for the same geometric parameters (RREC*=1.0 and S*=0.005) as in Figure 2b. For a naïve non-absorbing REC (α*/Km* = 0, Figure 3a), the constant C*-curves intersect the cell surfaces, indicating a highly non-uniform surface concentration on both cells. The extent of this non-uniformity is particularly evident in the synaptic region (Figure 3a, inset). The SP concentrations (CEMCsp*, CRECsp*) are 2.08 for both cells. This means the factor accumulates in the synaptic region resulting in an SP concentration 2.08 times greater than that on the surface of an isolated EMC. The factor accumulation occurs because the non-absorbing REC impedes diffusion from the EMC, which emits factor at a constant rate, independent of interactions. Overcoming this increased diffusional resistance requires an enhanced diffusive driving force and, hence, a higher synaptic point concentration (CRECsp*). For type one cytokine transmission that are initially present at low concentration on the cell surface and have low affinity for the diffusing cytokine, it is suspected that this accumulation facilitates initial binding occupancy and hence will increase the absorption characteristics (α*/Km*) on the REC over time. As mentioned in Section 2, the number of receptors will increase with time, but at a rate that is sufficiently low to be within the constraints of the QS assumption.
Figure 3. The concentration field (C*) and diffusion flux-lines near a constant source EMC and RECs with various absorbencies.
β*=10-4, Km*=0.05, S*=0.005, RREC*=1.0: (A) α*/Km*=0; (B) α*/Km*=1.0; (C) α*/Km*=10; (D)α*/Km*=1000. Insets: Close up views of the synaptic region.
The fact that CEMCsp* = CRECsp* means JRECsp* = 0 and there is no inter-cellular synaptic point transfer, nor transfer anywhere on the REC surface. Surface concentrations decrease with distance from the SP indicating the presence of a large tangential concentration gradient along the REC. This tangential gradient give rise to diffusional flux-lines that leave the EMC but do not intersect the non-absorbing REC, yielding ηREC = 0.
In time, as the REC becomes more absorbent (α*/Km* = 1.0, Figure 3b), the C*-curves shift slightly but still intersect both cells indicating non-uniform surface concentrations. CEMCsp* and CRECsp* decrease 1.98. The flux-lines tend to avoid the REC with only 4.4% (ηREC = 0.044) of the emitted factor absorbed by the REC.
As α*/Km* increases to 10 (Figure 3c), there is significant change in the C*-field as the REC absorbs more factor. On the backside of the EMC, opposite the synaptic point, CEMC*~0.9, less than that for an isolated cell. At the synaptic point, CEMCsp* and CRECsp* have significantly decreased with CRECsp* slightly less than the CEMCsp* value of 1.18. CEMCsp* decreases so as to maintain the constant EMC flux (ηEMC=1). Most of the synaptic flux-lines intersect the REC, resulting in ηREC =0.32, or an efficiency of 32% with 68% of the factor diffusing to the medium and available to signal bystander cells. The constant C*-curves still intersect both cells, but are more spaced out indicative of a diminished tangential surface gradient.
Finally, if the REC becomes highly absorbent (α*/Km* = 1000, Figure 3d), the C*-curves no longer intersect but surround the REC which has a uniform surface concentration near zero, similar to the perfect sink in Figure 2b. The C*-curves, however, still intersect the EMC indicating a non-uniform surface concentration on that cell. The striking feature of Figure 3d is that synaptic region is depleted of the factor. CEMCsp* is not unity, as in the case for the perfect source, but is essentially zero. This behavior is a consequence of the near perfection of the REC and the constant source nature (ηEMC = 1.0) of the EMC. The EMC is only capable of emitting factor at a fixed rate. Any factor that is emitted near the SP is quickly absorbed by the REC, resulting in the depletion of synaptic factor.
In summary, during early stages of cellular interactions, if the REC is non-absorbing, factor accumulates in the synaptic region, giving rise to a concentration gradient that drives the factor from the synaptic region to the ambient medium, where it can signal bystander cells. With time, as the REC presents more high affinity receptors, its absorption capability increases and synaptic factor is depleted. While the REC in Figure 3d is essentially perfect, JRECsp* (≈ -1) is 200 times smaller in magnitude than in Figure 2a. Further, ηREC = 0.474, yielding a transfer efficiency of 47.4%. So, even when the REC is highly absorbent, the transfer characteristics are far from those of a perfect/perfect, diffusion-limited, pair
3.3 Effect of spacing (S*)
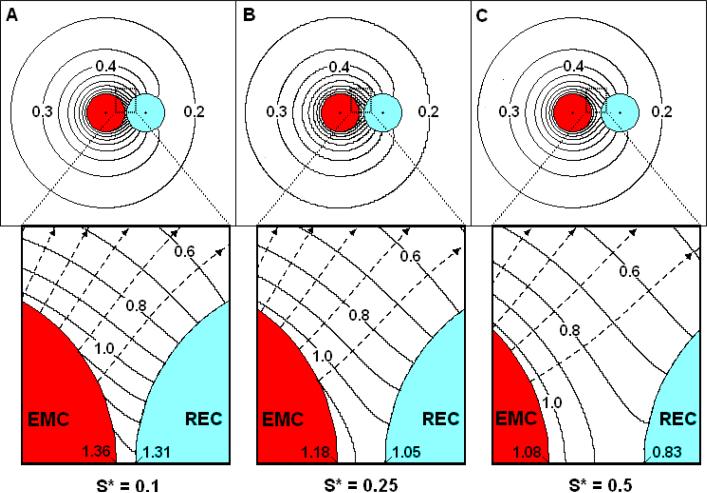
The accumulation of factor in the synaptic region is a sensitive function of cell spacing as may be seen from a comparison of Figure 4a-c with Figure 3a (constant source EMC/non-absorbing REC). When S* is 0.1 (Figure 4a), a fairly close spacing, CRECsp* is 1.31 compared with the 2.08 when S*=0.005. CRECsp* decreases significantly to near 1.05 and 0.83 as S* increases to 0.25 (Figure 4b) and 0.5 (Figure 4c), respectively. It should be noted that the EMC surface concentration has a nearly uniform concentration of unity, approaching that of an isolated EMC, when S* = 0.5 (Figure 4c).
Figure 4. Effect of cell-cell spacing on the concentration profiles near a constant source EMC and a non-absorbing REC.
β*=10-4, Km*=0.05, RREC*=1.0, α*/Km*=0: (A) S*=0.1; (B) S*=0.25; (C) S*=0.5. Insets: Close up views of the synaptic region.
The possibility arises that when spacing is sufficiently small, the cells may deform, increasing the synaptic contact area. Increased synaptic area increases diffusional resistance thus increasing CRECsp* in order to provide a diffusive driving force sufficient to expel the synaptic factor. The accumulation effect, therefore, will be considerably enhanced if the cells deform during interaction.
3.4 Interactions with a non-absorbing cell
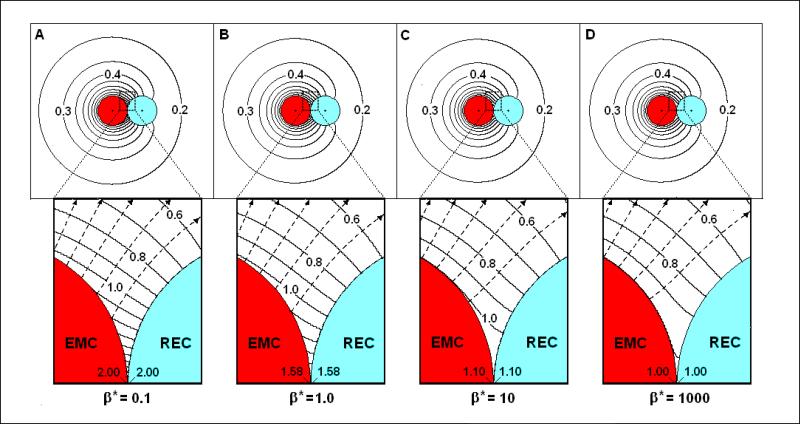
By comparing Figures 5a-d with Figure 3a the effects of β* on the concentration field near a non-absorbing REC (α*/Km*=0, S*=0.005) can be seen. Note first that Figure 5a (β*= 0.1) is nearly the same as Figure 3a (β*=10-4). This means that a three order of magnitude increase in β* has only a slight effect on the C*-fields. As β* increases to 1 (Figure 5b) and then to 10 (Figure 5c), these effects become more evident with CRECsp* decreasing to 1.58 and 1.1, respectively.
Figure 5. The concentration field (C*) and flux-lines near EMCs with varying emission and a non-absorbing REC.
α*/Km*=0, Km*=0.05, RREC*=1.0, S*=0.005: (A) β*=0.1; (B) β*=1; (C) β*=10; (D) β*=1000. Insets: Close up views of the synaptic region.
While Figure 3d shows the fields surrounding a constant source and a nearly perfect sink cell, Figure 5d shows the opposite: a nearly perfect EMC (β*=1000) interacting with a non-absorbing (α*/Km* = 0) REC. In this case, the EMC has a mostly uniform surface C* of unity while the REC has a non-uniform surface concentration. At the synaptic point, C* is essentially unity on both cells, but decreases with distance from the SP along the surface of the REC. ηEMC is found to be 0.96, so the emission rate is less than that of an isolated EMC, indicating that interaction with a non-absorbing REC inhibits overall emission.
3.4 Overall transfer rates calculations
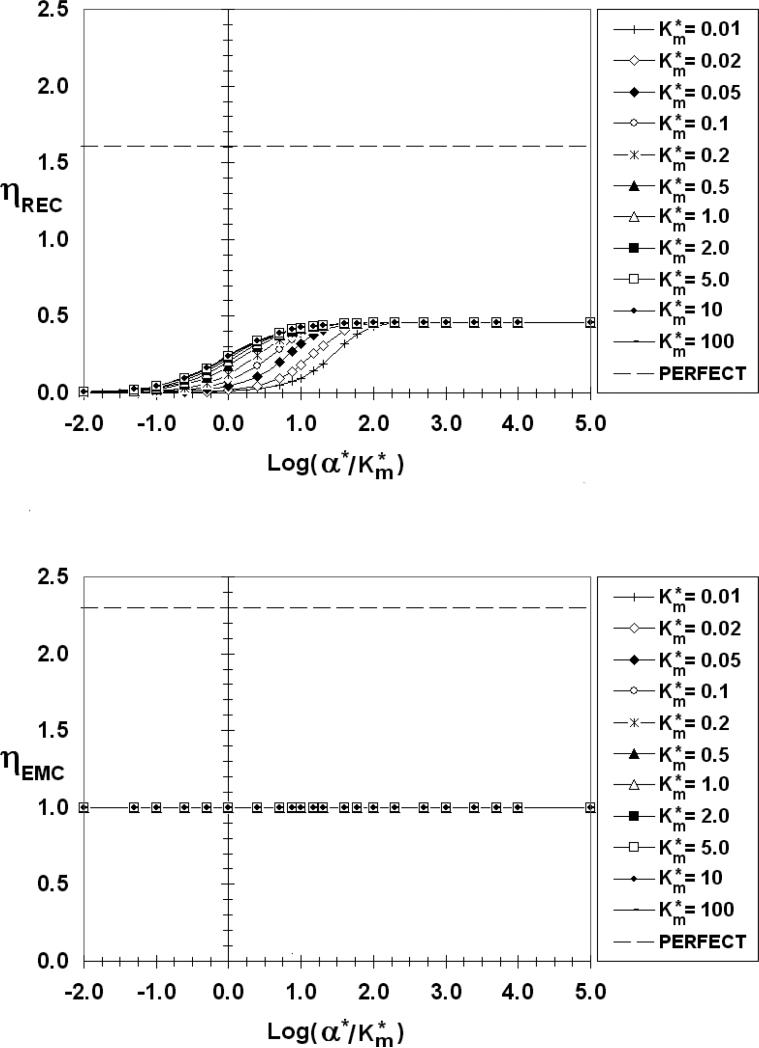
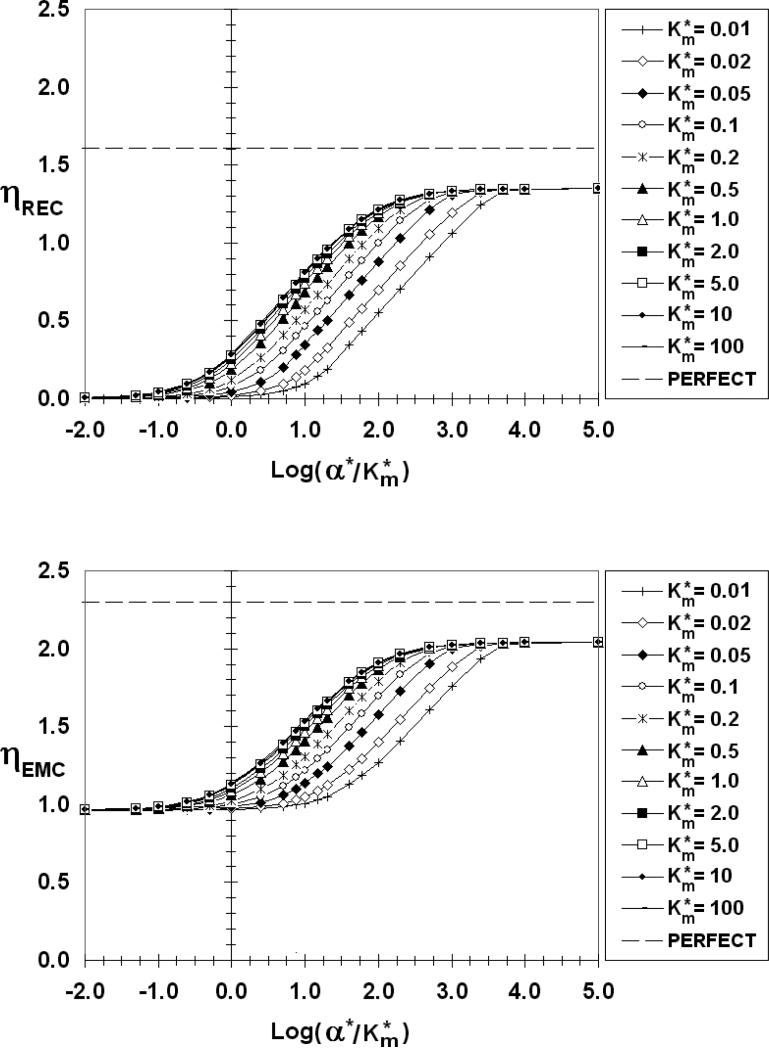
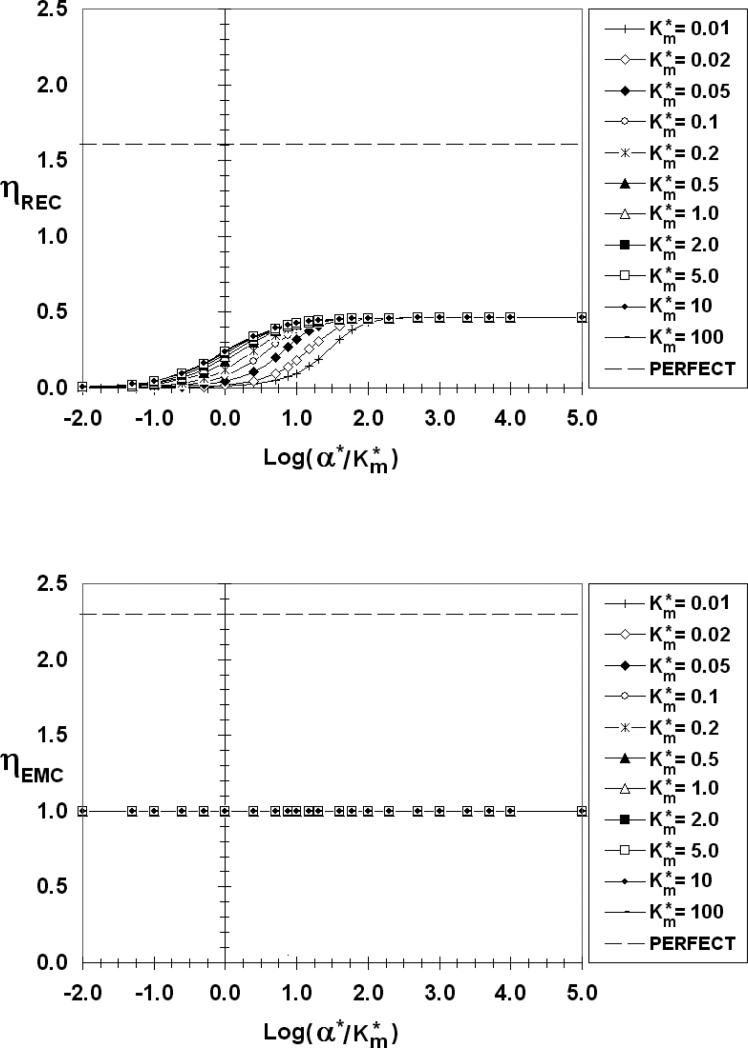
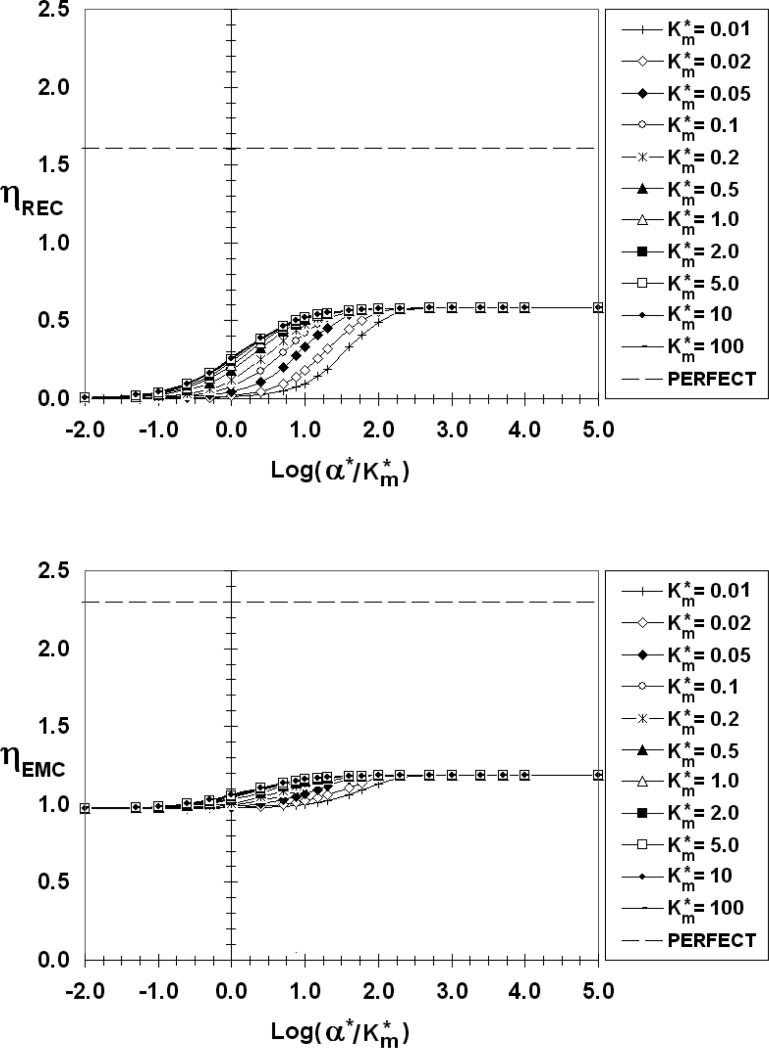
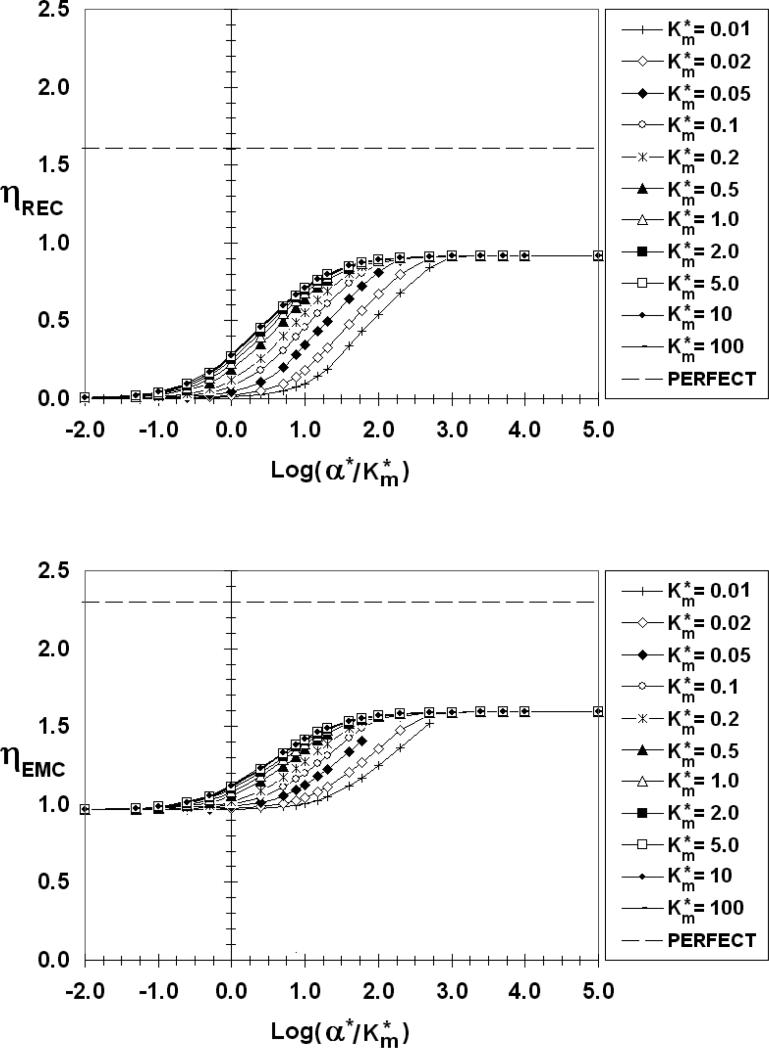
The above observations are shown quantitatively over a wide range of kinetic parameters in Figures 6-10 where ηREC (top) and ηEMC (bottom) are presented as functions of log(α*/Km*) for S*=0.005 and the indicated values of β*. The abscissa ranges from -2 to 5 covering α*/Km* values from 0.01 to 105. Each figure contains several curves for values of Km*, from 0.01 to 100.
Figure 6.
ηREC (top) and ηEMC (bottom) as a function of log(α*/Km*), β*=10-4,S*=0.005
Figure 10.
ηREC (top) and ηEMC (bottom) as a function of log(α*/Km*), β*=100, S*=0.005
The first observation that should be made is ηREC for β*=10-4(Figure 6) and 0.01 (Figure 7) are virtually identical over the entire range of α*/Km* and Km*. ηEMC, on the other hand, flat-lines at unity for these values of β*, reflecting the transfer properties of a constant source cell.
Figure 7.
ηREC (top) and ηEMC (bottom) as a function of log(α*/Km*), β*=0.01,S*=0.005
There are common features to all of the ηREC figures. As reflected in Figure 3, ηREC increases from zero for low values of α*/Km*, then increases with increasing absorbency (α*/Km*) before reaching a maximum value plateau, corresponding to a perfect sink (ηRECmax) at large values of α*/Km*. When α*//Km* is low, the REC is poorly absorbent and most of the emitted factor diffuses to the medium (E ≈ 0) where it can chemically signal bystander cells. For Km* > 1 (low receptor occupancy) ηREC is practically independent of Km*. For Km* < 1 (high receptor occupancy), on the other hand, ηREC depends on both α*/Km* and Km*. Even the lowest calculated curve (Km*=0.01), however, eventually merges with the others and plateaus at the same ηRECmax provided α*/Km* is sufficiently high. The data point corresponding to Figure 3d, (β*=10-4, Km*=0.05, α*/Km*=1000) falls on this perfect sink plateau in Figure 6. From a comparison of Figures 6-10 it is clear that ηRECmax increases as the emitting cell becomes a more perfect source (increasing β*. ηRECmax has values of 0.46, 0.58, 0.92, and 1.35 for β* = 10-4 (and 0.01), 1, 10, and 100, respectively.
Looking next at the ηEMC we find that for β*≤0.01 (Figures 6 and 7), ηEMC=1, independent of α*/Km* and Km*, a reflection of the constant flux nature of EMCs in this low β* range. As β* increases, however, the ηEMC become increasing dependent on the REC absorption characteristics, increasing from a minimum value (ηEMCmin) at low α*/Km* to a maximum value (ηEMCmax) as the REC approaches a perfect sink. As with ηREC, there is a common ηEMC curve for Km*>1. The curves of smaller values of Km* eventually merge with this common Km* curve at a sufficiently high α*/Km*. For β* =1 (Figure 8), 10 (Figure 9), 100 (Figure 10), ηEMCmin and ηEMCmax are: 0.98 and 1.19; 0.96 and 1.59; 0.96 and 2.04; respectively. As β* increases, the difference between Co and CEMCiso decreases. For β*> 0.1, CEMCiso is of the same order as Co so changes in CEMC due to interactions may affect JEMC*. When β*=10 (Figure 9), for example, Co*=1.1 (Equation 5c). Even a slight change in CEMC* for this β* will have a measured effect on the emission rate. If, on average, CEMC*<1 (CEMC < CEMCiso) ηEMC will be greater than 1. Conversely, if, on average, CEMC* >1 (CEMC > CEMCiso) ηEMC will be less than 1, explaining the values of ηEMCmin that are less than unity. This is true even for a “constant source,” except in this case with β*<<1 and Co*>>CEMC*, the deviation of ηEMC from unity is insignificant. If β* is large and the REC is non-absorbing (Figure 5d) the REC impedes diffusion from the EMC, thereby increasing the synaptic factor concentration and lowering ηEMC.
Figure 8.
ηREC (top) and ηEMC (bottom) as a function of log(α*/Km*), β*=1, S*=0.005
Figure 9.
ηREC (top) and ηEMC (bottom) as a function of log(α*/Km*), β*=10, S*=0.005
The dashed lines in Figures 6-10 are the respective η values (ηRECpp =1.6, ηEMCpp =2.3) for a perfect source and perfect sink (pp) pair. The ηRECmax and ηEMCmax fall well below these perfect source/sink limits even when one or the other has very fast surface kinetics. The degree of perfection increases as β* increases, but even for β* as large as 100 (Figure 10), the values of ηRECmax and ηEMCmax are measurably lower than the perfect/perfect limits. The perfect/perfect model for paracrine delivery, therefore, is only applicable in a very limited range.
For biological EMCs, large β*-values may be possible if the cells have the capability to produce factor in sufficient quantity to meet the demand of a strongly absorbing REC. A biological cell is different than an artificial one due to its ability to hasten the production of factor in response to an interaction. Artificial cells, on the other hand, consist of factor-impregnated polymer. The emission rates from these types of cells are fixed by: polymer degradation to release the factor and internal diffusion of the released factor from the interior to the surface of the cell. The effective internal diffusion coefficients for these types of cells are extremely low (Raman et al. 2005; Almeria et al. 2011) and typically several orders of magnitude lower than Dext. Emission is limited, therefore, not by inter-cellular but intra-cellular diffusion. Realistically, however, it is not expected that any cell, biological or artificial, would be able to produce factor at a rate sufficient to satisfy the demand of a perfect sink. Thus even for biological emitting cells, it is anticipated that there is a maximum finite value of β*.
The above discussion has been in terms of “concentrations.” It should be mentioned that the concentrations of factors near biological cells are often in the pM, or lower, range. At these concentrations, a snapshot of the region near a micron-sized cell may reveal few if any factor molecules at any instant in time. In this case, the calculated concentrations must, therefore, be viewed in a probabilistic sense, with regions of higher calculated concentration having a great probability of having a molecule in any given snapshot than a region of lower calculated concentration.
4. CONCLUSIONS
The diffusive transfer, or paracrine delivery, of a chemical factor between an emitting cell (EMC) interacting with a receiving cell (REC) is a complex phenomenon that depends on several independent variables, physical, geometric, and kinetic. Modeling this phenomenon as a perfect source/perfect sink pair, however, will greatly over-estimate the rate of paracrine delivery and would not reveal the important effects mentioned here of synaptic factor accumulation and chemical signaling to bystander cells. Indeed perfect/perfect transfer, governed by geometric variables, is a limiting case in which diffusion through the medium controls the transfer process.
Emitting cells (Tcells, APCs) are likely to behave as kinetically-limited sources or even constant source cells because factor production is transcriptionally regulated or, in the case of artificial cells, limited by intra-cellular diffusion. The behavior of the RECs, on the other hand, will depend on the number and quality of surface receptors, the rate at which the transferred factor can be cleared by binding, and internalization. For type I cytokines, in the early phase of paracrine delivery, there may be few receptors and the REC is expected to be poorly absorbing resulting in significant accumulation of factor in the synaptic region.
The results presented here are in terms of dimensionless variables so they may be applied to interactions involving a wide variety of factors, cell sizes, and/or cell-types. Knowing the transfer rates, the efficiency of transfer can be determined to see what percentage of the factor is absorbed by the REC with the balance available for transfer to bystander cells. Further, while synaptic factor accumulation is conjectured to activate a naïve cell, the above calculations provide the amount of accumulation that may be expected so this conjecture can be reasonably assessed.
Even though the surface kinetic laws are simple, the results are striking in that they imply two directionally distinct pathways for transmission of an emitted chemical factor. The first is a pathway that involves direct synaptic transmission and indeed certain cytokine factors such as IL-2, IL-10, and Interferon gamma, are directionally secreted in the synapse upon T cell encounter with antigen. A second pathway releases inflammatory factors away from the synaptic junction to signal/attract bystander cells to the source of inflammation.
Future work should include not only incorporating more sophisticated kinetics and thoroughly exploring the effects of relative cell size, spacing, medium concentration, and cell deformation, but also experimentally determining reasonable values for the various kinetic parameters used here. Even without this additional robustness however, the above analysis hints at one possible means by which cells can modulate both pathways depending on the kinetics of absorption (availability of target receptors) of the REC or the emission rate (transcriptional synthesis of the factor) of the EMC.
HIGHLIGHTS.
Calculation of the concentration field near intensely interacting cells
Results show the effects of surface kinetics on intercellular concentration
Results show the effects of surface kinetics on transfer rates
Significant accumulation of transferred factor may occur near naïve cells
Perfect source/perfect sink interaction model is of limited utility
ACKNOWLEDGEMENTS
Partial funding for this work was provided by an NSF Career Award to T.M.F (0747577) and by an NIH Autoimmunity Center of Excellence Pilot Award to T.M.F.
NOTATION
- *
Denotes a dimensionless quantity with a dimensional counterpart
- C
Concentration of chemical factor
- CEMCiso
Concentration of factor on the surface of an isolated EMC
- CEMC
Local surface concentration of factor on an EMC
- CREC
Local surface concentration of factor on a REC
- CEMCsp
Surface concentration at the synaptic point on the EMC
- CRECsp
Surface concentration at the synaptic point on the REC
- Co
Equilibrium concentration/concentration of factor inside the cell
- C∞
Concentration of factor in the medium far from the cell
- C*
Dimensionless concentration of factor (C/CEMCiso)
- Dext
Diffusion coefficient of factor in the medium
- Dmem
Diffusion coefficient of factor in a membrane
- en
unit vector normal to the cell surface
- I
Represents an unbound factor molecule
- Iint
Represents a factor molecule internalized in the REC
- [IR+]
Number of bound factor molecules per unit area of REC
- J
Molar flux of factor
- JEMC
Local normal flux on the surface of the EMC
- JREC
Local normal flux on the surface of the REC
- k1
Rate constant for factor absorption (binding) on the REC
- k-1
Rate constant for factor desorption (unbinding) on the REC
- k2
Rate constant for internalization on the REC
- kon
Association constant for EMC receptors
- koff
Dissociation constant for EMC receptors
- Km
Michaelis constant
- M
Overall cell transfer rate
- No
Avogadro's number
- N
Total number of ring singularities
- qi
Strength of ith ring singularity
- REMC
Radius of the EMC
- RREC
Radius of the REC (= REMC)
- [RRT]
Total number of receptors per unit surface area of the REC
- [R]
Number of unoccupied receptors per unit area of the REC
- [REu]
Number of unoccupied receptors per unit area of the EMC
- [REo]
Number of occupied receptors per unit area of the EMC
- Rc
Radius of a ring singularity
- S
Synaptic gap width
- S*
Dimensionless synaptic gap width (S/REMC)
Greek Symbols
- α
Michaelis-Menten maximal velocity
- β
EMC emission rate constant
Abbreviations/Subscripts
- APC
Antigen presenting cell
- EMC
Refers to the emitting cell
- ISO
Refers to an isolated cell
- PP
Refers to a perfect source/perfect sink pair
- Parp
Refers to two parallel plates
- REC
Refers to the receiving cell
- SP
Synaptic point
APPENDIX: Method of solution details
The problem is to solve the Laplace equation (Equation 1) subject to the boundary conditions represented by Equation 5 on the EMC and Equation 6 on the REC. While β*, α*, and Km* are known or are, in principle, knowable apriori, the local surface concentrations (CEMC* and CREC*) are not. Further, these concentrations will not be uniform and will vary from point to point along the cell surfaces. An additional complication arises because the boundary condition on the REC (Equation 6) is non-linear.
A boundary collocation method is used. The field close to a point or ring singularity satisfies the Laplace equation. Since the Laplace equation is linear, a solution can be crafted by superimposing the fields of a series of singularities of suitable strength so as to satisfy the prescribed boundary conditions.
In a boundary collocation method, the boundary conditions are satisfied at N discrete points [Labowsky et al., 2000; Labowsky, 2010]. While the BCs are not satisfied precisely everywhere, by choosing N to be sufficiently large, a reasonable solution may be obtained. The concentration at any point (x*) between the cells can then be expressed as series:
| (A1) |
where qi is the strength of the ith singularity and fi(x*) is the field contribution at x* of that singularity when qi were equal to unity. Since the problem is axially symmetric, it is convenient to use ring singularities. The field close to a ring singularity of unit strength is:
| (A2) |
Where K(z) is the complete elliptical integral of the first kind, Rc* is the radius of the ring, and a* and r* are the axial and radial distances from the center of the ring to the x* point.
N equations for the N unknown values of qi are found by satisfying the boundary conditions at N discrete points. Since the boundary condition in Equation 6a is non-linear, an iterative scheme must be employed with the surface concentrations found in a prior iteration used to obtain a better solution in the next iteration. If the jth collocation point is on the EMC:
| (A3) |
where fij is field contribution of the ith singularity at the jth collocation point. gij is the gradient contribution of fij normal to the surface at the jth collocation point.
If the jth collocation point is on the REC then:
| (A4) |
where CREC*j,n-1 is the surface concentration at jth collocation point from the previous (n-1th) iteration.
Equations A3 and A4 represent N linear equations that can be solved for the N unknown qi. Knowing the qi, the surface concentrations at the N points can be calculated from Equation A1. These new values are then substituted into Equation A3 and A4 and the process iteratively repeated until the surface concentrations vary by less than 1% from the previous iteration. Once the qi are known, the field anywhere on the surface or between the cells can be found from Equation A1. Knowing the surface concentrations, the local fluxes follow from Equations 5 and 6, and the correction factors ηEMC and ηREC are calculated by integrating the normal surface flux over the surfaces of the respective cells.
The ring singularities were arranged on a “singularity sphere” that is roughly 95% of the radius inside a given cell. The radius of the singularity sphere is an important computational variable and is found by trial and error. If the radius is too large, then large variations between the collocation points may occur. If the radius is too small, then round-off errors become troublesome. Using a roughly 4 degree singularity separation, the maximum error in C* at the midpoint between two collocation points was found to be less than 1% in most cases.
Footnotes
Publisher's Disclaimer: This is a PDF file of an unedited manuscript that has been accepted for publication. As a service to our customers we are providing this early version of the manuscript. The manuscript will undergo copyediting, typesetting, and review of the resulting proof before it is published in its final citable form. Please note that during the production process errors may be discovered which could affect the content, and all legal disclaimers that apply to the journal pertain.
AUTHOR'S CONTRIBUTIONS:
Labowsky: Developed mathematical model and method of solution.
Fahmy: Analysis of results
REFERENCES
- Almeria B, Fahmy TM, Gomez A. A multiplexed electrospray process for single-step synthesis of stabilized polymeric drug delivery particulates. J.Control Release. 2011;154:203–10. doi: 10.1016/j.jconrel.2011.05.018. [DOI] [PubMed] [Google Scholar]
- Annamalai K, Ryan W. Interactive processes in gasification and combustion. Part 1:Liquid drop arrays and clouds. Progress in Energy and Combustion Science. 1992;18:221–295. [Google Scholar]
- Dustin ML. The immunological synapse. Arthritis research. 2002;4(Suppl 3):S119–125. doi: 10.1186/ar559. [DOI] [PMC free article] [PubMed] [Google Scholar]
- Dustin ML. Impact of the immunological synapse on T cell signaling. Results and problems in cell differentiation. 2006;43:175–198. doi: 10.1007/400_019. [DOI] [PubMed] [Google Scholar]
- Grakoui A, Bromley SK, Sumen C, Davis MM, Shaw AS, Allen PM, Dustin ML. The immunological synapse: a molecular machine controlling T cell activation. Science. 1999;285:221–227. doi: 10.1126/science.285.5425.221. [DOI] [PubMed] [Google Scholar]
- Greiff AH, Fischer WM, Sehgal I. Paracrine communication between malignant and non-malignant prostate epithelial cells in culture alters growth rate, matrix protease secretion and in vitro invasion. Clinical & experimental metastasis. 2002;19:727–733. doi: 10.1023/a:1021304700234. [DOI] [PubMed] [Google Scholar]
- Huse M, Lillemeier BF, Kuhns MS, Chen DS, Davis MM. T cells use two directionally distinct pathways for cytokine secretion. Nature immunology. 2006;7:247–255. doi: 10.1038/ni1304. [DOI] [PubMed] [Google Scholar]
- Huse M, Quann EJ, Davis MM. Shouts, whispers and the kiss of death: directional secretion in T cells. Nature immunology. 2008;9:1105–1111. doi: 10.1038/ni.f.215. [DOI] [PMC free article] [PubMed] [Google Scholar]
- Jankowski V, Karadogan S, Vanholder R, Nofer JR, Herget-Rosenthal S, van der Giet M, Tolle M, Tran TN, Zidek W, Jankowski J. Paracrine stimulation of vascular smooth muscle proliferation by diadenosine polyphosphates released from proximal tubule epithelial cells. Kidney international. 2007;71:994–1000. doi: 10.1038/sj.ki.5002186. [DOI] [PubMed] [Google Scholar]
- Kress H, Park J, Mejean C, Forster J, Park J, Walse S, Zhang Y, Wu D, Weiner D, Fahmy TM, Dufresne E. Cellular Stimulation with optically manipulated microsources. Nature Meth. 2009;6(12):905–9. doi: 10.1038/nmeth.1400. [DOI] [PMC free article] [PubMed] [Google Scholar]
- Labowsky M. Effects of Nearest Neighbor Interactions on Evaporation Rate of Cloud Particles. Chemical Engineering Science. 1976;31:803–813. [Google Scholar]
- Labowsky M. Formalism for Calculating Evaporation Rates of Rapidly Evaporating Interacting Particles. Combustion Science and Technology. 1978;18:145–151. [Google Scholar]
- Labowsky M. Calculation of the Burning Rates of Interacting Fuel Droplets. Combustion Science and Technology. 1980a;22:217–226. [Google Scholar]
- Labowsky M. Transfer Rate Calculations for Compositionally Dissimilar Interacting Particles. Chemical Engineering Science. 1980b;35:1041–1048. [Google Scholar]
- Labowsky M. A model for solvated ion emission from electrospray droplets. Rapid Communications in Mass Spectrometry. 2010;24:3079–3091. doi: 10.1002/rcm.4738. [DOI] [PubMed] [Google Scholar]
- Labowsky M, Fenn JB, de la Mora JF. A continuum model for ion evaporation from a drop: effect of curvature and charge on ion solvation energy. Analytica Chimica Acta. 2000;406:105–118. [Google Scholar]
- Li W, Li P, Hua Q, Hou J, Wang J, Du H, Tang H, Xu Y. The impact of paracrine signaling in brain microvascular endothelial cells on the survival of neurons. Brain research. 2009;1287:28–38. doi: 10.1016/j.brainres.2009.06.057. [DOI] [PubMed] [Google Scholar]
- Lieblein JC, Ball S, Hutzen B, Sasser AK, Lin HJ, Huang TH, Hall BM, Lin J. STAT3 can be activated through paracrine signaling in breast epithelial cells. BMC cancer. 2008;8:302. doi: 10.1186/1471-2407-8-302. [DOI] [PMC free article] [PubMed] [Google Scholar]
- Malek TR. The biology of interleukin-2. Annual review of immunology. 2008;26:453–479. doi: 10.1146/annurev.immunol.26.021607.090357. [DOI] [PubMed] [Google Scholar]
- Monks CR, Freiberg BA, Kupfer H, Sciaky N, Kupfer A. Three-dimensional segregation of supramolecular activation clusters in T cells. Nature. 1998;395:82–86. doi: 10.1038/25764. [DOI] [PubMed] [Google Scholar]
- Pardoll DM. Spinning molecular immunology into successful immunotherapy. Nature reviews. Immunology. 2002;2:227–238. doi: 10.1038/nri774. [DOI] [PubMed] [Google Scholar]
- Raman C, Berland C, Kim K, Pack D. Modeling small molecule release from PLG microspheres: effects of polymer degradation and nonuniform drug distribution. J. of Controlled Release. 2005;103:149–158. doi: 10.1016/j.jconrel.2004.11.012. [DOI] [PubMed] [Google Scholar]
- Robinson M, Buj-Bello A, Davies AM. Paracrine interactions of BDNF involving NGF-dependent embryonic sensory neurons. Molecular and cellular neurosciences. 1996;7:143–151. doi: 10.1006/mcne.1996.0011. [DOI] [PubMed] [Google Scholar]
- Sabatos CA, Doh J, Chakravarti S, Friedman RS, Pandurangi PG, Tooley AJ, Krummel MF. A synaptic basis for paracrine interleukin-2 signaling during homotypic T cell interaction. Immunity. 2008;29:238–248. doi: 10.1016/j.immuni.2008.05.017. [DOI] [PMC free article] [PubMed] [Google Scholar]
- Sangiovanni JJ, Labowsky M. Burning times of linear fuel droplet arrays:a comparison of experiment and theory. Combustion and Flame. 1982;47:15–30. [Google Scholar]
- Sharpe AH, Abbas AK. T-cell costimulation--biology, therapeutic potential, and challenges. The New England journal of medicine. 2006;355:973–975. doi: 10.1056/NEJMp068087. [DOI] [PubMed] [Google Scholar]
- Sirignano WA. Fluid Dynamics and transport of droplets and sprays. Cambridge University Press; Cambridge: 2010. [Google Scholar]
- Smith-Garvin JE, Koretzky GA, Jordan MS. T cell activation. Annual review of immunology. 2009;27:591–619. doi: 10.1146/annurev.immunol.021908.132706. [DOI] [PMC free article] [PubMed] [Google Scholar]
- Steenblock E, Fahmy TM. A comprehensive platform for T cell stimulation based on biodegradable artificial antigen-presenting cell microparticles. Molecular Therapy. 2008;16:765–72. doi: 10.1038/mt.2008.11. [DOI] [PubMed] [Google Scholar]
- Steenblock ER, Fadel T, Labowsky M, Pober JS, Fahmy TM. An artificial antigen-presenting cell with paracrine delivery of IL-2 impacts the magnitude and direction of the T cell response. J Biol Chem. 2011;286:34883–92. doi: 10.1074/jbc.M111.276329. [DOI] [PMC free article] [PubMed] [Google Scholar]
- Takeda M, Takahashi M, Matsumoto S. Contribution of activated interleukin receptors in trigeminal ganglion neurons to hyperalgesia via satellite glial interleukin-1beta paracrine mechanism. Brain, behavior, and immunity. 2008;22:1016–1023. doi: 10.1016/j.bbi.2008.03.004. [DOI] [PubMed] [Google Scholar]


