

Abstract
Objectives
The objective of this study was to investigate the efficiency of uptake of PEGylated polylactide-co-gycolide (PLGA) nanoparticles by breast cancer cells.
Methods
Nanoparticles of PLGA containing various amounts of polyethylene glycol (PEG, 5%–15%) were prepared using a double emulsion solvent evaporation method. The nanoparticles were loaded with coumarin-6 (C6) as a fluorescence marker. The particles were characterized for surface morphology, particle size, zeta potential, and for cellular uptake by 4T1 murine breast cancer cells.
Key findings
Irrespective of the amount of PEG, all formulations yielded smooth spherical particles. However, a comparison of the particle size of various formulations showed bimodal distribution of particles. Each formulation was later passed through a 1.2 μm filter to obtain target size particles (114–335 nm) with zeta potentials ranging from −2.8 mV to −26.2 mV. While PLGA-PEG di-block (15% PEG) formulation showed significantly higher 4T1 cellular uptake than all other formulations, there was no statistical difference in cellular uptake among PLGA, PLGA-PEG-PLGA tri-block (10% PEG), PLGA-PEG di-block (5% PEG) and PLGA-PEG di-block (10% PEG) nanoparticles.
Conclusion
These preliminary findings indicated that the nanoparticle formulation prepared with 15% PEGylated PLGA showed maximum cellular uptake due to it having the smallest particle size and lowest zeta potential.
Keywords: 4T1 murine breast cancer cell line, cellular uptake, di-block copolymer, nanoparticles, tri-block copolymer
Introduction
Recent developments in nanotechnology have opened a new vista in cancer drug delivery. By encapsulating target drugs into custom-engineered particles, such as nanoparticles with a specific size, shape and surface characteristics, it has been possible to improve cancer drug safety and efficacy in various models. Since polylactide-co-glycolide (PLGA) is an FDA-approved biodegradable polymer currently used in seventeen preparations on the market, our group has been exploring the use of PLGA-based nanoparticles to encapsulate a variety of drugs,[1-3] including drugs used in cancer therapy. For nanoparticles to work as intended, they must be internalized by the target cells in significant quantity. Among the many factors mentioned above, surface charge also has an important effect on particle internalization. For example, circulating nanoparticles with little or no surface charge are easily trapped by the mononuclear phagocytes of the reticulo-endothelial system (RES), primarily in the liver and spleen.[4] One approach in overcoming this problem is to increase the hydrophilicity of the particle surface. The presence of hydrophilic polymer on the surface can protect nanoparticles from capture by macrophages.[5,6] Hydrophilic polymer on the surface also improves cytoplasmic transfer of particles,[7] and reduces enzymatic degradation.[8] Recent reports demonstrate that the rapid RES uptake of PLGA nanoparticles could be significantly reduced by modifying their surface with polyethylene glycol (PEG).[9] This reduction in RES uptake is mainly due to the lower interaction between the particle and the plasma proteins. Torchillin et al. showed that the size, molecular weight, and shape of the PEG fraction linkage controlled the plasma protein binding, circulation half-life, and renal clearance of the particles.[10] Longer PEG or shorter PEG with increased grafting density rendered a longer circulation half-life. Lastly, the PEG-modified PLGA nanoparticles, prepared mostly by using di-block copolymer of PLGA b-PEG as an additive, demonstrated significantly prolonged half-life in the circulation.[11]
The long-term goal of this project is to develop an efficient polymeric nanocarrier for anticancer drugs. The aim of this part of the project was to develop PEGylated PLGA fluorescent nanoparticles for cellular delivery. To achieve this aim, four different commercially available tri-block and di-block PLGAs were used to prepare nanoparticles. These polymers were chosen because of their safety and biocompatibility. PLGA is non-toxic and already approved by the FDA for human use. Several investigators have already reported the synthesis and cytotoxicity of PEGylated PLGA nanoparticles. Based on cell cytotoxicity assay these PEGylated PLGA particles are as safe as PLGA and show excellent cell viability (at least 94%).[12,13] Five different formulations of nanoparticle were prepared to study the effect of PEG concentrations in the polymer on the particle characteristics. The nanoparticles were characterized in terms of size distribution, zeta potential and cellular uptake. The efficiency of cellular delivery was evaluated using breast cancer cells (4T1).
Materials and Methods
Materials
Poly (lactide-co-glycolide) (PLGA, Resomer 506; Boehringer Ingelheim, Germany) and four other commercially available copolymers of PLGA and PEG were used to prepare nanoparticles. The copolymers used were PLGA-PEG-PLGA tri-block (10% PEG with 6 kDa), PLGA-PEG di-block (5% PEG with 5 kDa), PLGA-PEG di-block (10% PEG with 5 kDa) and PLGA-PEG di-block (15% PEG with 5 kDa) (Boehringer Ingelheim, Germany). The surfactant, l-α-phosphatidylcholine was obtained from Avanti Polar Lipids, Inc. (Birmingham, AL, USA). Polyvinyl alcohol (30–70 kDa, 98–99% hydrolysed), coumarin-6 and all other chemicals were purchased from Sigma Chemical Co. (St Louis, MO, USA).
The highly metastatic murine breast cancer 4T1 cells were obtained from Dr Fred Miller (Karmanos Cancer Institute, Detroit, MI, USA). These cells were cultured in Dulbecco’s Modified Eagle’s Medium (DMEM) supplemented with 2 mm l-glutamine, sodium pyruvate, nonessential amino acids, 100 U/ml of penicillin, 100 mg/ml of streptomycin (Invitrogen, Carlsbad, CA, USA) and 5% fetal bovine serum (Atlanta Biologicals, Lawrenceville, GA, USA). The pH of the media was maintained at 7.2. The cells were incubated in a water-jacketed CO2 incubator (Forma Scientific, Marietta, OH, USA) at 37°C and 5% CO2 level. Cells were maintained with regular medium change at three-day intervals. The cells were passaged in a split ratio of 1: 2 or 1: 3.
Preparation of PLGA and PLGA-PEG nanoparticles
PLGA (Resomer-506) and PLGA-PEG copolymers (tri-block, 5% di-block, 10% di-block and 15% di-block with different molecular weights and various contents of PEG) were used to prepare five nanoparticle formulations (Formulations A–E) with C-6 as a fluorescence marker. A schematic representation of the various polymers is presented in Figure 1. The purpose of using PLGA-PEG-PLGA tri-block copolymer (10% PEG) was to achieve polymer hydrophilicity intermediate to those of PLGA and PLGA-PEG di-block polymers. The nanoparticles were prepared using a modified solvent evaporation method, as described earlier.[14] Briefly, 270 mg of polymer was dissolved in 9 ml of chloroform containing 0.75 mg of C-6 and 1.5 mg of l-α-phosphotidylcholine. The resultant solution was emulsified with 600 μl of de-ionized water using a laboratory homogenizer (Power Gen 700; Fisher Scientific, Pittsburgh, PA, USA) at 30 000 rpm for 1.5 min. The resulting primary emulsion was added drop-wise to a 2% polyvinyl alcohol (PVA) solution (in 25 ml de-ionized water) and homogenized for additional 4 min to form a double emulsion. The double emulsion was passed through a high-pressure homogenizer (EmulsiFlex-C5; Avestin, Ontario, Canada) at 20 000 Psi for 3–4 min with ice bath. The mixture was stirred magnetically at room temperature (at 500 rpm) for 3 h to allow complete extraction of chloroform. Following initial particle size analysis, all preparations were filtered through a 1.2 μm filtering apparatus (Amicon Stirred Ultrafiltration cell, 8003 model; Millipore, Billerica, MA, USA). The filtered particles were collected by ultracentrifugation of the supernatant (Optima L-100 XP ultracentrifuge; Beckman Coulter, Miami, FL, USA) at 35 000 rpm for 20 min. Each fraction of the various samples was washed four times with double-distilled water to remove any residual PVA. The particles were later freeze-dried (−20°C; 6 × 10⁻⁴ mbar) (Labconco, Kansas City, MO, USA) for 48 h to obtain a free-flowing powder. Each formulation was prepared in triplicate.
Figure 1.

Schematic representation of PEGylated polylactide-cogycolide–polyethylene glycol (PLGA-PEG) di-block (A-B) and PLGA-PEG-PLGA tri-block (A-B-A) coploymers. PEG (di-block): 5 kDa; PEG (tri-block): 6 kDa.
Particle size, morphology and zeta potential
Particle size distribution
The particle size distribution was determined by Malvern Zetasizer 2000 (Malvern Instruments Ltd, Malvern, UK). A sample of particles (5 mg) was added to the de-ionized water in a small-volume sample dispersion unit. For each sample, a background run of de-ionized water was also performed. After subtraction of the background, the particle size distribution was calculated. The size distribution was calculated based on Mie theory and incorporating the appropriate refractive indices for the material and the dispersants according to ISO13320-1. In addition, before the analysis the instrument was calibrated using standard particle samples (0.1, 0.3 and 45 μm). Each measurement was performed in triplicate.
Morphology
Morphology of the nanoparticles was examined using a variable-pressure scanning electron microscopy (Hitachi 3400N; Hitachi, Gaithersburg, MD, USA). Samples were mounted on metal stubs and coated with gold to a thickness of 200–500 Å. The analytical parameters included an accelerating voltage of 10 KV, a working distance of 13.5 mm and a vacuum of 40 Pa in variable pressure mode. Since the samples were analysed in variable pressure mode, the backscatter detector BSE2 was also used.
Zeta potential
The zeta potential of particles was measured using a Malvern Zetasizer 2000 (Malvern Instruments, Malvern, UK). The experiments were performed in de-ionized water, and all measurements were performed in triplicate.
Seeding of 4T1 cells
To study the cellular uptake of nanoparticles, the 4T1 cells were seeded into a 24-well plate, containing growth medium, at a density of 10 000 cells/well and allowed to grow for 24 h as described in our previous study.[15] Briefly, growth medium was aspirated from the 10-cm tissue culture dish, the cell monolayer was washed with sterile phosphate-buffered saline (PBS, pH 7.4), and 1.5 ml trypsin was added to the flask. The flask was incubated at 37°C for 2–5 min to allow complete cell detachment (Forma Series II Water-jacketed CO2 Incubator, model −3110; Thermo Fisher Scientific, Marietta, OH, USA). Following the incubation, 10 ml fresh growth medium was added to the flask. The cells were finally flushed with a 10 ml pipette several times until all the cells were in suspension. The suspension was eventually transferred to a 50-ml tube and centrifuged at 1500 rpm (4°C) (Beckman-GPKR Centrifuge; Beckman Coulter) for 5 min to pellet the cells. The pellet was resuspended in 10 ml of growth medium. A cell count was conducted with a 50-μl sample of the suspension using a haemacytometer (0.1 mm deep, Bright-Line improved Neubauer; Hausser Scientific, Horsham, PA, USA).
Cellular uptake of nanoparticles
Cellular uptake of the formulations was evaluated qualitatively and quantitatively using a fluorescence microscope and a flow cytometer, respectively. For each assay three independent experiments were performed and at least three replicates were used for each experiment throughout the study.
Fluorescence microscopy
Cellular uptake of the nanoparticles was evaluated qualitatively using a fluorescence microscope. The extent of fluorescence was measured from the cells qualitatively using five fields per well. Briefly, 1 × 10⁴ 4T1 cells were seeded on to two 24-well tissue culture plates in 1 ml of medium. Nanoparticles (A–E) were resuspended in serum-free medium at a concentration of 1 mg/ml by sonication for 30 s in a bath sonicator (FS60; Fischer Scientific, Pittsburgh, PA, USA) and 20 μl of the suspension was added to each well immediately, replacing the growth medium from the 24-well plate. The nanoparticle suspension was removed after 24 h, and the cell monolayer was washed three times with sterile PBS (pH 7.4) to remove the unbound or undelivered nanoparticles. The untreated cells and cells treated with C-6 solution were considered as positive and negative controls, respectively. Intracellular uptake of C-6 into 4T1 cells was detected 24 h post treatment by an Olympus IX70 fluorescence microscope using a blue filter. The images were taken using an Olympus DP-71 digital camera (Olympus, Center Valley, PA, USA).
FACS analysis (flow cytometry)
The extent of cellular uptake was measured quantitatively using a flow cytometer. The intensity of the fluorescence was measured using a flow cytometer (BD Biosciences, San Jose, CA, USA) at 405–488 nm (fluorescein isothiocyanate, FITC) excitation wavelength, closely related to C-6 excitation wavelength (390–420 nm). About 50 000 cells were counted for each analysis. Briefly, 1 × 10⁴ 4T1 cells were seeded onto two 24-well tissue culture plates in 1 ml medium one day before the experiment. Twenty microlitres of nanoparticle suspension was added to each well, as described earlier, and incubated for 24 h. Following the incubation, the cells were washed three times with 1 ml PBS (pH 7.4) and trypsinized to detach from the wells. The cells were centrifuged at 1000 rpm for 5 min and the cell pellet was resuspended in 1 ml PBS and centrifuged again at 1000 rpm for an additional 5 min. Finally the cell pellet was resuspended in 1 ml PBS and analysed by a flow cytometer. The untreated cells and cells treated with C-6 solution were considered as positive and negative controls, respectively. The efficiency of intracellular delivery of each batch of nanoparticles was determined by measuring the increase of mean fluorescence intensity. Three independent experiments were done for each assay and for each experiment three replicates were performed.
Statistical analysis
All statistical analyses were performed using Prism software package (GraphPad Software Inc., La Jolla, CA, USA). The particle size of the formulations was reported as range and 90th percentile. The zeta potential was reported as mean ± standard deviation (SD). The zeta potential and fluorescent intensity of the formulations was compared using one-way analysis of variance followed by Student–Newman–Keul’s (SNK) multiple comparison test. P < 0.05 was considered as evidence of a significant difference.
Results and Discussion
Immediately after the preparation, the nanoparticles showed a very wide and bi-modal distribution of sizes, ranging from 200 nm to 200 μm (data not shown). In an effort to collect only the particles smaller than 1000 nm, the particle dispersions were filtered through a 1.2 μm filter and finally collected by ultracentrifugation. The size of the final nanoparticles was reported as 90th percentile (i.e. ninety percentile cut-off points) and range. The results of the particle size analysis are listed in Table 1. All formulations, except B, yielded narrow size distributions after filtering through 1.2 μm filtering apparatus. Formulation B, made with the tri-block copolymer, showed a broader distribution range compared with the other four formulations (91–648 nm; Table 1). This broader distribution could be due to agglomeration of nanoparticles immediately after filtering. Arun and Gaymans also reported similar agglomeration of triblock copolymer nanoparticles.[16] The 90th percentile of the particles in all formulations was between 114 nm (Formulation E) and 335 nm (Formulation B). A comparison of the scanning electron microscope photographs of the formulations revealed that all five formulations were spherical in shape with smooth surface (Figure 2). The zeta potential of the nanoparticles is listed in Table 1. A comparison of the zeta potential revealed that the charge associated with the nanoparticles of formulation E was minimum (−2.8 mV). The polymeric nanoparticles without PEG (Formulation A) showed higher negative zeta potential (−26.2 mV) compared with the PEGylated PLGA. Hence, PEGylation, irrespective of di-block, tri-block or PEG concentration, reduces the overall negative surface charge. The mean values of zeta potentials of all PEGylated formulations were in the range of −2.8 mV to −9.3 mV (Table 1) with the lowest value belonging, as expected,[17,18] to formulation E. This particular formulation was prepared with the highest amount of PEG. Li et al. also reported a reduction of surface charge from −33.9 mV to −16.1 mV due to PEGylation.[19]
Table 1.
Physical characteristics of polylactide-co-gycolide (PLGA) and PEGylated PLGA nanoparticles
| Formulation | Particle size and range (90th percentile, nm) |
Zeta Potential (mV)a |
|---|---|---|
| A (PLGA:50/50) | 210 (85–353) | −26.24 ± 5.2 |
| B (tri-block, 10% PEG) | 335 (91–648) | −7.45 ± 0.90 |
| C (di-block, 5% PEG) | 166 (72–351) | −4.50 ± 0.69 |
| D (di-block, 10% PEG) | 171 (70–433) | −9.36 ± 1.09 |
| E (di-block, 15% PEG) | 114 (73–324) | −2.8 ± 1.60 |
Each reading represents the mean of triplicate samples ± SD.
Figure 2.

(a) Scanning electron microscope photograph of the representative formulation. (b) Zoomed photographs of the same representative formulation.
Results of the in-vitro cell culture studies are shown in Figures 3-5. Fluorescence microscopy studies confirmed that all formulations showed excellent 4T1 cellular uptake, with formulation E (15% PEGylated PLGA) resulting in significantly higher uptake than all other formulations (Figure 3a and 3b).The C-6 solution uptake by 4TI cells was mostly confined to the outer cell membrane accompanied by minimal internalization (Figure 3b).Based on these qualitative results, it can be assumed that 15% PEGylated nanoparticles showed maximum cellular uptake. This observation was further confirmed by the quantitative flow cytometry analysis, which indicated the presence of the particles in 100% of the viable cells 24 h post-incubation (Figures 4 and 5).The fluorescence intensity of the cells treated with formulation E was significantly higher than all other formulations (P < 0.001). Our results are in concert with the studies of our previous results of C-6 PLGA nanoparticle uptake in 4T1 cells[15] and also other reports.[20,21] These results show that formulation E with lower particle size (114 nm) and lower zeta potential (−2.8 mV) seems to provide the best uptake by 4T1 cells. Saduzuka et al. also studied the cellular uptake of PEGylated liposomes and reported significantly higher cellular uptake due to PEGylation.[21]
Figure 3.

Fluorescence microscopy photographs (20×) of the 4T1 breast cancer cells 24 h post-treatment. (a) Fluorescence image of cells without any treatment. (b) Fluorescence images of cells treated with the C-6 solution and five different formulations, A, B, C, D, and E, respectively.
Figure 5.
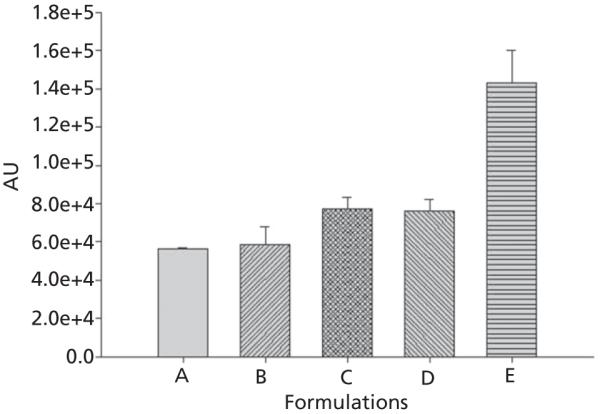
Flow cytometry analysis of the cells treated with the formulations A, B, C, D and E. The intensity of fluorescence was measured as A.U. The fluorescence intensity was quantified at 405–488 nm (FITC) excitation wave lengths. Each bar represents the mean of fluorescence intensity of triplicate samples ± SD.
Figure 4.

Results of flow cytometry analysis (FACS) of the 4T1 breast cancer cells 24 h post treatment represented in dot plot graphs. Each graph represents the two gated channels, P1 and P2. The P1 channel shows gating of FSC (forward scatter) vs SSC (side scatter) dot plot. This plot can differentiate between the number of viable and apoptotic cells. Each measurement was repeated three times and the number of events per reading is 10 000. The P2 axes represent fluorescence intensity in log scale. The P2 channel represents viable cells with fluorescence signal and each dot represents single cell in the population. The P2 channel also indicates the total percentage of cell population picking up fluorescence signal. C-6: Treatment group, solution; A-E: Treatment groups, nanoparticles A-E; No treatment group: Control.
Conclusions
Although all nanoparticle formulations showed sufficient cellular uptake, except PLGA-PEG di-block (15%), the differences were not statistically significant (P > 0.05). PLGA-PEG di-block (15% PEG) formulation showed significantly higher 4T1 cellular uptake compared with all other formulations. A comparison of the particle size and zeta potential also showed that this particular formulation had the smallest particle size and lowest zeta potential. These preliminary findings indicated that the nanoparticle formulation prepared with 15% PEGylated PLGA showed maximum cellular uptake due to its smallest particle size and lowest zeta potential.
Acknowledgments
Funding
This work was funded in part by the NIH grant 1G12RR026260-01, P20CA118768-02, and LCRC, Louisiana Board of Regents RC/EEP (2007–11), LEQSF(2007–12)-ENH-PKSFI-PRS-02 and Military Infectious Disease Research Program grant W81XWH-07-1-0136.
Footnotes
Declarations
Conflict of interest
The Author(s) declare(s) that they have no conflicts of interest to disclose.
References
- 1.Pamujula S, et al. Preparation of polylactide-co-glycolide and chitosan hybrid microcapsules of amifostine using coaxial ultrasonic atomizer with solvent evaporation. J Pharm Pharmacol. 2008;60:283–289. doi: 10.1211/jpp.60.3.0002. [DOI] [PubMed] [Google Scholar]
- 2.Graves RA, et al. Effect of different ratios of high and low molecular weight PLGA blend on the characteristics of pentamidine microcapsules. Int J Pharm. 2004;270:251–262. doi: 10.1016/j.ijpharm.2003.10.019. [DOI] [PubMed] [Google Scholar]
- 3.Pamujula S, et al. Anti-tumor efficacy of controlled release doxorubicin nanoparticles. Controlled Release of Bioactive Materials; Proceedings of the International Symposium on 37th annual meeting and exposition of Controlled Release Society; Oregon, USA. 2010 July 10–14. [Google Scholar]
- 4.Moghimi MS, et al. Long-circulating and target-specific nanoparticles: theory to practice. Pharmacol Rev. 2001;53:283–318. [PubMed] [Google Scholar]
- 5.Gaur U, et al. Biodistribution of fluoresceinated dextran using novel nanoparticles evading reticulo-endothelial system. Int J Pharm. 2000;202:1–10. doi: 10.1016/s0378-5173(99)00447-0. [DOI] [PubMed] [Google Scholar]
- 6.Ozcan I, et al. Pegylation of poly(γ-benzyl-L-glutamate) nanoparticles is efficient for avoiding mononuclear phagocyte system capture in rats. Int J Nanomed. 2010;5:1103–1111. doi: 10.2147/IJN.S15493. [DOI] [PMC free article] [PubMed] [Google Scholar]
- 7.Suh J, et al. PEGylation of nanoparticles improves their cytoplasmic transport. Int J Nanomed. 2007;2:735–741. [PMC free article] [PubMed] [Google Scholar]
- 8.Akagi T, et al. Hydrolytic and enzymatic degradation of nanoparticles based on amphiphilic poly(ç-glutamic acid)-graft-L-phenylalanine copolymers. Biomacromolecules. 2006;7:297–303. doi: 10.1021/bm050657i. [DOI] [PubMed] [Google Scholar]
- 9.Moghimi SM, Davis SS. Innovations in avoiding particle clearance from blood by Kupffer cells: cause for reflection. Crit Rev Ther Drug Carrier Syst. 1994;11:31–59. [PubMed] [Google Scholar]
- 10.Torchillin VP. Polymer-coated long-circulating microparticulate pharmaceuticals. J Microencapsul. 1998;15:1–19. doi: 10.3109/02652049809006831. [DOI] [PubMed] [Google Scholar]
- 11.Stolnik S, et al. Surface modification of poly(lactide-co-glycolide) nanoparticles by novel biodegradable poly(lactide)-poly(ethylene glycol) copolymers. Pharm Res. 1994;11:1800–1808. doi: 10.1023/a:1018931820564. [DOI] [PubMed] [Google Scholar]
- 12.Fernandez-Carballido A, et al. PLGA/PEG-derivative polymeric matrix for drug delivery system applications: characterization and cell viability studies. Int J Pharm. 2008;352:50–57. doi: 10.1016/j.ijpharm.2007.10.007. [DOI] [PubMed] [Google Scholar]
- 13.Dhankar R, et al. HER-2 targeted immunonanoparticles for breast cancer chemotherapy. J Appl Pharm Sci. 2011;1:132–139. [Google Scholar]
- 14.Mandal TK, Tenjarla S. Preparation of biodegradable microcapsules of zidovudine using solvent evaporation: effect of the modification of aqueous phase. Int J Pharm. 1996;137:187–197. [Google Scholar]
- 15.Pamujula S, et al. Preparation and in vitro/in vivo evaluation of surface modified poly (lactide-co-glycolide) fluorescent nanoparticles. J Pharm Pharmacol. 2010;62:422–429. doi: 10.1211/jpp.62.04.0003. [DOI] [PubMed] [Google Scholar]
- 16.Arun A, Gaymans RJ. Tri-block copolymers with mono-disperse crystallizable diamide segments. Synthesis. 2008;49:2461–2470. [Google Scholar]
- 17.Sahoo SK, et al. Residual polyvinyl alcohol release associated with poly(lactic-co-glycolide) nanoparticles affects their physical properties and cellular uptake. J Control Release. 2002;82:105–114. doi: 10.1016/s0168-3659(02)00127-x. [DOI] [PubMed] [Google Scholar]
- 18.Yokoyama M, et al. Selective delivery of adriamycin to a solid tumor using a polymeric micelle carrier system. J Drug Target. 1999;7:171–186. doi: 10.3109/10611869909085500. [DOI] [PubMed] [Google Scholar]
- 19.Li YP, et al. PEGylated PLGA nanoparticles as protein carriers: synthesis, preparation and biodistribution in rats. J Control Release. 2001;71:203–211. doi: 10.1016/s0168-3659(01)00218-8. [DOI] [PubMed] [Google Scholar]
- 20.Zhang Z, et al. Folate-decorated poly(lactide-co-glycolide-vitamin E TPGS nanoparticles for targeted drug delivery. Biomaterials. 2007;28:1889–1899. doi: 10.1016/j.biomaterials.2006.12.018. [DOI] [PubMed] [Google Scholar]
- 21.Sadzuka Y, et al. Effect of polyethyleneglycol (PEG) chain on cell uptake of PEG-modified liposomes. J Liposome Res. 2003;13:157–172. doi: 10.1081/lpr-120020318. [DOI] [PubMed] [Google Scholar]