

Abstract
The apical sodium dependent bile acid transporter (ASBT) and sodium-taurocholate cotransporting polypeptide (NTCP) are potential prodrug targets, but the structural requirements for these transporters are incompletely defined. The objective of this study was to evaluate the effect of C-3 and C-7 substitution on bile acid interaction with these bile acid transporters. Nineteen bile acid analogues were tested against ASBT and NTCP for binding, as well as translocation. Results indicated that ASBT and NTCP accommodated a wide range of substituents for binding, but all major C-7 modifications resulted in analogues that did not demonstrate active uptake by either ASBT or NTCP. A C-3 modification that was not tolerated at C-7 still afforded translocation via ASBT and NTCP, confirming the relative unacceptability of C-7 modification. Both ASBT and NTCP demonstrated a generally similar binding potency. Results suggest that drug conjugation to the C-3 hydroxyl group, rather than C-7, has potential to lead to a successful prodrug targeting ASBT and NTCP.
Keywords: ASBT, NTCP, substrate, inhibitor, bile acid, prodrug
1. INTRODUCTION
The human apical sodium dependent bile acid transporter (ASBT, SLC10A2), expressed at high levels in the terminal ileum, is one of the important transporters in the enterohepatic circulation. It is responsible for the active absorption of bile acids from the gut. Overall, a 3–5g bile acid pool results in the daily turnover of 12–18g and less than 0.5g is lost each day, reflecting the high capacity of this bile acid transporter. ASBT is thus an ideal prodrug target with its high efficiency and capacity (Balakrishnan and Polli, 2006).
Despite being a prodrug target, the design of prodrugs is hampered by absence of the high resolution ASBT crystal structure and the lack of understanding of interactions at the molecular level. Our laboratory has taken a systematic approach to understand the structure-activity relationship of ASBT. Previous reports evaluated interaction of native bile acids with ASBT in the stably transfected ASBT-MDCK cell line (Balakrishnan et al., 2006b). The evaluation of the C-24 chemical space has indicated that ASBT accommodates a range of substituents and charge conditions for binding. However, a single negative charge in the C-24 region promotes translocation across the transporter (Balakrishnan et al., 2006a). ASBT also accommodates various drug-like single ring scaffolds with different substituents attached to the bile acid (Gonzalez et al., 2009; Rais et al., 2010a; Rais et al., 2010b; Zheng et al., 2010). Using C-24 bile acid linkage chemistry, bile acid-based prodrugs of gabapentin, ketoprofen, and niacin have been shown to be ASBT substrates (Rais et al., 2011; Zheng and Polli, 2010). In addition to this C-24 chemical space, the C-3 bile acid chemical space has also been explored, where various linkers and drugs have been conjugated to a bile acid at C-3, resulting in some prodrugs (Kramer et al., 1994;Swaan et al., 1997).
After absorption by ASBT, bile acids are mostly extracted into hepatocytes by sodium-taurocholate cotransporting polypeptide (NTCP) at the basolateral surface of hepatocytes (Alrefai and Gill, 2007). Liver specific expression of this transporter can be exploited for hepatocyte selective drug action. Some studies have evaluated the effect of conjugation at the C-3 and C-24 region of bile acid on interaction with NTCP (Kramer et al., 1992; Kramer et al., 1997; Kullak-Ublick et al., 1997). However, this strategy is impeded by limited understanding of structure activity relationships.
In addition to C-3 and C-24 positions, the C-7 location is often hydroxylated and represents a potential conjugation site in bile acid prodrug design (Kramer, 2011; Sievanen, 2007; Zhang et al., 2002). Cholic acid and chenodeoxycholic acid, the two most abundant bile acids in humans, contain a C-7 hydroxyl group (Kullak-Ublick et al., 2004). Interestingly, there are no reports of C-7 substitution on bile acid interaction with the bile acid transporters.
The objective of this study was to evaluate the effect of C-3 and C-7 substitution on bile acid interaction with bile acid transporters. Nineteen bile acid analogues were tested against ASBT and NTCP, using stably transfected ASBT-MDCK and NTCP-HEK monolayers. Analogue conjugates were composed of bile acid (CDCA or UDCA) conjugated to substituted aromatic rings such as benzene and pyridine, the most common scaffolds among existing drugs (Bemis and Murcko, 1996). Results indicated that although ASBT and NTCP accommodated a wide range of substituents for binding, all major C-7 modifications resulted in analogues that were not translocated by either ASBT or NTCP. Interestingly, a C-3 modification that was not tolerated at C-7 still afforded translocation via ASBT and NTCP, further confirming the relative unacceptability of C-7 modification. Results also characterize the relative promiscuity of ASBT and NTCP. Compared to ASBT, NTCP demonstrated a generally similar binding potency across compounds, although showed less binding affinity toward unconjugated bile acids with aromatic substitution at C-7. Results suggest that drug conjugation to the C-3 hydroxyl group, rather than C-7, has potential to serve as a bile acid transporter prodrug strategy.
2. MATERIALS AND METHODS
2.1 Materials
Ursodeoxycholic acid was obtained from TCI America (Portland, OR). Chenodeoxycholic acid was purchased from AK Scientific (Mountain View, CA). Geneticin, fetal bovine serum (FBS), trypsin, and DMEM were obtained from Invitrogen (Rockville, MD). [3H]-Taurocholic acid was purchased from PerkinElmer Inc (Waltham, MA). Taurocholic acid, dehydrocholic acid (compound 13), pyridine, and triethyl amine were obtained from Sigma Aldrich (St. Louis, MO). 7-oxo cholanic acid (compound 11) was purchased from TCI America (Portland, OR). All other reagents and chemicals were of the highest purity commercially available.
2.2 Synthetic methods
2.2.1 Synthetic procedure overview
The carboxylic acid in the C-24 region was protected by methyl, methyl glycinate, or benzyl glycinate to yield C-24 protected bile acid (Procedure A). Selective monoacylation and diacylation of the free steroidal hydroxyl groups was then carried out by controlling the stoichiometry of the acyl chloride used during the reaction to obtain 3, 24 disubstituted or 3, 7, 24 trisubstituted bile acids. (Procedure B). Tri-substituted bile acids were then subjected to basic hydrolysis. Ease of ester hydrolysis was in following order C-3 > C-24 > C-7 (Procedure C). Thus compound 17 was obtained by selective hydrolysis only at C-3 while keeping esters at C-24 and C-7 intact while compounds 1–9 were obtained by selective hydrolysis at C-3 and C-24 position while keeping ester at C-7 intact. Compounds 16, 18, 19 were not subjected to basic hydrolysis to understand the effect of C-24 and C-3 substitution on transporter interaction. TLC, 1H NMR and mass spectroscopy were performed for each compound to confirm identity and satisfactory purity, along with ensuring that no bile acid (i.e. a potent inhibitor and substrate of both ASBT and NTCP) was present in the final product (Gonzalez and Polli, 2008).
2.2.2 Procedure A: Protection of C-24 carboxylic acid
Three different protecting groups were used for the synthesis of three groups of compounds. To synthesize compounds 1–6, 16, 18 and 19, carboxylic acid was protected as methyl ester to get common intermediate (II) (Figure 1). To synthesize compounds 7–9, and 17 methyl glycinate was used as protecting group to get common intermediate (V) (Figure 2) while for synthesis of compounds 10, 12, 14 and 15, benzyl glycinate was used as protecting group to get common intermediate (X) (Figure 3). Below are the typical procedures used for the synthesis of intermediates II, V and X.
Figure 1.

Synthetic approach for compounds 1–6, 16, 18 and 19.
Figure 2.

Synthetic approach for compounds 7–9, 12 and 17.
Figure 3.

Synthetic approach for compounds 10, 14 and 15.
2.2.2.1 Synthesis of methyl ester of bile acid (II)
Thionyl chloride (415 mg, 3.5 mmole) was added into a cold solution of ursodeoxycholic acid (UDCA) or chenodeoxycholic acid (CDCA) (500 mg, 1.3 mmole) in methanol. The reaction was allowed to warm to RT and stirred overnight. Methanol was then evaporated under vacuum to obtain the methyl ester of the respective bile acid (II) in quantitative yield. (MS, M+1 407.3).
2.2.2.2 Synthesis of glycine esters for bile acid (V and X)
The glycine conjugate of the bile acid was synthesized, as described previously (Tserng et al., 1977). Briefly, methyl glycinate hydrochloride (878 mg, 7 mmol) was stirred with triethylamine (1 ml) in ethyl acetate at RT for 30 min. Bile acid (1.96 g, 5 mmol) and EEDQ (1.73 g, 7 mmol) were added to the suspension. After 10 min, the reaction mixture was heated at 65 ºC and allowed to stir overnight. The ethyl acetate layer was then washed successively with water (25 ml), 0.5N NaOH (50 ml), water (25 ml), 0.5N HCl (2 X 50 ml), water (25 ml) and brine. The resulting ethyl acetate layer was evaporated under vacuum to yield methyl glycoursodeoxycholate or methyl glycochenodeoxycholate. (MS M+1 464.3). Use of benzyl glycinate instead of methyl glycinate yielded common intermediate (X) (MS, M+1 540.2) which was used for the synthesis of compounds 10, 14 and 15.
2.2.3 Procedure B: Acylation of C-24 protected bile acid
Monoacylation at C-3 position of intermediate II and X with 2 equivalents of acid chloride (nicotinic acid chloride) yielded compound 18 and intermediate XI respectively (Figure 2 and 3) while reaction of intermediates II, V with excess (4 equivalents) of appropriate acyl chlorides yielded C-3, C-7-diacyl products III, VI respectively. Typical procedure used for diacylation is as follows: Acyl chloride (4 eq.) was added to a solution of C-24 protected bile acid (1eq.) in pyridine. The reaction mixture was stirred at 40–60 ºC for 2–8 hr. After cooling, the reaction mixture was poured over ice and acidified with concentrated HCl to pH 2. The suspension was extracted with dichloromethane. The organic layer was dried over sodium sulfate, and evaporated under vacuum to yield a crude mixture which was purified by flash column chromatography over silica gel using an appropriate mixture of ethyl acetate and hexane as eluent.
2.2.4 Procedure C: Selective hydrolysis of 3,7,24-trisubstituted bile acid derivatives
Intermediates III, VI were subjected to basic conditions to achieve selective hydrolysis (Kritchevsky et al., 1986). Selective hydrolysis at C-3 and C-24 positions of III yielded compounds 1–6. Selective hydrolysis at C-3 and C-24 positions of intermediate VI yielded compounds 7–9 while selective hydrolysis of intermediate VI at C-3 position yielded compound 17. A typical procedure for hydrolysis is as follows: The 3, 7, 24-trisubstituted bile acid (1 eq.) was dissolved in methanol. A 50% aqueous KOH solution (0.5 ml) was then added to it. The reaction was heated at 40–60 ºC for 2–10 hr. After the reaction was complete as indicated by TLC and MS, methanol was evaporated under vacuum to yield a white residue which was dissolved in water and acidified with concentrated HCl to pH 2. The crude product was extracted with dichloromethane. The organic layer was dried over anhydrous sodium sulfate and evaporated under vacuum to obtain final compounds which were purified by column chromatography over silica gel column using an appropriate mixture of ethyl acetate and hexane.
2.2.5 Procedure D: Formation of hemisuccinate (compound 14)
C-24 protected CDCA (6.3 mmol) was suspended in 25 ml ethyl acetate with succinic anhydride (3 g, 30 mmol), triethylamine (0.63 ml, 6.3 mmol), and DMAP (70 mg, 0.6 mmol). The reaction was heated at 65 °C for 48 hr. It was then extracted with water, followed by wash with acidic water (pH 1)(Bortolini et al., 2006). Ethyl acetate was then dried over sodium sulfate, filtered and evaporated under vacuum to get a crude product which was purified by column chromatography over silica gel, using 20% hexane in ethyl acetate as an eluent to get compound 14.
2.2.6 Procedure E: Deprotection of benzyl group
Intermediates X, XI and compound 14 were subjected to catalytic hydrogentation to obtain compounds 12, 10 and 15 respectively. A typical procedure used for catalytic hydrogenation is as follows: Benzyl protected compound was dissolved in ethanol and subjected to catalytic hydrogenation in a Parr hydrogenator using Pd/C as catalyst. Hydrogenation was performed overnight at 45 psi and at RT. The suspension was filtered using celite and organic solvents evaporated under vacuum to obtain final products.
2.3 Cell culture
Stably transfected ASBT-MDCK and NTCP-HEK cells were cultured as previously described (Balakrishnan et al., 2005; Han et al., 2010). Briefly, cells were grown at 37 ºC, 90% relative humidity, 5% CO2 atmosphere, and fed every two days. Culture media consisted of DMEM supplemented with 10% FBS, 50 units/ml penicillin, and 50 μg/ml streptomycin. Geneticin (1 mg/ml) and hygromycin (100 μg/ml) were added to maintain selection pressure for ASBT-MDCK and NTCP-HEK cells, respectively. Cells were passaged after four days or after reaching 90% confluency.
2.3.1 Inhibition study in ASBT-MDCK monolayers
To characterize ASBT binding affinities, taurocholate uptake inhibition studies were conducted. Taurocholate is a potent ASBT substrate. Stably-transfected ASBT-MDCK cells were grown on 12-well plates (3.8 cm2, Corning, Corning, NY) under conditions described above. Cells were seeded at a density of 1.5 million/well and induced with 10 mM sodium butyrate 12–15 hr at 37 °C prior to study on day 4. Cells were washed three times with Hank’s balanced salt solution (HBSS) prior to assay. Studies were conducted at 37 °C, 50 rpm for 10 min in an orbital shaker. Uptake buffer consisted of HBSS, which contained 137 mM NaCl (pH 6.8) and was supplemented with 1 g/L of glucose. Cells were exposed to the donor solution containing 0.5 μCi/ml [3H]-taurocholate (TCA), 2.5 μM cold TCA, with varying concentrations of the analogues (from 0 μM to up to 500 μM) for 10 min at 37°C at 50 rpm. After this time, donor solution was removed and cells were washed three times with chilled sodium-free buffer (SFB) where NaCl was replaced by 137 mM tetraethylammonium chloride. Cells were lysed using 250 μl of 1N NaOH and allowed to stand for at least 2 hr. After that time, cell lysate was neutralized with 250 μl of 1N HCl. Lysate was then counted for associated radioactivity (i.e [3H]-taurocholate) using an LS6500 liquid scintillation counter (Beckmann Instruments, Inc., Fullerton, CA). Inhibition data was regressed using a modified Michaelis-Menten equation (eqn 1) to determine the inhibition constant Ki, as previously described (Gonzalez et al., 2009).
| eqn 1 |
where I is inhibitor concentration, Ki is inhibition constant, J is taurocholate flux, Jmax and Kt are the Michaelis-Menten constants, S is taurocholate concentration (i.e. 2.5 μM), Pp is passive taurocholate permeability, and PABL is aqueous boundary layer permeability. Kt was set to 5.03 μM, as obtained from pooled kinetic analysis of historical taurocholate uptake studies. PABL was set to 1.5×10⁻⁴ cm/s (Balakrishnan et al., 2007). Parallel studies were performed on each occasion to estimate Jmax and Pp for taurocholic acid. Pp was estimated from taurocholate uptake studies in absence of sodium. Ki was estimated by using nonlinear regression fitting performed by WinNonlin Professional (Pharsight; Mountain View, CA). Compounds with Ki up to 25 μM are considered strong inhibitors. Ki between 25 μM - 100 μM are denoted moderate inhibitors. Ki above 100 μM are weak inhibitors.
2.3.2 Uptake study in ASBT-MDCK monolayers
Analogue uptake by ASBT was evaluated. Cells were seeded as above for inhibition studies. Uptake studies employed HBSS buffer or modified HBSS buffer (i.e., sodium-free buffer). Since ASBT is a sodium-dependent transporter, studies using sodium-free buffer enabled passive permeability measurement of analogue (Rais et al., 2010a; Weinman et al., 1998). Cells were exposed to donor solution in HBSS or SFB containing a range of analogue concentrations (from 1 μM to up to 250 μM) for 10 min. Subsequently, cells were lysed by adding 300 μl acetonitrile to each well. After two hr, acetonitrile was evaporated at RT. A solution (1 ml) containing 50% water and 50% acetonitrile was added to each well for 15 min(Rais et al., 2008;Rais et al., 2010a). Samples were stored in −80 °C until analysis by LC/MS. Additionally, taurocholate Jmax was measured on each occasion, as taurocholate is a reference ASBT substrate. For each analogue, Jmax was normalized to the observed taurocholate Jmax to yield substrate normalized Jmax, denoted normJmax. normJmax measures transporter capacity for analogue, while accommodating variable ASBT protein expression across occasions. Uptake data was fitted to the modified Michaelis-Menten equation (eqn 2) to yield estimates for Km and Jmax. Data from sodium free studies were fitted to eqn 3, which represents the passive transport.
| eqn 2 |
| eqn 3 |
Kinetic parameters were estimated via nonlinear regression by WinNonlin Professional.
2.3.3 Inhibition study in NTCP-HEK monolayer
The taurocholate uptake inhibition studies were performed in NTCP-HEK cells to characterize compound binding affinity with NTCP, as described above for ASBT. Stably-transfected NTCP-HEK cells were grown on BioCoat poly-D-lysine-coated 24-well plates (2 cm2, BD, Franklin Lakes, NJ) under conditions described above. Cells were seeded at a density of 2.5 × 10⁵ cells/well at 37°C. After culturing for two days, cells were washed three times with HBSS prior to assay. Cells were exposed to the donor solution containing 0.5 μCi/ml [3H]-taurocholate, 2.5 μM cold taurocholate, with varying concentrations of the analogues (from 0 μM to up to 500 μM) for five min at 37°C at 50 rpm. After this time, donor solution was removed and cells were washed three times with chilled sodium-free buffer. Cells were lysed by adding 150 μl acetonitrile to each well. Following evaporation at RT for about 2 hr, 250 μl of DPBS was added and 125 μl was then counted for associated radioactivity using an LS6500 liquid scintillation counter. Inhibition data was regressed using a modified Michaelis-Menten equation (eqn 1) to determine the inhibition constant Ki. Kt was set to 5.31 μM. Parallel studies were performed on each occasion to estimate Jmax and Pp for taurocholic acid.
2.3.4 Uptake study in NTCP-HEK monolayers
The uptake of analogues by NTCP was performed, as described above for ASBT. Since NTCP is a sodium-dependent transporter, uptake studies employed HBSS buffer or sodium free buffer. Cells were exposed to donor solution containing a range of analogue concentrations (from 1 μM to up to 250 μM) in HBSS or sodium free buffer. Subsequently, cells were lysed by adding 150 μl acetonitrile to each well. After two hr, acetonitrile was evaporated at RT. A solution (500 μl) containing 50% water and 50% acetonitrile was added to each well for 15 min. Samples were stored in −80 °C until analysis by LC/MS. Additionally, taurocholate Jmax was measured on each occasion. For each analogue, Jmax was normalized to observed taurocholate Jmax to yield substrate normalized Jmax, denoted normJmax. Kinetic data was subjected to eqn 2 and 3.
2.4 Analytical method
Analogues were quantified by LC/MS on a Thermo Finnigan Surveyor HPLC system, equipped with a Thermo Finnigan Surveyor autosampler and a Thermo TSQ quantum mass spectrometer (Thermo Fisher Scientific Inc., Waltham, MA). The column was a Phenomenex Luna C8 (50 × 2.0 mm, 3 μm; Phenomenex; Torrance, CA, USA). The mobile phase was water and acetonitrile. Formic acid (0.1%) was used as modifier in each mobile phase. A flow rate of 0.4 ml/min was used with an injection volume of 10 μl. Detection was achieved under positive or negative ion electrospray, depending on the approach that provided maximum sensitivity. The limit of quantification for all analogues was between 1 and 10 nM.
2.5 Assessment of inhibition type
7-nicotinoyl glycoursodeoxycholate (Compound 8) inhibited both ASBT and NTCP. In order to assess type of inhibition (i.e. competitive, noncompetitive, or uncompetitive), an additional ASBT inhibition study and an additional NTCP inhibition study was performed for 7-nicotinoyl glycoursodeoxycholate, using ASBT-MDCK and NTCP-HEK monolayers. Inhibition studies were performed as described above, except inhibitor concentration was fixed at one level (i.e. ten times Ki) and substrate concentration was varied. This approach is denoted the nonconventional inhibition study, since it differs from the conventional approach where inhibitor concentration is varied and substrate concentration is fixed (Kolhatkar and Polli, 2010). Cells were exposed to the donor solution containing 152 μM (for ASBT-MDCK) and 118 μM (for NTCP-HEK study) inhibitor and 1–200 μM taurocholate with 0.5 μCi/ml [3H]-taurocholate. The inhibition data were fitted to the competitive, noncompetitive, and uncompetitive models per eqn 4, 5, and 6 using WinNonlin Professional (Kolhatkar and Polli, 2010).
| eqn 4 |
| eqn 5 |
| eqn 6 |
3. RESULTS
3.1 Synthesis
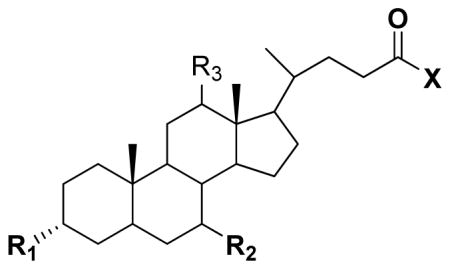
Seventeen conjugates were successfully synthesized in moderate to high yield. Compounds 11 and 13 were purchased. Table 1 identifies the 19 compounds. A majority (i.e. 12; compounds 1–9, 11, 12, 17) were C-7 analogues. Compounds 1–9 were C-7 conjugates that differ in their substitution patter on the C-7 aromatic ring. Four compounds were C-3 conjugates (compounds 10, 14, 15, and 18). Compounds 13 and 19 were both C-3 and C-7 analogues. Compound 16 lacked conjugation at C-3 and C-17. Of the 19 compounds, 11 employed UDCA as the bile acid and five employed CDCA as the bile acid. UDCA is the 7-β epimer of the primary bile acid CDCA.
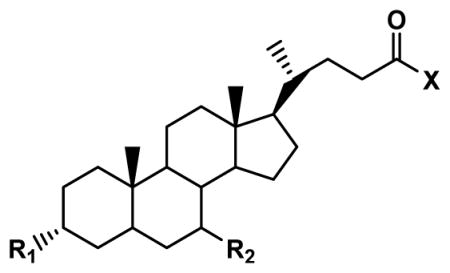
Table 1.
Structures and Ki values of bile acid conjugates. Inhibitory Ki value was measured against ASBT and NTCP. Compounds varied in terms of structural features at C-3, C-7, and the C-24 region. Compounds 1 – 9 are C-7 conjugates with a negative change in the C-24 region. Ki ranged from single μM to non-inhibitor.
 | ||||||
|---|---|---|---|---|---|---|
| No. | Structure | Ki (μM) | ||||
| R1 | R2 | R3 | X | ASBT | NTCP | |
| 1 | OH |
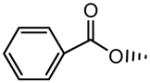
|
H | OH | 5.79±0.80 | 15.4±2.7 |
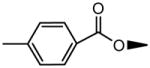
| 2 | OH |

|
H | OH | 8.19±1.56 | 24.4±4.5 |
| 3 | OH |

|
H | OH | 10.3±1.1 | 183±32 |
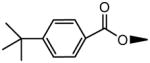
| 4 | OH |
|
H | OH | 13.4±2.6 | 198±72 |
| 5 | OH |
|
H | OH | 30.8±6.8 | 264±82 |
| 6 | OH |
|
H | OH | 34.2±4.0 | 11.7±2.5 |
| 7 | OH |
|
H |
|
8.39±2.52 | 2.55±0.17 |
| 8 | OH |

|
H |
|
15.2±0.8 | 11.8±2.1 |
| 9 | OH |

|
H |
|
15.6±2.2 | 9.29±1.80 |
| 10 |
|
|
H |
|
6.45±0.66 | 5.38±0.44 |
| 11 | OH |
|
H | OH | 95.5±14.9 | 10.3±2.30 |
| 12 | OH |
|
H |

|
20.4±2.6 | 4.21±0.44 |
| 13 |
|
|
|
OH | No inhibition | 355±59 |
| 14 |
|
|
H |
|
6.73±0.60 | No inhibition |
| 15 |

|
|
H |

|
73.9±5.6 | 10.7±0.7 |
| 16 | OH |
|
H | OCH3 | 29.8±5.1 | 1.22±0.10 |
| 17 | OH |
|
H |
|
140±31.2 | 136±15 |
| 18 |

|
|
H | OCH3 | No inhibition | No inhibition |
| 19 |

|
|
H | OCH3 | No inhibition | No inhibition |
| CDCA | OH |
|
H | OH | 1.94±0.17a | 0.939±0.057 |
| UDCA | OH |
|
H | OH | 22.6±3.0a | 4.90±0.47 |
3.2 Inhibition study
Table 1 lists compound Ki values against ASBT and NTCP. Binding affinity ranged from strong inhibition with Ki in the single micromolar range, to non-inhibitor. Figure 4 illustrates the inhibition of taurocholate by 7-(4-fluorobenzoyloxy) ursodeoxycholate [compound 3] in ASBT-MDCK monolayers. Taurocholate uptake was inhibited by relatively low concentrations of 7-(4-fluorobenzoyloxy) ursodeoxycholate, which is a C-7 conjugate of UDCA.
Figure 4.

Inhibition profile for 7-(4-fluorobenzoyloxy) ursodeoxycholate [i.e. compound 3] in ASBT- MDCK monolayers. Ki was 10.3 μM.
3.2.1 Conjugation at C-7
C-7 conjugation in CDCA had negative impact on binding. Ki of CDCA against ASBT was 1.94 (±0.17) μM (Balakrishnan et al., 2006b) and against NTCP was measured here to be 0.939 (±0.057) μM, which represent a very potent inhibition of each transporter. From compound 1, conjugation at C-7 in CDCA minimally reduced ASBT inhibition potency to Ki = 5.79 (±0.08) μM, but reduced NTCP inhibition potency to a greater extent with Ki = 15.4 (±2.7) μM.
Meanwhile, C-7 conjugation in UDCA generally promoted inhibition potency in ASBT, but hindered NTCP binding affinity, as assessed using compounds 2, 3, and 4. Ki of UDCA against ASBT was 22.6 (±3.0) μM (Balakrishnan et al., 2006b) and against NTCP was measured here to be 4.90 (±0.47) μM, which represent strong inhibition of each transporter. Compounds 2, 3, and 4 modestly improved ASBT inhibition. Compounds 3 and 4 were weak NTCP inhibitors. Compound 6 with the C-7 nicotinoyl substituent did not practically differ from UDCA in terms of binding affinity for ASBT and NTCP.
Glycine was attached at C-24 to lower passive permeability, since high passive permeability can cause inability to differentiate between the active and passive components, making it difficult to differentiate a substrate from a nonsubstrate. Conjugation with glycine at C-24 dominated changes in C-7 steroidal substitution effects, for both ASBT and NTCP. Comparing compound 7 (Ki = 8.39 μM for ASBT and Ki = 2.55 μM for NTCP) to compound 3, and comparing compound 8 (Ki = 15.2 μM for ASBT and Ki = 11.8 μM for NTCP) to compound 6, binding potency was generally increased. The effect was most significant in the fluorobenzene moiety in compound 3 for NTCP, where Ki changed from 183 (±32) μM for C-24 unconjugated to 2.55 μM after glycine conjugation. This dramatic change in inhibition potency from weak to strong inhibitor highlights the favorable effect of C-24 conjugation on binding.
Of note, two pairs of C-7 conjugates differ in only the C-7 orientation. Compounds 1 and 2 are an epimer pair, derived from CDCA and UDCA respectively, and each being a C-7 benzoyl conjugate. Compound 1 is the C-7 α hydroxyl conjugate, where reactant CDCA possesses a C-7 α hydroxyl group (i.e. axially oriented) (Thomas et al., 2008). Compound 2 is the C-7 β hydroxyl conjugate (i.e. equatorial orientation of the C-7 benzoyl conjugate). Compounds 8 and 9 are the second epimer pair. In each case, there was no epimer effect on ASBT or NTCP binding, and all four compounds were potent inhibitors.
Figure 5 shows the ASBT and NTCP inhibition profiles by 7-nicotinoyl glycoursodeoxycholate (compound 8), which is a C-7 conjugate. Conjugation at C-7 resulted in competitive inhibition of each ASBT and NTCP, as indicated by the inhibition data of compound 8. Figure 5 panel A plots the results for ASBT-MDCK cells, while panel B plots the results for NTCP-HEK cells. The studies were performed at I/Ki = 10, which is a preferred condition in order to correctly identify the type of inhibition (Kolhatkar and Polli, 2010). The competitive model was the best fitting model in both cases, indicating this compound to be a competitive inhibitor of each ASBT and NTCP.
Figure 5.

Nonconventional inhibition data for 7-nicotinoyl glycoursodeoxycholate [Compound 8] in (A) ASBT-MDCK monolayers and (B) NTCP-HEK monolayers. Inhibitor concentration was 152 μM and 118 μM in ASBT and NTCP studies, whereas taurocholate concentration varied from 1–200 μM. The competitive model was the best fitting model in both cases.
3.2.2 Oxidation of C-7 hydroxyl to keto
Compounds 11–13 were evaluated to determine effect of conjugation of a smaller ketone functional group. 7-oxo cholanic acid (compound 11) was less potent with only moderate binding affinity (Ki = 95.5 μM) to ASBT, compared to its 7-hydroxyl counterparts (i.e. CDCA and UDCA). Although compound 11 was a strong inhibitor of NTCP (Ki = 10.3 μM), this Ki was higher than CDCA and UDCA. Conjugation of compound 11 with glycine (i.e. compound 12) increased inhibition potency to 20.4 (±2.6) μM and 4.21 (±0.44) μM in ASBT and NTCP, respectively, in agreement with C-24 glyco-conjugation effect on C-7 analogues. In Table 1, dehydrocholic acid (compound 13) did not inhibit ASBT and was a weak inhibitor of NTCP.
3.2.3 Structural changes in C-3 region
Compounds 10, 14, 15, and 18 were C-3 conjugates. Conjugation of a nicotinoyl group at C-3 of glycochenodeoxycholate (i.e. compound 10) yielded strong inhibition of ASBT and NTCP.
Compounds 14 and 15 were evaluated to study effect of charge on conjugation at C-3. The introduction of a hemisuccinate group at C-3 in compound 14 and 15 allowed for the study of the effect of a negative charge at C-3. For compound 14, the carboxylic acid in the C-24 region was protected by a benzyl group, such that compound 14 was monoanionic by virtue of the negative charge at C-3. Compound 15 was dianionic, with one charge at C-3 and the other in the C-24 region. Compound 14 was a strong inhibitor of ASBT with Ki = 6.73 μM, but did not inhibit NTCP. Interestingly, compound 15 was a moderate inhibitor of ASBT, and a strong inhibitor of NTCP.
Compound 18 was not an inhibitor of either ASBT or NTCP, even though compound 18 has similarity to compound 6 and compound 10, which were each much stronger inhibitors. For example, compound 18 has the same nicotinoyl group conjugated at C-3 instead to C-7 in compound 6. However, compound 18 differs from compounds 6 and 10 by it being a methyl ester (i.e. neutral).
One compound studied that was neither a C-3 nor C-7 conjugate was compound 16. Compound 16 (methyl ursodeoxycholate) was studied to identify contribution of conjugation in C-24 region towards interactions observed with the transporters. Esterification of the C-24 carboxylate with methyl (compound 16) did not change binding affinity, compared to compound UDCA. Ki of compound 16 was 29.8 μM and 1.22 μM in ASBT and NTCP, respectively, which are similar to that of UDCA for these transporters. This lack of effect on C-24 esterification on ASBT inhibition has been observed previously and is the general case (Balakrishnan et al., 2006a), which further affords the lack of inhibition by compound 18 even more surprising.
3.2.4 Effect of modification at both C-3 and C-7
Compounds 13 and 19 were both C-3 and C-7 analogues, although they substantially differed chemically. Compound 13 was a tri-keto analogue of cholic acid. It did not inhibit ASBT and only weakly inhibited NTCP. Compound 19, which lacks steroidal hydroxyl groups inhibited neither, ASBT nor NTCP.
3.3 Uptake study
Uptake studies into ASBT and NTCP were performed for compounds 1, 5, 6, 8, 9, 10, 12, and 14 (only ASBT for compound 14). These compounds showed inhibition of ASBT and NTCP, except compound 14 did not inhibit NTCP. Table 2 lists uptake parameters Kt, normalized Jmax, and Pp. Of these eight compounds, six are C-7 analogues (i.e. compounds 1, 5, 6, 8, 9, and 12); while two are C-3 analogues (i.e. compound 10 and 14).
Table 2.
Structures and uptake kinetic parameters of bile acid conjugates. Uptake was measured across ASBT and NTCP. Kt, norm Jmax, and Pp are the transporter Michaelis-Menten parameters, transporter capacity parameter, and compound passive permeability. Compound 10 was the most potent ASBT substrate. Compound 10 and 12 were about equi-potent as NTCP sustrates. C-7 conjugates were either non-substrates or could not be determined to be substrates, due to high passive permeability.
 | |||||||||
|---|---|---|---|---|---|---|---|---|---|
| No | Structure | ASBT | NTCP | ||||||
| R1 | R1 | X | Kt (μM) | Norm Jmax | Pp*106 (cm/s) | Kt (μM) | Norm Jmax | Pp*106 (cm/s) | |
| 1 | OH |
|
OH | NS | NS | 21.3±1.8 | ND | ND | 85.6±14.3 |
| 5 | OH |
|
OH | NS | NS | 2.41±0.27 | NS | NS | 2.17±0.09 |
| 6 | OH |
|
OH | NS | NS | 21.2±0.9 | NS | NS | 7.11±0.23 |
| 8 | OH |

|
|
NS | NS | 0.95±0.05 | NS | NS | 7.26±0.45 |
| 9 | OH |

|
|
NS | NS | 0.88±0.01 | NS | NS | 0.73±0.04 |
| 10 |
|
|
|
8.49±1.34 | 2.1 | 5.62±0.13 | 16.3±3.0 | 1.48 | 12.7±0.9 |
| 12 | OH |
|
|
34.0±7.64 | 0.8 | 0.25±0.06 | 20.7±3.9 | 1.57 | 1.75±0.49 |
| 14 |
|
|
|
NS | NS | 24.9±1.1 | - | - | - |
| CDCA | OH |
|
OH | ND | ND | 20.7±0.7a | ND | ND | 60.7±0.5 |
| UDCA | OH |
|
OH | ND | ND | 21.2±0.9a | ND | ND | 27.2±0.8 |
ND = not determinable due to high passive permeability
NS= not substrate
In spite of all being ASBT and NTCP inhibitors, none of the C-7 analogues were apparently translocated by ASBT or NTCP. In Table 2, kinetic parameters reflect that they did not demonstrate active transport. Figure 6 shows practically the same uptake of 7-nicotinoyl glycoursodeoxycholate (compound 8) in presence and absence of sodium in ASBT-MDCK monolayers. Thus, compound 8 was not a substrate of ASBT. Qualitatively similar plots were obtained for uptake of this and other compounds (1, 5, 6, 8, 9, and 14) in ASBT-MDCK and NTCP-HEK cells. Pp ranged from 0.254 × 10⁻⁶ to 21.3 × 10⁻⁶ cm/s in ASBT-MDCK, and ranged from 0.727 × 10⁻⁶ to 85.6 × 10⁻⁶ cm/s in NTCP-HEK.
Figure 6.

Concentration-dependent uptake profile for 7-nicotinoyl glycoursodeoxycholate [i.e. compound 8] into ASBT-MDCK monolayers. Compound 8 was not an ASBT substrate since it exhibited similar uptakes in the presence (●) and in the absence (○) of sodium.
Based on Pp of a compound, its highest Kt that was detectable was estimated (see appendix). Subsequently, analogues were classified as non-substrate (NS) or not determinable (ND). Non-substrates are denoted to demonstratively not to be substrates. Not determinable denotes that apparent uptake was not observed, but that being a substrate could not be excluded, since sufficiently high passive permeability may possibly obscure active uptake.
In Figure 7, the uptake study for 3-nicotinoyl glycochenodeoxycholate (compound 10) showed higher uptake with sodium than without sodium in both ASBT-MDCK monolayers and NTCP-HEK monolayers. Hence, compound 10 was a substrate of both transporters. Kinetic parameters (Table 2) were in the range of native bile acids. Kt was 8.49 μM for ASBT and 16.3 μM for NTCP, compared to taurocholate Kt of 5.03 μM and 5.31 μM, respectively. Jmax of compound 10 was 0.000242 nmol/s/cm2 and 0.00298 nmol/s/cm2 for ASBT and NTCP, respectively. As Jmax varies with transporter expression level, the Jmax values were normalized to the measured Jmax of taurocholate on the same study day, yielding normalized Jmax of compound 10 to be 2.11 and 1.48 for ASBT and NTCP, respectively. Hence, its Jmax was about twice than that of taurocholate for ASBT, and about 50% higher than that of taurocholate for NTCP. Of note, substitution with the same nicotinoyl group at position 7 (i.e. compound 9) yielded a non-substrate.
Figure 7.

Concentration-dependent uptake profile for 3-nicotinoyl glycochenodeoxycholate [i.e. compound 9] into (A) ASBT-MDCK monolayers and (B) NTCP-HEK monolayers. For each transporter, uptake was greater in the presence of sodium (●) than in the absence (○) of sodium, indicating this compound to be both ASBT and NTCP substrate.
Compound 12 was also a substrate of both ASBT and NTCP. Figure S1 shows the uptake profile in ASBT and NTCP. Its substrate parameters were comparable to native bile acids. Compound 14 was not an ASBT substrate. This finding was in accordance with previous observations that a single negative charge in C-24 region promotes transport by ASBT. This compound was not evaluated for uptake in NTCP-HEK cells since it did not show NTCP inhibition.
4. DISCUSSION
ASBT and NTCP represent the ileal and hepatic bile acid transporters that have a vital role in gut absorption and hepatic extraction of bile acids during enterohepatic recycling. These bile acid transporters have seven transmembrane domains with 35% sequence identity and 63% amino acid sequence similarity (Balakrishnan and Polli, 2006; Banerjee and Swaan, 2006; Hagenbuch and Meier, 1994). Both transport native bile acids with high capacity and efficiency. It has been suggested that the hepatic bile acid transporter exhibits a much broader specificity for interaction than the ileal transporter, although little data has compared the substrate requirements of ASBT and NTCP (Bhat et al., 2005; Kramer et al., 1999; Kramer et al., 1997). The present work was motivated in part to compare the ASBT and NTCP activities of a single set of compounds, in order to elucidate the similarities and differences between these transporters.
Studies here were also intended to evaluate structural modifications in C-7 chemical space. Prior reports investigating the ileal and hepatic bile acid transporters were limited to the structural changes in C-24 region or C-3 regions (Balakrishnan et al., 2006a; Bhat et al., 2005; Gonzalez et al., 2009; Kramer et al., 1992; Kramer et al., 1994; Rais et al., 2010a; Rais et al., 2010b; Swaan et al., 1997; Zheng et al., 2010). No reports examined the effect of structural modifications in the C-7 chemical space on compound interactions with either ASBT or NTCP. Analogue modifications in this region were hypothesized to be able to modulate interaction with these transporters, including providing a new perspective to rational prodrug design that targets these transporters and liver-specific delivery.
4.1 Conjugate synthesis
A total of 17 conjugates were synthesized. Substituted aromatic rings such as benzene and pyridine, the most common frames among existing drugs, were conjugated to bile acids CDCA or UDCA (Bemis and Murcko, 1996). Successful synthesis of C-7 acyl derivatives was based on the difference in C-3 and C-7 hydroxyl groups reactivities (Kritchevsky et al., 1986). Most analogues employed UDCA, since UDCA is less toxic than CDCA (Trauner and Graziadei, 1999).
4.2 Inhibition study
Figure 8 plots log Ki in NTCP against log Ki in ASBT for all 19 compounds. The compounds that did not show inhibition were assigned Ki = 1000 μM. In Figure 8, there was a weak correlation between ASBT logKi and NTCP logKi (R2 = 0.24). If plotted using Ki values that are not log transformed, R2 = 0.46 due to effect of non-inhibitors. Compounds can be segregated into three groups, depending on relative inhibition affinities against ASBT and NTCP.
Figure 8.

Plot of log Ki against NTCP versus log Ki against ASBT. Inhibition data can be classified in three groups: equi-potent inhibitors, ASBT-preferred inhibitors, NTCP-preferred inhibitors.
4.2.1 Group A: Equi-potent inhibitors
Most compounds showed similar affinities for ASBT and NTCP: compounds 1, 2, 6–10, 13, and 17–19. For this subset of compounds, there was a strong correlation between ASBT logKi and NTCP logKi (R2 = 0.88; R2 = 0.88 if Ki values are not log transformed). Compound 1, 2, and 6 include unsubstituted aromatic groups conjugated at C-7 that showed strong-to-moderate inhibition of the transporters. For compounds 7–10, glycine conjugation dominated the steroidal substitution, resulting in potent inhibition. Compound 13 did not show any ASBT inhibition and was also a weak NTCP inhibitor; the distorted shape of its steroidal nucleus due to ketone substitution at 3, 7, and 12 may be responsible for its relative lack of affinity. For compounds 17–19, which possess aromatic substitution at C-3 and/or C-7, steric hindrance at the possible binding sites may hamper activity.
4.2.2 Group B: ASBT-preferred inhibitors
Four compounds showed higher affinity for ASBT than NTCP: compound 3, 4, 5, and 14. Although previous literature reports suggested NTCP exhibits much broader substrate specificity, these compounds showed a strong affinity for ASBT and demonstrated weak or no inhibition of NTCP. Among these four compounds, compounds 3, 4, and 5 are similar compounds that displayed the pattern where increased substituent size reduced ASBT and NTCP affinity (F < CH3 < t-butyl). The effect was more pronounced in NTCP, with NTCP Ki of about 200 μM or higher.
Compound 14 has a benzyl ester in the C-24 region and carboxylate group in C-3 region. This compound was a strong inhibitor of ASBT but lacked affinity for NTCP. The lack of affinity may not be due to the charge in the C-3 region, but rather due to the presence of the bulky benzyl group in C-24 region, which may hinder interaction with the transporter binding site. Removal of this benzyl group (i.e. compound 15) afforded a strong NTCP inhibitor. Strong ASBT inhibition by compound 14 but lack of NTCP inhibition suggests differences in binding sites between these transporters that involves the C-24 bile acid region.
4.2.3. Group C: NTCP-preferred inhibitors
Five compounds showed higher affinity for NTCP than ASBT: compound 11, 12, 15 and 16. Compound 11 was a strong NTCP inhibitor but a moderate ASBT inhibitor, indicating that oxidation of the 7-hydroxyl group to ketone reduced affinity for ASBT. This observation was similar to that of Kramer et al. where oxidation of the 12-hydroxyl group in cholic acid to keto reduced affinity for the rabbit ileal bile acid transporter (Kramer et al., 1999). Removal of this ketone functional group at C-7 and C-12 yields lithocholic acid and chenodeoxycholic acid, respectively, which each have a strong ASBT affinity (Balakrishnan et al., 2006b). A ketone group perhaps distorts the steroid nucleus structure, reducing affinity for ASBT but not NTCP affinity. Although compound 11 was a strong inhibitor of NTCP, its Ki was higher than that of UDCA and CDCA in NTCP. As expected, conjugation with glycine (compound 12) improved binding affinity of compound 11 in ASBT and NTCP.
Compound 15 was a strong inhibitor of NTCP but only a moderate inhibitor of ASBT. Compared to compound 14, compound 15 involves the removal of the benzyl group at C-24, which allowed more potent interaction with NTCP, but reduced binding with ASBT.
Compound 16 was a strong inhibitor for ASBT and NTCP, although it possessed higher affinity for NTCP. Its Ki values were similar to that of UDCA. Compared to UDCA, compound 16 involves methyl esterification of the C-24 carboxylic acid, which did not affect affinity, especially when 3- and 7- hydroxyl groups were not conjugated.
4.3 Uptake study
A C-3 analogue, compound 10 afforded active uptake by ASBT and NTCP, with substrate parameters comparable to that of native bile acids. Compound 12 also demonstrated active uptake by both transporters. None of the five C-7 conjugates (i.e. compounds 1, 5, 6, 8, and 9) were a substrate of either ASBT or NTCP. The aromatic ring at C-7 in these five appears to disallow translocation. Meanwhile, the C-7 keto in compound 12 was translocated across both ASBT and NTCP, perhaps due to the smaller size of the ketone functional group versus the aromatic ring, or a ketone allows similar interactions as a native hydroxyl group.
Interestingly, uptake results across ASBT and NTCP were similar, in spite of greater difference in inhibition data. Hence, results from combined inhibition and uptake studies suggest differences in initial binding sites between ASBT and NTCP, whereas solute translocation involves similar interaction in ASBT and NTCP. An prodrug that targets hASBT and hNTCP would ideally be a strong substrate for both transporters.
NTCP has previously been shown to transport non-steroidal molecules, such as rosuvastatin (Ho et al., 2006). Substrate specificity of ASBT was though to be limited to bile acids. However, we recently identified non-bile acid small molecules as substrates of ASBT (Kolhatkar et al., 2011). Whether rosuvastatin is a substrate of ASBT remains to be examined. Nevertheless, such studies that compare inhibition, as well as uptake, in both transporters have the potential to provide insights into the solute interaction with these transporters.
4.4 Comparison to previous studies
Baringhaus et al. developed a pharmacophore model based on a training set of 17 diverse rabbit Asbt inhibitors (Baringhaus et al., 1999). This model had five features: one hydrogen bond donor, one hydrogen bond acceptor, and three hydrophobic features. Native bile acids, including taurocholate, taurochenodeoxycholate and taurodeoxycholate, mapped only four of the five features. The model mapped the 12 α-hydroxy group in taurocholate as a hydrogen bond donor. The high affinity and uptake rate for CDCA (i.e. 3 α- and 7 α-hydroxyl bile acid) was explained by the 7 α-hydroxyl group as the hydrogen bond donor in absence of 12 α-hydroxy group. The 3 α-hydroxy group which is present in all native bile acids did not map any specific feature in the model. However, lithocholic acid, which lacks 12 α- and 7 α-hydroxyls and only possesses a 3 α-hydroxyl group, had high affinity and uptake rates for ASBT (Balakrishnan et al., 2006b). In addition to not mapping the 3 α-hydroxyl group, this model of Baringhaus et al. did not map any interaction with steroidal ring A and suggested that steroidal ring A or position 3 may serve as attachment for drug moieties for drug delivery.
However, Bhat et al. attached a substituted pyrazole to glycocholic acid (i.e. 7 α- and 12 α-hydroxyl bile acid) via steroidal ring A (Bhat et al., 2005). The conjugate showed only weak interaction with ASBT. Another compound with substituted pyrazole attached to ring A but with no steroidal hydroxyl groups was a strong inhibitor of ASBT and NTCP, and was translocated by ASBT (Bhat et al., 2005). No pharmacophore model has explained these results.
In conclusion, results show that ASBT and NTCP accommodate a wide range of substituents for binding, but that all major C-7 modifications resulted in analogues that were not translocated by either ASBT or NTCP. Interestingly, a C-3 modification that was not tolerated at C-7 still afforded translocation via ASBT and NTCP, further confirming the relative unacceptability of C-7 modification. Results also characterize the relative promiscuity of ASBT and NTCP. Compared to ASBT, NTCP demonstrated a generally similar binding potency across compounds, although showed less binding affinity toward C-24 unconjugated bile acids with aromatic substitution at C-7. Results suggest that drug conjugation of drug to the C-3 hydroxyl group, rather than C-7, has potential to provide as a bile acid transporter prodrug strategy.
Supplementary Material
Acknowledgments
This work was support in part by National Institutes of Health (Grant DK67530).
LIST OF ABBREVIATIONS
- ASBT
apical sodium dependent bile acid transporter
- NTCP
sodium-taurocholate cotransporting polypeptide
- HBSS
Hank’s balanced salt solution
- SFB
sodium-free buffer
- UDCA
ursodeoxycholic acid
- CDCA
chenodeoxycholic acid
- TCA
taurocholic acid
APPENDIX
The objective was to identify a decision tool to conclude when a compound is a non-substrate.
Decision tool derivation
Transport of a substrate across a transporter-expressing monolayer involves active and passive flux, as represented by eqn A1.
| eqn A1 |
where Jt is total flux.
Distinguishing a substrate from a non-substrate depends on the ability to differentiate between total and passive flux. Passive flux depends on Pp and substrate concentration. Pp is generally independent of experimental conditions. Flux due to transporter-mediated translocation depends on Kt, transporter expression level, and substrate concentration. However, high Pp and/or high substrate concentration can cause inability to differentiate between the active and passive components, since passive flux can dominate. This inability to differentiate is most problematic for substrates with high Kt (i.e. low affinity substrates).
when S = Kt, eqn A1 yields
| eqn A3 |
where Jp is the passive flux under this condition (i.e. J p = Pp · Kt ).
Assuming Jt = 2J p and substituting into eqn A3,
| eqn A4 |
| eqn A5 |
Substituting J p = Pp · Kt into eqn A5
| eqn A6 |
| eqn A7 |
Eqn A7 delineates the requisite condition when total flux is twice the passive flux when S = Kt. Since it is assumed that substrates cannot be differentiated from non-substrates when Jt < 2 · Pp S , eqn A7 identifies the highest Kt value that allows for substrates to be differentiated from non-substrates. Hence, eqn A7 is re-written
| eqn A8 |
where Ktmax is not the actual Kt of the substrate, but the maximum allowable Kt that will allow Jt ≥ 2 · Pp S , when S = Kt.
Eqn A8 indicates that two factors promote the differentiation of substrates from non-substrates when S = Kt: high Jmax and low P. That is, compounds with low affinity (i.e. higher Kt) can be discerned as substrates or non-substrates, provided they have sufficiently high Jmax or low Pp.
Implications of eqn A8 were confirmed by simulations performed under varying Pp, Jmax values, and Kt values. Calculations confirmed that if , then J t < 2 P p S , which presumably affords an experiment to not be able to differentiate a substrate from a non-substrate.
It should be noted that this above approach assumes that an experiment employs S = Kt. However, uptake studies often use substrate concentrations above Kt, which only makes differentiating between substrates and non-substrates more difficult, due to an increasing relative contribution of passive flux.
Application
Table 2 shows several compounds were concluded to not be substrates. From eqn A8, their estimated Ktmax ranged from about 10 – 1000 μM. Experiments below the estimated Ktmax found total flux was the same, either with or with sodium, such that non-substrate was concluded.
In Table 2, one compound (compound 1) was not determinable – i.e. it was not possible to differentiate whether it was a non-substrate or that its active uptake was not measurable. The compound’s high permeability (Pp = 85.6 × 10⁻⁶ cm/s) and assumed Jmax equal to taurcholate resulted in Ktmax equal to about 1 μM. An analytical method could not be developed to measure drug uptake from a donor concentration of 1 μM. Experiments using S = 10 μM found total flux was the same, either with or with sodium. However, since the S was above the estimated Ktmax, it was conservatively concluded that active uptake was not determinable, although perhaps others would conclude compound 1 not to be a substrate.
Footnotes
Publisher's Disclaimer: This is a PDF file of an unedited manuscript that has been accepted for publication. As a service to our customers we are providing this early version of the manuscript. The manuscript will undergo copyediting, typesetting, and review of the resulting proof before it is published in its final citable form. Please note that during the production process errors may be discovered which could affect the content, and all legal disclaimers that apply to the journal pertain.
References
- Alrefai WA, Gill RK. Bile acid transporters: structure, function, regulation and pathophysiological implications. Pharm Res. 2007;24:1803–1823. doi: 10.1007/s11095-007-9289-1. [DOI] [PubMed] [Google Scholar]
- Balakrishnan A, Hussainzada N, Gonzalez P, Bermejo M, Swaan PW, Polli JE. Bias in estimation of transporter kinetic parameters from overexpression systems: Interplay of transporter expression level and substrate affinity. J Pharmacol Exp Ther. 2007;320:133–144. doi: 10.1124/jpet.106.107433. [DOI] [PubMed] [Google Scholar]
- Balakrishnan A, Polli JE. Apical sodium dependent bile acid transporter (ASBT, SLC10A2): a potential prodrug target. Mol Pharm. 2006;3:223–230. doi: 10.1021/mp060022d. [DOI] [PMC free article] [PubMed] [Google Scholar]
- Balakrishnan A, Sussman DJ, Polli JE. Development of stably transfected monolayer overexpressing the human apical sodium-dependent bile acid transporter (hASBT) Pharm Res. 2005;22:1269–1280. doi: 10.1007/s11095-005-5274-8. [DOI] [PubMed] [Google Scholar]
- Balakrishnan A, Wring SA, Coop A, Polli JE. Influence of charge and steric bulk in the C-24 region on the interaction of bile acids with human apical sodium-dependent bile acid transporter. Mol Pharm. 2006a;3:282–292. doi: 10.1021/mp0600135. [DOI] [PMC free article] [PubMed] [Google Scholar]
- Balakrishnan A, Wring SA, Polli JE. Interaction of native bile acids with human apical sodium-dependent bile acid transporter (hASBT): influence of steroidal hydroxylation pattern and C-24 conjugation. Pharm Res. 2006b;23:1451–1459. doi: 10.1007/s11095-006-0219-4. [DOI] [PMC free article] [PubMed] [Google Scholar]
- Banerjee A, Swaan PW. Membrane topology of human ASBT (SLC10A2) determined by dual label epitope insertion scanning mutagenesis. New evidence for seven transmembrane domains. Biochemistry. 2006;45:943–953. doi: 10.1021/bi052202j. [DOI] [PMC free article] [PubMed] [Google Scholar]
- Baringhaus KH, Matter H, Stengelin S, Kramer W. Substrate specificity of the ileal and the hepatic Na(+)/bile acid cotransporters of the rabbit. II. A reliable 3D QSAR pharmacophore model for the ileal Na(+)/bile acid cotransporter. J Lipid Res. 1999;40:2158–2168. [PubMed] [Google Scholar]
- Bemis GW, Murcko MA. The properties of known drugs. 1 Molecular frameworks. J Med Chem. 1996;39:2887–2893. doi: 10.1021/jm9602928. [DOI] [PubMed] [Google Scholar]
- Bhat L, Jandeleit B, Dias TM, Moors TL, Gallop MA. Synthesis and biological evaluation of novel steroidal pyrazoles as substrates for bile acid transporters. Bioorg Med Chem Lett. 2005;15:85–87. doi: 10.1016/j.bmcl.2004.10.027. [DOI] [PubMed] [Google Scholar]
- Bortolini O, Fantin G, Fogagnolo M, Mari L. Two-way enantioselective control in the epoxidation of alkenes with the keto bile acid–Oxone® system. Tetrahedron. 2006;62:4482–4490. [Google Scholar]
- Gonzalez PM, Polli JE. Impact of impurity on kinetic estimates from transport and inhibition studies. J Pharmacol Exp Ther. 2008;326:296–305. doi: 10.1124/jpet.107.135863. [DOI] [PMC free article] [PubMed] [Google Scholar]
- Gonzalez PM, Acharya C, Mackerell AD, Jr, Polli JE. Inhibition requirements of the human apical sodium-dependent bile acid transporter (hASBT) using aminopiperidine conjugates of glutamylbile acids. Pharm Res. 2009;26:1665–1678. doi: 10.1007/s11095-009-9877-3. [DOI] [PMC free article] [PubMed] [Google Scholar]
- Hagenbuch B, Meier PJ. Molecular cloning, chromosomal localization, and functional characterization of a human liver Na+/bile acid cotransporter. J Clin Invest. 1994;93:1326–1331. doi: 10.1172/JCI117091. [DOI] [PMC free article] [PubMed] [Google Scholar]
- Han YH, Busler D, Hong Y, Tian Y, Chen C, Rodrigues AD. Transporter studies with the 3-O-sulfate conjugate of 17alpha-ethinylestradiol: assessment of human liver drug transporters. Drug Metab Dispos. 2010;38:1072–1082. doi: 10.1124/dmd.109.031518. [DOI] [PubMed] [Google Scholar]
- Ho RH, Tirona RG, Leake BF, Glaeser H, Lee W, Lemke CJ, Wang Y, Kim RB. Drug and bile acid transporters in rosuvastatin hepatic uptake: function, expression, and pharmacogenetics. Gastroenterology. 2006;130:1793–1806. doi: 10.1053/j.gastro.2006.02.034. [DOI] [PubMed] [Google Scholar]
- Kolhatkar V, Diao L, Acharya C, MacKerell AD, Polli JE. Identification of novel non-steroidal compounds as substrates or inhibitors of hASBT. Journal of pharmaceutical sciences. 2011 doi: 10.1002/jps.22728. (in press) [DOI] [PubMed] [Google Scholar]
- Kolhatkar V, Polli JE. Reliability of inhibition models to correctly identify type of inhibition. Pharm Res. 2010;27:2433–2445. doi: 10.1007/s11095-010-0236-1. [DOI] [PMC free article] [PubMed] [Google Scholar]
- Kramer W. Transporters, Trojan horses and therapeutics: suitability of bile acid and peptide transporters for drug delivery. Biol Chem. 2011;392:77–94. doi: 10.1515/BC.2011.017. [DOI] [PubMed] [Google Scholar]
- Kramer W, Stengelin S, Baringhaus KH, Enhsen A, Heuer H, Becker W, Corsiero D, Girbig F, Noll R, Weyland C. Substrate specificity of the ileal and the hepatic Na(+)/bile acid cotransporters of the rabbit. I. Transport studies with membrane vesicles and cell lines expressing the cloned transporters. J Lipid Res. 1999;40:1604–1617. [PubMed] [Google Scholar]
- Kramer W, Wess G, Neckermann G, Schubert G, Fink J, Girbig F, Gutjahr U, Kowalewski S, Baringhaus KH, Boger G. Intestinal absorption of peptides by coupling to bile acids. J Biol Chem. 1994;269:10621–10627. [PubMed] [Google Scholar]
- Kramer W, Wess G, Schubert G, Bickel M, Girbig F, Gutjahr U, Kowalewski S, Baringhaus KH, Enhsen A, Glombik H. Liver-specific drug targeting by coupling to bile acids. J Biol Chem. 1992;267:18598–18604. [PubMed] [Google Scholar]
- Kramer W, Wess G, Enhsen A, Falk E, Hoffmann A, Neckermann G, Schubert G, Urmann M. Modified bile acids as carriers for peptides and drugs. J Controlled Release. 1997;46:17–30. [Google Scholar]
- Kritchevsky D, Poli G, Scolastico C, Sirtori CR. Novel derivatives of 3 alpha,7 alpha-dihydroxy-5 beta-cholan-24-oic acid (chenodeoxycholic acid) and 3 alpha,7 beta-dihydroxy-5 beta-cholan-24-oic acid (ursodeoxycholic acid) Steroids. 1986;47:41–48. doi: 10.1016/0039-128x(86)90075-9. [DOI] [PubMed] [Google Scholar]
- Kullak-Ublick GA, Glasa J, Boker C, Oswald M, Grutzner U, Hagenbuch B, Stieger B, Meier PJ, Beuers U, Kramer W, Wess G, Paumgartner G. Chlorambucil-taurocholate is transported by bile acid carriers expressed in human hepatocellular carcinomas. Gastroenterology. 1997;113:1295–1305. doi: 10.1053/gast.1997.v113.pm9322525. [DOI] [PubMed] [Google Scholar]
- Kullak-Ublick GA, Stieger B, Meier PJ. Enterohepatic bile salt transporters in normal physiology and liver disease. Gastroenterology. 2004;126:322–342. doi: 10.1053/j.gastro.2003.06.005. [DOI] [PubMed] [Google Scholar]
- Rais R, Acharya C, Mackerell AD, Polli JE. Structural determinants for transport across the intestinal bile acid transporter using C-24 bile acid conjugates. Mol Pharm. 2010a;7:2240–2254. doi: 10.1021/mp100233v. [DOI] [PMC free article] [PubMed] [Google Scholar]
- Rais R, Acharya C, Tririya G, Mackerell AD, Polli JE. Molecular switch controlling the binding of anionic bile acid conjugates to human apical sodium-dependent bile acid transporter. J Med Chem. 2010b;53:4749–4760. doi: 10.1021/jm1003683. [DOI] [PMC free article] [PubMed] [Google Scholar]
- Rais R, Fletcher S, Polli JE. Synthesis and in vitro evaluation of gabapentin prodrugs that target the human apical sodium-dependent bile acid transporter (hASBT) J Pharm Sci. 2011;100:1184–1195. doi: 10.1002/jps.22332. [DOI] [PubMed] [Google Scholar]
- Rais R, Gonzalez PM, Zheng X, Wring SA, Polli JE. Method to screen substrates of apical sodium-dependent bile acid transporter. AAPS J. 2008;10:596–605. doi: 10.1208/s12248-008-9069-9. [DOI] [PMC free article] [PubMed] [Google Scholar]
- Sievanen E. Exploitation of bile acid transport systems in prodrug design. Molecules. 2007;12:1859–1889. doi: 10.3390/12081859. [DOI] [PMC free article] [PubMed] [Google Scholar]
- Swaan PW, Hillgren KM, Szoka FC, Jr, Oie S. Enhanced transepithelial transport of peptides by conjugation to cholic acid. Bioconjug Chem. 1997;8:520–525. doi: 10.1021/bc970076t. [DOI] [PubMed] [Google Scholar]
- Thomas C, Pellicciari R, Pruzanski M, Auwerx J, Schoonjans K. Targeting bile-acid signalling for metabolic diseases. Nat Rev Drug Discov. 2008;7:678–693. doi: 10.1038/nrd2619. [DOI] [PubMed] [Google Scholar]
- Trauner M, Graziadei IW. Review article: mechanisms of action and therapeutic applications of ursodeoxycholic acid in chronic liver diseases. Aliment Pharmacol Ther. 1999;13:979–996. doi: 10.1046/j.1365-2036.1999.00596.x. [DOI] [PubMed] [Google Scholar]
- Tserng KY, Hachey DL, Klein PD. An improved procedure for the synthesis of glycine and taurine conjugates of bile acids. J Lipid Res. 1977;18:404–407. [PubMed] [Google Scholar]
- Weinman SA, Carruth MW, Dawson PA. Bile acid uptake via the human apical sodium-bile acid cotransporter is electrogenic. J Biol Chem. 1998;273:34691–34695. doi: 10.1074/jbc.273.52.34691. [DOI] [PubMed] [Google Scholar]
- Zhang EY, Phelps MA, Cheng C, Ekins S, Swaan PW. Modeling of active transport systems. Adv Drug Deliv Rev. 2002;54:329–354. doi: 10.1016/s0169-409x(02)00007-8. [DOI] [PubMed] [Google Scholar]
- Zheng X, Pan Y, Acharya C, Swaan PW, Polli JE. Structural requirements of the ASBT by 3D-QSAR analysis using aminopyridine conjugates of chenodeoxycholic acid. Bioconjug Chem. 2010;21:2038–2048. doi: 10.1021/bc100273w. [DOI] [PMC free article] [PubMed] [Google Scholar]
- Zheng X, Polli JE. Synthesis and in vitro evaluation of potential sustained release prodrugs via targeting ASBT. Int J Pharm. 2010;396:111–118. doi: 10.1016/j.ijpharm.2010.06.039. [DOI] [PMC free article] [PubMed] [Google Scholar]
Associated Data
This section collects any data citations, data availability statements, or supplementary materials included in this article.