Abstract
Previous studies showed that S-Adenosylmethionine (SAMe) prevented MDB formation and the hypomethylation of histones induced by DDC feeding. These results suggest that formation of MDBs is an epigenetic phenomenon. To further test this theory, drug-primed mice were fed the methyl donor, betaine, together with DDC, which was refed for 7 days. Betaine significantly reduced MDB formation, decreased the liver/body weight ratio and decreased the number of FAT10 positive liver cells when they proliferate in response to DDC refeeding. Betaine also significantly prevented the decreased expression of BHMT, AHCY, MAT1a and GNMT and the increased expression of MTHFR, caused by DDC refeeding. S-Adenosylhomocysteine (SAH) levels were reduced by DDC refeeding and this was prevented by betaine. The results support the concept that betaine donates methyl groups, increasing methionine available in the cell. SAMe metabolism was reduced by the decrease in GNMT expression, which prevented the conversion of SAMe to SAH. As a consequence, betaine prevented MDB formation and FAT10 positive cell proliferation by blocking the epigenetic memory expressed by hepatocytes. The results further support the concept that MDB formation is the result of an epigenetic phenomenon, where a change in methionine metabolism causes global gene expression changes in hepatocytes.
INTRODUCTION
Mallory-Denk body (MDB) formation is induced by refeeding diethyl 1-1, 4-dehydro-2,4,6-trimethyl-1,5-pyridine carboxylate (DDC) to drug-primed mice. The MDBs mostly disappear after 1 month of DDC withdrawal (DDC primed hepatocytes). MDB induction by DDC refeeding is prevented by feeding SAMe, a methyl donor (Li et al., 2008). SAMe feeding prevents the switch of SAMe metabolism from the methylating pathway to the decarboxylating methylthioadenosine (MTA) pathway caused by DDC refeeding (Bardag-Gorce et al., 2008b). DDC refeeding causes demethylation of histones. This is prevented by feeding SAMe (Table 1) (Bardag-Gorce et al., 2008b).
Table 1.
SAMe REVERSED DDC INDUCED EPIGENETIC CHANGES
| Histone Modification | Residue | DDC Refed | DDC refed + SAMe |
|---|---|---|---|
|
| |||
| Acetylation | Histone 3 lysine 9 (AcH3K9) | ↑ | ↑ |
|
| |||
| Histone 3 lysine 18 (AcH3K18) | ↓ | ↓ | |
|
| |||
| Trimethylation | Histone 3 lysine 4 (H3K4me3) | ↓ | nl |
|
| |||
| Histone 3 lysine 9 (H3K9me3) | ↓ | nl | |
|
| |||
| Ubiquitinylation | H2A / H2B | ↑ | nl |
|
| |||
| Histone Modifying Enzyme | Enzyme | DDC Refed | DDC refed + SAMe |
|
| |||
| Histone Acetyl Transferase | GCN5 | ↑ | nl |
|
| |||
| Pcaf | ↓ | ||
|
| |||
| Cbp/p300 | ↓ | ||
|
| |||
| Histone Deacetylase | Sirtuin 1 | ↓ | ↓ |
|
| |||
| HDAC9 | ↑ | ↓ | |
|
| |||
| HDAC7a | ↑ | nl | |
|
| |||
| HDAC11 | ↓ | ||
|
| |||
| Histone Methyltransferase | SET 7/9 | ↑ | nl |
|
| |||
| SUV 39H1 | ↓ | nl | |
|
| |||
| Histone Demethylase | LSD1 | nl | nl |
Altered methionine metabolism can contribute to the development of alcoholic liver disease (ALD) and hepatocellular carcinoma (HCC). Both ALD and HCC are major health care problems worldwide (James et al., 2003; Mato et al., 2008). Biosynthesis of S-adenosylmethionine (SAMe) occurs in all mammalian cells as the first step in methionine catabolism in a reaction catalyzed by methionine adenosyltransferase (MAT). The deregulation of SAMe metabolism is linked to liver diseases (Mato et al., 2008). Two genes, MAT1A and MAT2A, encode for the essential enzyme methionine adenosyltransferase (MAT) (Kotb et al., 1997), which catalyzes the biosynthesis of SAMe, the principal methyl donor, from methionine. MAT2A is expressed in various organs, while MAT1A is mostly expressed in the liver (Torre et al., 2000). A change in the ratio of the expression of MAT1A and MAT2A expression occurs in many liver diseases (Lu and Mato, 2005; Martinez-Chantar et al., 2003). In human HCC, MAT1A is replaced by MAT2A (Yang et al., 2001). The decreased ratio of MAT1A/MAT2A leads to a decrease of SAMe in liver tissue (Lu and Mato, 2008). SAMe plays a key role in the methylation of many molecules in the cell: DNA, RNA, biogenic amines, phospholipids and histones (Purohit et al., 2007).
The deregulation of other enzymes involved in methionine metabolism, are involved in liver disease. Methylenetetrahydrofolate reductase (MTHFR) is known to play a role in DNA methylation, synthesis, and repair. Mutations in MTHFR are associated with an increase of HCC (Mu et al., 2007). Glycine N-methyltransferase (GNMT) is the main enzyme responsible for catabolism of hepatic S-adenosylmethionine (SAMe). Point mutations in the GNMT gene, identified in humans, are correlated with liver disease (Luka et al., 2002). GNMT deletion in mice leads to steatosis and hepatocellular carcinoma (Martinez-Chantar et al., 2008). The expression of GNMT is down regulated in human cell lines (Chen et al., 1998) and human HCC (Avila et al., 2000).
Betaine, another methyl donor, might also prevent MDB formation since it increases methionine formation from homocysteine via betaine-homocysteine methyltransferase (BHMT) (Purohit et al., 2007). Betaine functions by removing homocysteine and S-adenosylhomocysteine (SAH) from the liver (Purohit et al., 2007). SAH and the SAMe/SAH ratio levels regulate transmethylation reactions, where an increase in SAH inhibits transmethylation of histones (H3K9 me3 and H3K4 me3). These were reduced when MDBs were induced by refeeding DDC (Bardag-Gorce et al., 2008b). The reduction in the trimethylation of H3K4 and K9 gives rise to global changes in gene expression and a change in epigenetic memory (Jenuwein, 2006).
Why are we testing betaine? Betaine is less expensive and much more stable when ingested (Najm et al., 2004; Schwahn et al., 2003). The hypothesis tested here is that betaine will, like SAMe, prevent MDB formation through epigenetic alterations caused by changes in methionine metabolism.
Materials and Methods
Animals
One-month-old C3H male mice (Harlan Sprague-Dawley, San Diego, CA) were fed DDC (0.1% diethyl-1, 4-dihydro-2,4,6-trimethyl-3,5-pyridinedicarboxylate (Aldrich, St Louis, MD) for 10 weeks to induce MDB formation in vivo. The mice were then withdrawn from the drug for 1 month (n-4) and refed DDC with or without betaine (2% in the drinking water) for 7 days. The control mice n=4 were fed control diet (Yuan et al., 1996). Mice fed DDC for 10 weeks and then withdrawn from DDC for 1 month (n=4) served as withdrawn controls. All mice were treated in a humane manner as approved by the Animal Care Committee at Harbor-UCLA Laboratory BioMedical Research Institute according to the Guidelines of the National Academy of Science.
Immunohistochemistry
Liver tissue was fixed in 10% buffered zinc formalin. Liver sections were double stained using a mouse monoclonal antibody to CK-8 (Fitzgerald, RDI, Concord, MA) and a rabbit polyclonal antibody to ubiquitin (Dako, Carpinteria, CA) (Table I). Double staining with antibodies to FAT10 (UBD) and PCNA was also done. Quantitation of MDB positive cells, FAT10 positive cells and PCNA positive nuclei were performed using a Nikon morphometric system and a Nikon 400 fluorescent microscope. Texas-red and FITC-conjugated second antibodies were used. DAPI was the nuclear stain.
Nuclei Isolation
The isolation of nuclei was carried out according to the method of Umlauf et al. (Umlauf et al., 2004). Liver tissue, frozen in isopentane immersed in liquid nitrogen was homogenized in a Dounce homogenizer with 10 strokes in 1 ml of buffer-I. The homogenates were centrifuged for 10 min at 6000×g. The Pellets were then resuspended in buffer-II, placed on ice for 10 min and then centrifuged 20 min at 9000g on a sucrose cushion (buffer III). All buffers used contained protease inhibitors: 10 mM benzamidine, 0.7 μg/ml leupeptin, 50 μg/ml soy bean trypsin inhibitor, 0.2 μg/ml aprotinin, 2 μg/ml antipain, 0.7 μg/ml pepstatin, 0.5 mM PMSF, and 0.5 mM AEBSF (Calbiochem, La Jolla, CA), sodium butyrate 5 mM and DTT 1 mM. Protein concentrations were measured using the Bradford method (Bradford, 1976), and bovine serum albumin was the protein standard.
Histone Isolation
The protocol for Histone isolation was done using the protocol of Shechter et al. (Shechter et al., 2007). Briefly, isolated nuclei were mixed with 0.4 N H2SO4 and incubated on a rotator for 30 min. at 4°C. Samples were spun in a microcentrifuge at 16,000 g, 10 min. Dissolved histones in the supernatant were then precipitated with 33% TCA. After an acetone wash the histones were dissolved in an appropriate buffer and further analyzed.
Western Blot Analysis
Proteins (50 μg) from liquid nitrogen frozen stored livers and nuclear and histone extracts were separated by SDS-PAGE gels and transferred to a PVDF membrane (Bio-Rad, Hercules, CA) for 1 h in 25 mM Tris-HCl (pH 8.3), 192 mM glycine and 20% methanol. The membranes were stained using primary antibodies to antigens (Table 1). Appropriate species polyclonal and monoclonal HRP-conjugated antibodies were used as the secondary antibodies. The membranes were subjected to chemiluminescence detection using luminal, according to the manufacturer’s instructions (Amersham Pharmacia Biotech, Piscataway, NJ). The antibodies used were: Ubiquitin, PCNA (DAKO, Carpinteria, CA), BHMT, AMD1 (Abcam, Cambridge, MA), FAT10 (BioMol, Plymouth, PA), Cytokeratin 8 (RDI, Concord, MA), AHCY (ABR, Golden, CO).
Quantitative Real-time RT-PCR Assay
Total liver RNAs were extracted with Trizol Plus RNA Purification Kit (Invitrogen, Carlsbad, CA) as described previously (Li et al., 2008). The sequences of PCR primers are:
| FAT10 | NM_023137 | Forward | GATTGACAAGGAAACCACTATCCA |
| Reverse | ACAAGGGCAGCTCTTCATCAC | ||
| GNMT | NM_010321 | Forward | TGCTGAAATATGCGCTTAAGGA, |
| Reverse | TTGGCTTCTTCAATGACCCAAT | ||
| MAT1A | NM_133653 | Forward | AGGAGATCAGGGTCTGATGTTTG |
| Reverse | GAGCGAGCACGATGGTAAGG | ||
| MAT2A | NM_145569 | Forward | GTGGGCCTCAGGGTGATG |
| Reverse | TCCCCAACCGCCATAAGTATC | ||
| AHCY | NM_016661 | Forward | GAAGGGTGCTCGCATTGCT |
| Reverse | GCCACGAGAGTCTCAATGAGAA | ||
| MTHFR | NM_010840 | Forward | CATCCGGACCGAGTTTGCT |
| Reverse | CGGCGCCTGCAGATACC |
Microarray analysis
Liver tissue from three mouse of each of the 4 treatment groups was subjected to microarray analysis. Total liver RNA is extracted with Ultraspec™ RNAs Isolation Systemic (Biotecz Laboratories, Houston, TX) and are cleaned up with Rneasy columns (Qiagen, Valencia, CA). Five micrograms of total RNA was used for preparing biotin-labeled cRNA. Labeled and fragmented cRNA is subsequently hybridized to Mouse Genome 430 2.0 Array (Affymetrix, Santa Clara, CA). Labeling, hybridization, image scanning and initial data analysis are performed by the Microarray Core at Los Angeles Biomedical Research Institute.
Sample preparation and loading
Equal amounts of RNA (5 μg) from each sample were used for Affymetrix GeneChip analysis. RNA was converted to cDNA using GeneChip® One-Cycle cDNA Synthesis Kit (Affymetrix) and then to biotinylated cRNA using GeneChip® IVT Labeling Kit (Affymetrix). The quality of labeled RNA was confirmed with the Affymetrix Test 3 Array. The biotinylated cRNA from all samples was hybridized to Affymetrix Mouse 430 2.0 GeneChip arrays.
Hybridization and staining
Hybridization cocktail was prepared, which includes controls at the fragmented cRNA. The samples were hybridized in the array at 45°C for 17 h using GeneChip Hybridization Oven 640. Immediately following hybridization, the array underwent an automated washing and staining protocol (R-Phycoerythin Streptavidin conjugated, Molecular Probes) on the GeneChip Fluidics Station 400. The arrays were then scanned with a GeneChip Scanner 3000 (Affymetrix).
Microarray data analysis
Data preparation, analysis, and integration were performed using Affymetrix’s GeneChip Operating Software (GCOS). The software was used to perform image processing, evaluation of data quality, normalization, transformation, and filtering, so that data was ready for further analysis. Wilcoxon’s rank test was used in comparison analysis to derive biologically significant results from the raw probe cell intensities on expression arrays. For comparison analysis, each probe set on the experiment array was compared with its counterpart on the control array to calculate the change in P- value that was used to generate the difference call of increase (I; P < 0.04), marginal increase (MI; P < 0.04 to P < 0.06), decrease (D; P> 0.997), marginal decrease (MD; P> 0.992 to P > 0.997), or no change (NC: P > 0.06 to P < 0.997). Comparison analysis was used to generate a signal log ratio for each probe prior to experimental array to the corresponding probe pair on the control array. This strategy cancels out differences resulting from different probe finding coefficients. Signal log ratio was computed by using a one-step Tukey’s biweight method by taking a mean of the log ratio of probe pair intensities across the two arrays.
Once the absolute and comparison data files were created in GCOS, genes were identified with signal intensity differences using BULLFROG v12.3 TG (Lockhart and Lockhart) and GeneSpring (Silicon Genetics). In the BULLFROG analysis, the filtering criteria used to find genes unique to DDC 7 days was the following: a change call of increase/marginal increase or decrease/marginal decrease, fold change > 1.7 and a present call in at least one of the arrays. In GeneSpring the probes were first normalized using “Per Gene: Normalize to median”. Next, transcripts were determined to be differentially expressed based on the following criteria: a Change Call of Increase, Marginal Increase, Decrease, or Marginal Decrease with a Change P value < 0.006 or > 0.994, a Signal Log Ratio < -0.08 or > 0.8, a Present Call for the probe set in either or both experimental conditions, and a minimum signal intensity of 50 of a probe in either or both of the experimental files.
After generating a list of differentially expressed genes, downstream analysis was performed. The filtered transcripts were clustered in GeneSpring using SOM and K-means and GeneTree to find similar patterns of gene expression. The lists of transcripts were also uploaded into GenMapp (Gene Micro Array Pathway Profiler, Gladstone Institutes University of California at San Francisco). GenMapp clusters the transcripts based on biological function.
The data illustrated were obtained by using the KEGG web site (http://www.genome.jp/kegg/pathway.htm1) and blasting the list of total changed genes issued from our experiment for analysis. The website calculates the number of up-regulated and down-regulated genes for each pathway shown in the KEGG graph. To determine the present gene change in each pathway, the number of changed genes present in each pathway was divided by the total number of genes in the same pathway.
The same calculation was performed in the ABI panther (http://www.pantherdb.org/genes) website to illustrate the pie chart. To determine the percent gene change in each pathway, the number of genes present in each pathway was divided by the total number of changed genes.
HPLC
SAH, SAMe and MTA levels were measured as described (Huang et al., 1998; Huang et al., 1999) with slight modification. Liver specimens were homogenized in 0.5M perchloric acid and centrifuged at 1,000g (Beckman GPR centrifuge) for 15 minutes. The aqueous layer was quantitatively removed and neutralized with 3M KOH. SAH levels were determined in the neutralized perchloric acid extracts by high-performance liquid chromatography (Series 410 LC pump, Perkin Elmer, Waltham, MA) with a LC-90 UV detector and a LC-100 integrator (Perkin Elmer, Waltham, MA) using a Partisil SCX 10-μm column (25 30.44-cm inner diameter; Whatman Chem. Sep. Maidstone). SAH, SAMe and MTA were eluted isocratically at 1 ml/mn with 0.03 M NH4H2PO4 containing 2% acetonitrile (vol/vol) and adjusted to pH 2.6 with 2 M H3PO4. SAH was identified by measuring absorbance at 254 nm at a sensitivity scale of 0.01. The amount of SAH, SAMe and MTA in each sample was calculated from standard curves. The identity of SAH peaks was also confirmed by spiking the sample with known standards. Their levels were reported as μM/100 mg net weight liver.
Statistical analysis
P values were determined by ANOVA and Student-Newman-Keuls for multiple group comparisons (Sigma-Stat software, San Francisco, CA).
RESULTS
The Heatmap comparing mice refed DDC with mice refed DDC (3 mice/group), plus betaine, showed that betaine prevented many of the changes in gene expression induced by DDC refeeding. The expression of genes is almost restored to control levels after 1 month of withdrawal (Fig1A). This change was reflected by changes in expression, which were compared by the kegg functional pathway analysis (Fig1B). The liver/body weight ratio increased after DDC refeeding (Fig2) (p<0.001) and betaine feeding reduced this increase (p<0.001). The ratio was also increased in the DDC withdrawal group when compared to the controls (p<0.025). The DDC+betaine group had a higher ratio than the DDC withdrawal group (p<0.021). Although betaine reduced the increased ratio of liver/body weight compared with the DDC refed group, it didn’t reduce the increase to the level of the DDC withdrawal group baseline.
Fig 1.
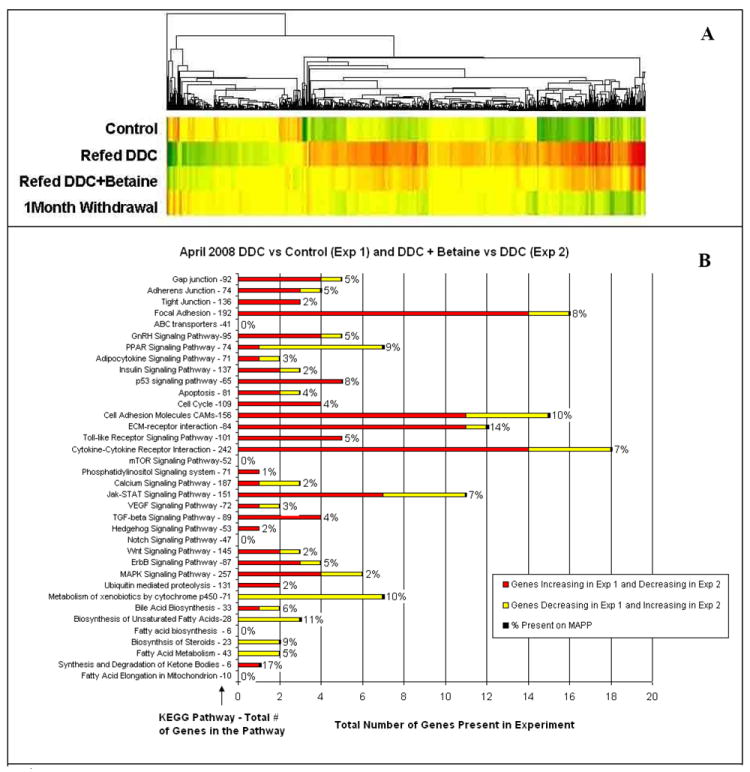
A) Heatmap showing changes in gene expression when DDC is refed to drug-primed mice (5050 genes were identified). The microarrays datas are an average of three mice B) Functional pathways showed that the expression of 3364 genes changed when the DDC refed mice were compared with DDC refed + betaine fed mouse, using KEGG software.
Fig 2.
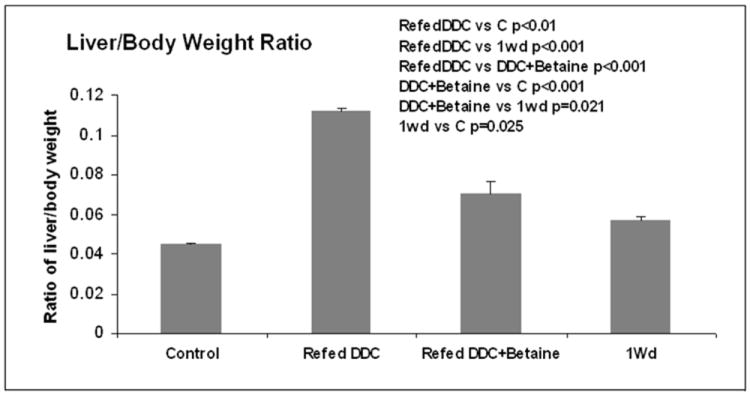
Liver/body weight ratios of the 4 treatment groups of mice. (Mean±SEM, n=4). All groups are significantly different from each other (p<0.05).
Betaine treatment reduced the numbers of MDBs formed when fed to the DDC refed group (Fig 3). Betaine reduced the number of MDBs to the level of the DDC withdrawal group. PCNA positive nuclei were counted in the 4 groups (Fig 4). Refeeding DDC increased the number of PCNA positive nuclei compared with controls (p<0.001), and the DDC withdrawal group (p<0.001). The DDC refed plus betaine group did not differ significantly from the two controls. It was concluded that betaine prevented the increase in liver cell proliferation induced by DDC refeeding. Refeeding DDC increased the number of FAT10 positive cells and betaine reduced the number of FAT10 positive cell levels to control levels (Fig 5). However, after 1 month withdrawal, FAT10 cells were still increased in the liver tissue from drug-primed mice.
Fig 3.
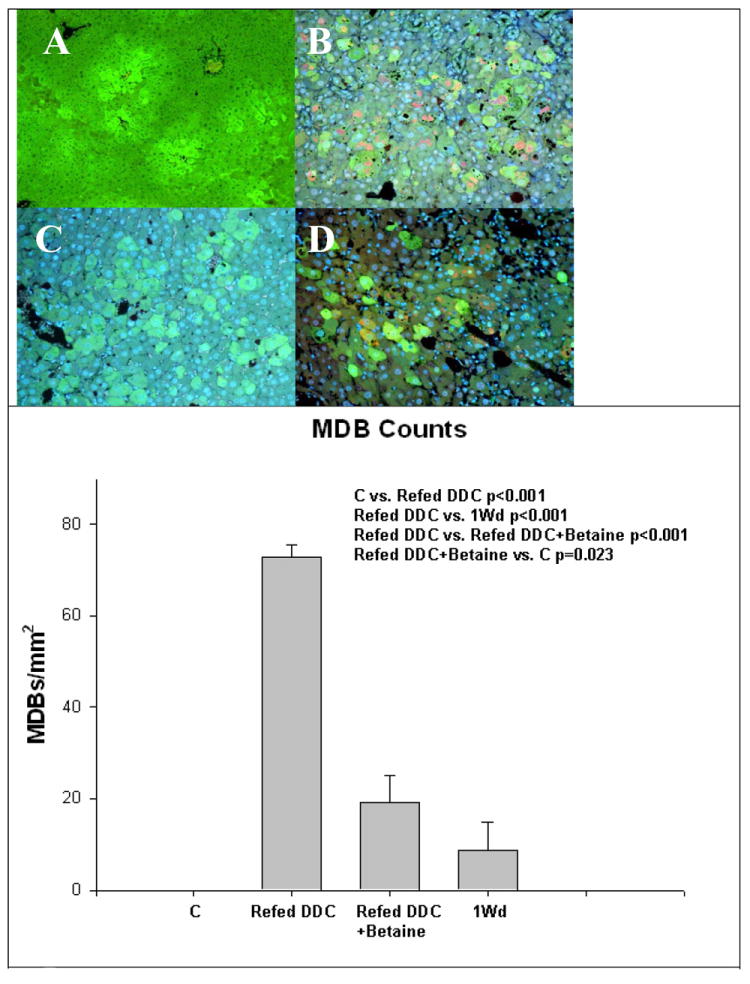
A) Control, B) DDC refed, C) DDC refed + betaine, D) 1 month withdrawal (1MW). Refeeding DDC induced the formation of MDBs in hepatocytes (B). Betaine partially prevented the formation of MDBs (C). MDBs were stained yellow-red (B and D). The control shown (A) had no MDBs. MDBs were inconspicuous in the betaine treated livers (C). (Mean±SEM, n=4)
Fig 4.
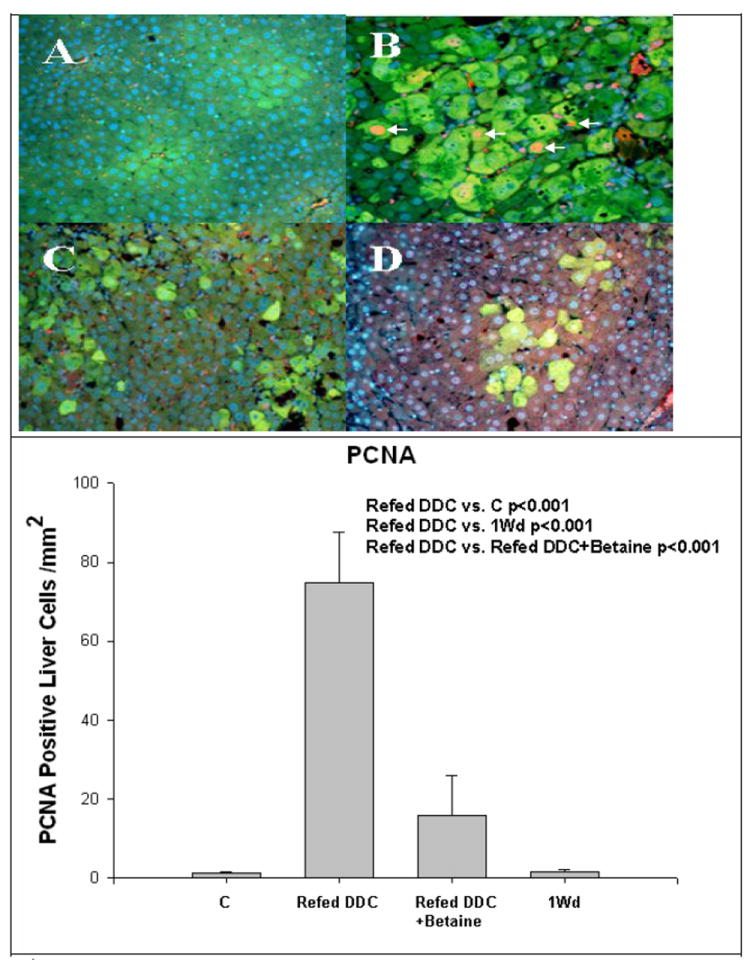
A) Control, B) Refed DDC, C) Refed DDC+betaine, D) 1 month withdrawal. Refeeding DDC induced the expression of PCNA (Arrows) (B), and this was partially prevented by betaine. (Mean±SEM, n=4) FAT10 is green, PCNA is red-yellow. PCNA-FAT10 double stain x260.
Fig 5.
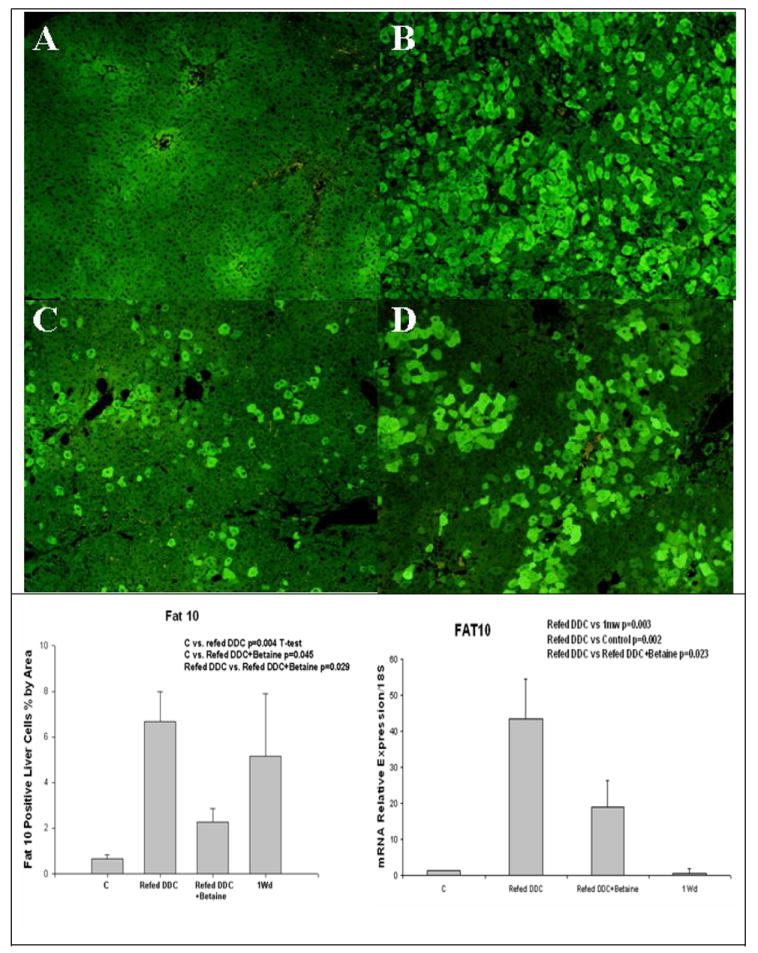
A) Control, B) Refed DDC, C) Refed DDC+betaine, D) 1 month withdrawn. Refeeding DDC induces the expression of FAT10, prevented by betaine. Real-Time PCR on FAT10. Real-Time PCR confirms results obtained by immunohistochemistry, except for 1 month withdrawal. FAT10 stain x130. (Mean±SEM, n=4)
Real-Time PCR confirms these results, except for 1 month withdrawal where the FAT10 mRNA expression recovered to control levels (Fig 5). The expression of MAT1A tended to decrease, as the result of DDC refeeding. Betaine treatment prevented this (Fig 6). MAT2A expression was not increased in DCC refed mice or changed by betaine (Fig 6). However, GNMT expression was reduced by DDC refeeding and this was prevented by betaine treatment (Fig 6). After 1 month withdrawal, GNMT expression didn’t return to the control levels of expression. Same results were observed with AHCY (Fig6). The expression of MTHFR was increased by DDC refeeding and betaine treatment partially prevented this induction (Fig 6). There remained a significant difference between the betaine treated groups, the control groups and the 1 month withdrawal group.
Fig 6.
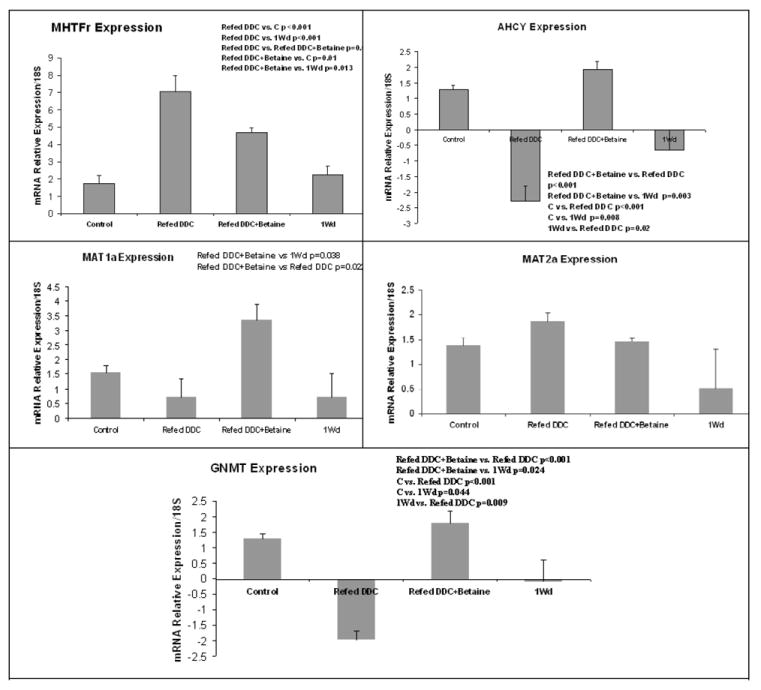
The expression of enzymes involved in SAMe metabolism are quantified by Real-time PCR. The expressions are relative to the controls values. The expression of MAT1A decreased in mice refed DDC compared to the DDC one month withdrawal mice. Betaine treatment restored MAT1A expression compared to the DDC refed group (Mean±SEM, n=4).
In parallel, the BHMT expression was analyzed by Western blot. The level of BHMT and AHCY proteins were down regulated by DDC and this change was prevented by betaine. After 1 month withdrawal, the expression of the two proteins recovered to the control level of expression. DDC decreased the expression of adenosylmethionine decarboxylase (AMD1) and the expression of GNMT, and this was partially prevented by betaine feeding. AMD1 and GNMT expression was similar when control and 1 month withdrawal groups were compared (Fig 7). This was also true for AHCY and BHMT. The reduction of GNMT expression induced by refeeding DDC lead to a decrease of SAH levels in the liver tissue, which was prevented by betaine feeding (Fig 8). SAMe and MTA levels were not changed by the treatments.
Fig 7.
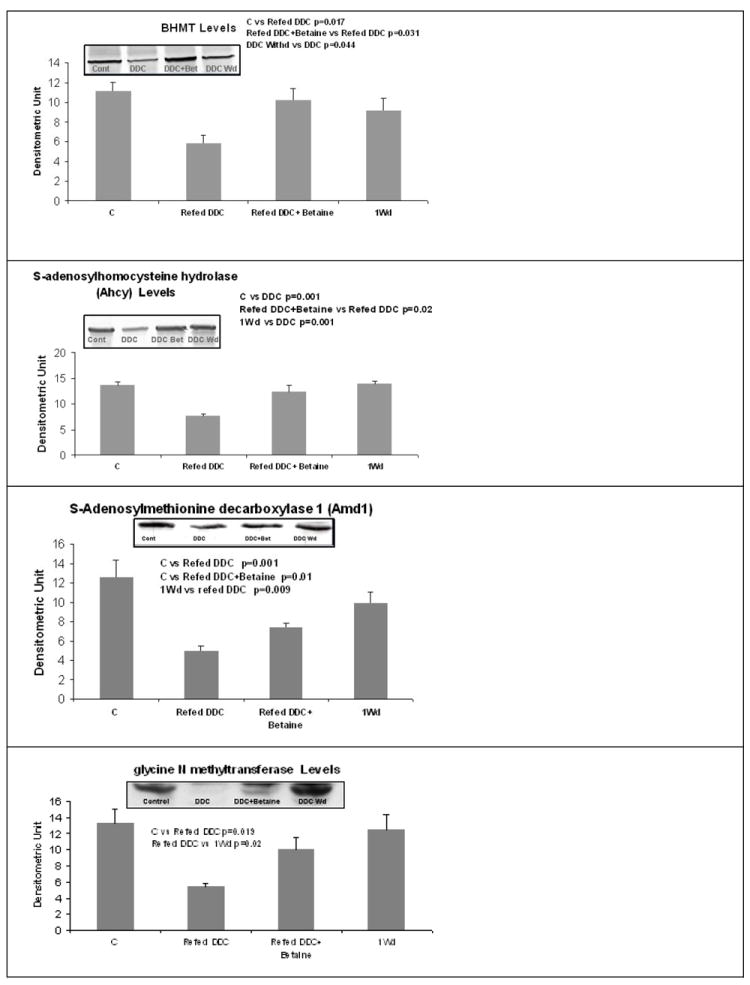
Expression of BHMT was decreased by DDC refeeding as determined by Western blot. This was prevented by betaine. The same results were found for AHCY, AMD1 and GNMT. (Mean±SEM, n=4)
Fig 8.
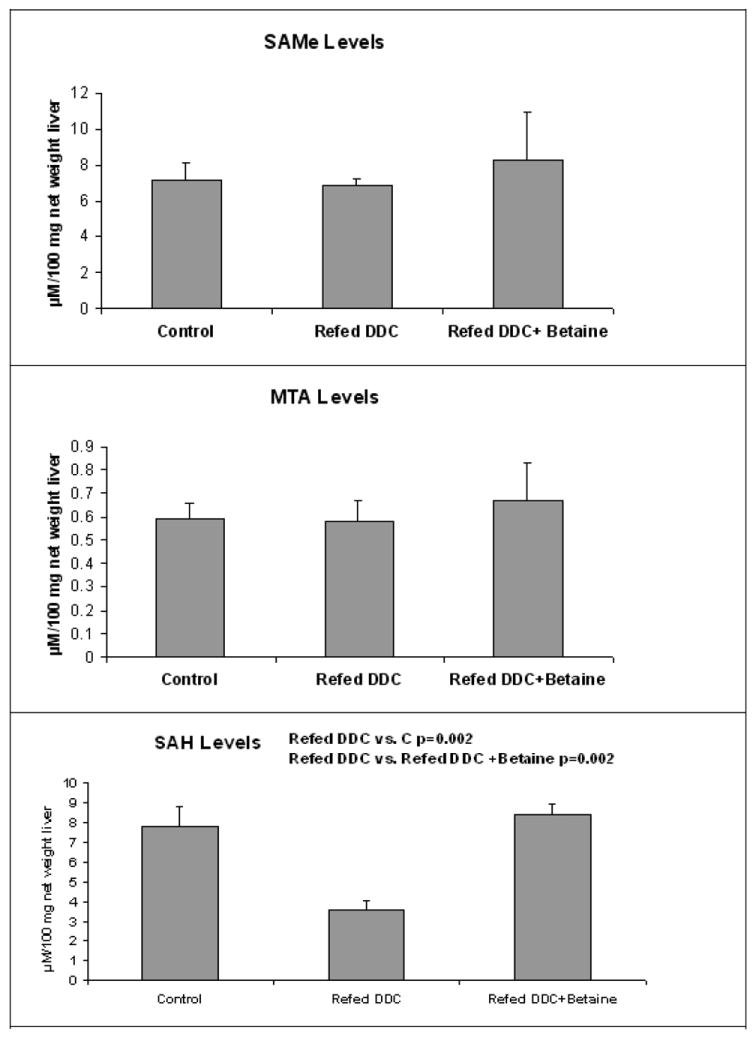
SAMe and MTA levels were not changed by DDC refeeding. DDC refeeding decreased SAH levels and this was prevented by feeding betaine. SAH levels by HPLC. (Mean±SEM, n=3-4)
DISCUSSION
Betaine, as a methyl donor, reduced the increase in liver/body weight ratio, MDB formation, FAT10 expression and the mitotic index (PCNA positive nuclei) caused by DDC refeeding. Betaine attenuated the decrease of MAT1A, AHCY, BHMT and AMD1 expression, and prevented the increase of MTHFR expression, caused by refeeding DDC for 7 days (Fig 9). The results are similar to those observed after feeding SAMe (Bardag-Gorce et al., 2008b; Li et al., 2008; Oliva et al., 2008). GNMT expression was also reduced by DDC refeeding and this was prevented by betaine (Fig 6 and 7). A reduction in GNMT could explain how DDC refeeding reduced the levels of SAH. The increased expression of MTHFR caused by DDC refeeding could further inhibit GNMT activity (Purohit et al., 2007).
Fig 9.
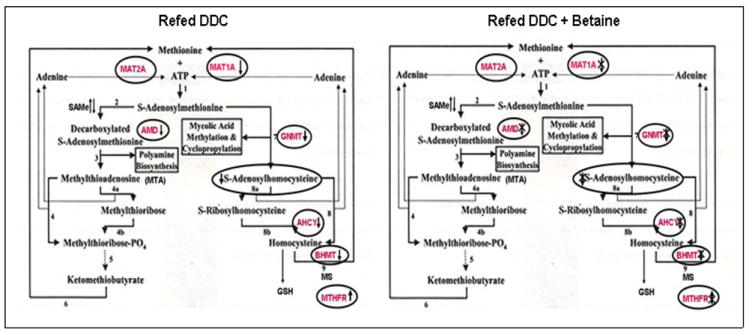
DDC Refeeding decreased AMD, AHCY GNMT and MAT1A expression, and increased the expression of MTHFR. Betaine treatment prevented these changes. The arrows indicate the increase or decrease of the gene expression. The double cross indicated betaine treatment prevents the DDC effect. (Diagram modified from Berger et al. BMC Microbiology 2003 3:12)
Not previously observed was the decrease in the expression of BHMT in mice refed DDC and this change was prevented by betaine. The reduction in levels of BHMT could have impeded the maintenance of methionine and SAMe levels when DDC was refed and could contribute to the reduced methylation of the histones 3 lysine 4 and 9 (Bardag-Gorce et al., 2008b). However, the decrease of the GNMT expression should induce an increase of SAMe levels but it didn’t happen. The SAMe level was stable, as was the MTA level. The decrease of AMD1 expression should increase the SAMe levels in the cells. However, AMD2 could balance the down expression of AMD1 to maintain MTA and SAMe.
The liver phenotype changed after DDC refeeding (liver weight, MDB formation, FAT10 expression) where the DDC primed liver cells retained the memory of the epigenetic modifications induced by DDC, after drug withdrawal (Oliva et al., 2008). SAMe deficiency increases the susceptibility of the liver to steatosis, oxidative damage, and spontaneous development of HCC (Lu and Mato, 2008). The increase of PCNA in FAT10 positive cells suggests that the phenotype changed liver cells have a growth advantage over the unchanged liver cells, which did not express FAT10. Although SAMe level were stable in the liver, SAMe could be decreased in individual cells which were over expressing FAT10 and MDBs. These cells showed a high frequency of PCNA expression and could indicate that they have an increased in growth advantage. Betaine prevents FAT10 over expression and MDBs formation similar to SAMe treatment (Li et al., 2008; Oliva et al., 2008). These results also correlated with the inhibitor effects of SAMe on the growth factor pathway and the decrease in SAMe observed in regenerating liver tissue (Lu and Mato, 2008).
DDC induced the formation of MDBs and hypomethylation of DNA in the MDB forming FAT10 positive cells (Oliva et al., 2008). Hypomethylation of DNA is a common tumor marker (Vucic et al., 2008). Many studies have shown that a methyl-deficient diet causes hypomethylation of DNA (Ghoshal et al., 2006; James et al., 2003). Previously reported studies on DDC refed mice showed an increase in the expression of tumor markers such as AFP, GSTmu2 and FAT10 (Nan et al., 2006; Oliva et al., 2008). The combination of the epigenetic modifications observed, such as hypomethylation of the DNA and the over expression of PCNA and FAT10, favors tumorgenesis in the DDC fed model studied here (Bardag-Gorce et al., 2008b; Lee et al., 2003; Oliva et al., 2008; Roomi et al., 2006). After 9 months of withdrawal from DDC, the liver cell population that forms MDBs in response to DDC toxicity develops liver tumors (Nan et al., 2006). The question remains: Can betaine treatment prevent the formation of tumors in DDC-primed mice studied here?
Acknowledgments
The authors thank Adriana Flores for typing the manuscript. S.W French is supported by NIH/NIAAA grants 8116 and P50-O999 Alcohol Center grant on liver and pancreas including the Morphology Core. S.Lu is supported by NIH grants DK51719 and AT1576. The results of this study have been reported in an abstract at ASSLD 2008 San Francisco (Bardag-Gorce et al., 2008a).
Glossary
- MDB
Mallory-Denk bodies
- SAMe
S-Adenosylmethionine
- SAH
S-adenosylhomocysteine
- MAT1a and 2a
Methionine adenosyl-transferase 1a and 2a
- MTHFR
Methylenetetrahydrofolate reductase
- GNMT
glycine N methyltransferase
- AHCY
S-adenosyl homocysteine hydrolase
- BHMT
Betaine homocysteine methyltransferase
Footnotes
Publisher's Disclaimer: This is a PDF file of an unedited manuscript that has been accepted for publication. As a service to our customers we are providing this early version of the manuscript. The manuscript will undergo copyediting, typesetting, and review of the resulting proof before it is published in its final citable form. Please note that during the production process errors may be discovered which could affect the content, and all legal disclaimers that apply to the journal pertain.
References
- Avila MA, et al. Reduced mRNA abundance of the main enzymes involved in methionine metabolism in human liver cirrhosis and hepatocellular carcinoma. J Hepatol. 2000;33:907–14. doi: 10.1016/s0168-8278(00)80122-1. [DOI] [PubMed] [Google Scholar]
- Bardag-Gorce F, et al. Betaine prevents Mallory-Denk body formation in drug-primed mice ASSLD. 2008a doi: 10.1016/j.yexmp.2008.11.002. [DOI] [PMC free article] [PubMed] [Google Scholar]
- Bardag-Gorce F, et al. Epigenetic mechanisms regulate Mallory Denk body formation in the livers of drug-primed mice. Exp Mol Pathol. 2008b;84:113–21. doi: 10.1016/j.yexmp.2007.12.004. [DOI] [PMC free article] [PubMed] [Google Scholar]
- Bradford MM. A rapid and sensitive method for the quantitation of microgram quantities of protein utilizing the principle of protein-dye binding. Anal Biochem. 1976;72:248–54. doi: 10.1016/0003-2697(76)90527-3. [DOI] [PubMed] [Google Scholar]
- Chen YM, et al. Characterization of glycine-N-methyltransferase-gene expression in human hepatocellular carcinoma. Int J Cancer. 1998;75:787–93. doi: 10.1002/(sici)1097-0215(19980302)75:5<787::aid-ijc20>3.0.co;2-2. [DOI] [PubMed] [Google Scholar]
- Ghoshal K, et al. A folate- and methyl-deficient diet alters the expression of DNA methyltransferases and methyl CpG binding proteins involved in epigenetic gene silencing in livers of F344 rats. J Nutr. 2006;136:1522–7. doi: 10.1093/jn/136.6.1522. [DOI] [PMC free article] [PubMed] [Google Scholar]
- Huang ZZ, et al. Changes in methionine adenosyltransferase during liver regeneration in the rat. Am J Physiol. 1998;275:G14–21. doi: 10.1152/ajpgi.1998.275.1.G14. [DOI] [PubMed] [Google Scholar]
- Huang ZZ, et al. Differential effect of thioacetamide on hepatic methionine adenosyltransferase expression in the rat. Hepatology. 1999;29:1471–8. doi: 10.1002/hep.510290525. [DOI] [PubMed] [Google Scholar]
- James SJ, et al. Mechanisms of DNA damage, DNA hypomethylation, and tumor progression in the folate/methyl-deficient rat model of hepatocarcinogenesis. J Nutr. 2003;133:3740S–3747S. doi: 10.1093/jn/133.11.3740S. [DOI] [PubMed] [Google Scholar]
- Jenuwein T. The epigenetic magic of histone lysine methylation. FEBS J. 2006;273:3121–35. doi: 10.1111/j.1742-4658.2006.05343.x. [DOI] [PubMed] [Google Scholar]
- Kotb M, et al. Consensus nomenclature for the mammalian methionine adenosyltransferase genes and gene products. Trends Genet. 1997;13:51–2. doi: 10.1016/s0168-9525(97)01013-5. [DOI] [PubMed] [Google Scholar]
- Lee CG, et al. Expression of the FAT10 gene is highly upregulated in hepatocellular carcinoma and other gastrointestinal and gynecological cancers. Oncogene. 2003;22:2592–603. doi: 10.1038/sj.onc.1206337. [DOI] [PubMed] [Google Scholar]
- Li J, et al. S-adenosylmethionine prevents Mallory Denk body formation in drug-primed mice by inhibiting the epigenetic memory. Hepatology. 2008;47:613–24. doi: 10.1002/hep.22029. [DOI] [PMC free article] [PubMed] [Google Scholar]
- Lu SC, Mato JM. Role of methionine adenosyltransferase and S-adenosylmethionine in alcohol-associated liver cancer. Alcohol. 2005;35:227–34. doi: 10.1016/j.alcohol.2005.03.011. [DOI] [PubMed] [Google Scholar]
- Lu SC, Mato JM. S-Adenosylmethionine in cell growth, apoptosis and liver cancer. J Gastroenterol Hepatol. 2008;23(Suppl 1):S73–7. doi: 10.1111/j.1440-1746.2007.05289.x. [DOI] [PMC free article] [PubMed] [Google Scholar]
- Luka Z, et al. Mutations in human glycine N-methyltransferase give insights into its role in methionine metabolism. Hum Genet. 2002;110:68–74. doi: 10.1007/s00439-001-0648-4. [DOI] [PubMed] [Google Scholar]
- Martinez-Chantar ML, et al. Methionine adenosyltransferase II beta subunit gene expression provides a proliferative advantage in human hepatoma. Gastroenterology. 2003;124:940–8. doi: 10.1053/gast.2003.50151. [DOI] [PubMed] [Google Scholar]
- Martinez-Chantar ML, et al. Loss of the glycine N-methyltransferase gene leads to steatosis and hepatocellular carcinoma in mice. Hepatology. 2008;47:1191–9. doi: 10.1002/hep.22159. [DOI] [PMC free article] [PubMed] [Google Scholar]
- Mato JM, et al. Methionine Metabolism and Liver Disease. Annu Rev Nutr. 2008 doi: 10.1146/annurev.nutr.28.061807.155438. [DOI] [PubMed] [Google Scholar]
- Mu LN, et al. Methylenetetrahydrofolate reductase (MTHFR) C677T and A1298C polymorphisms and the risk of primary hepatocellular carcinoma (HCC) in a Chinese population. Cancer Causes Control. 2007;18:665–75. doi: 10.1007/s10552-007-9012-x. [DOI] [PMC free article] [PubMed] [Google Scholar]
- Najm WI, et al. S-adenosyl methionine (SAMe) versus celecoxib for the treatment of osteoarthritis symptoms: a double-blind cross-over trial. BMC Musculoskelet Disord. 2004;5:6. doi: 10.1186/1471-2474-5-6. ISRCTN36233495. [DOI] [PMC free article] [PubMed] [Google Scholar]
- Nan L, et al. Mallory body forming cells express the preneoplastic hepatocyte phenotype. Exp Mol Pathol. 2006;80:109–18. doi: 10.1016/j.yexmp.2005.11.001. [DOI] [PubMed] [Google Scholar]
- Oliva J, et al. Fat10 is an epigenetic marker for liver preneoplasia in a drug-primed mouse model of tumorigenesis. Exp Mol Pathol. 2008;84:102–12. doi: 10.1016/j.yexmp.2007.12.003. [DOI] [PMC free article] [PubMed] [Google Scholar]
- Purohit V, et al. Role of S-adenosylmethionine, folate, and betaine in the treatment of alcoholic liver disease: summary of a symposium. Am J Clin Nutr. 2007;86:14–24. doi: 10.1093/ajcn/86.1.14. [DOI] [PubMed] [Google Scholar]
- Roomi MW, et al. Preneoplastic liver cell foci expansion induced by thioacetamide toxicity in drug-primed mice. Exp Mol Pathol. 2006;81:8–14. doi: 10.1016/j.yexmp.2006.02.006. [DOI] [PubMed] [Google Scholar]
- Schwahn BC, et al. Pharmacokinetics of oral betaine in healthy subjects and patients with homocystinuria. Br J Clin Pharmacol. 2003;55:6–13. doi: 10.1046/j.1365-2125.2003.01717.x. [DOI] [PMC free article] [PubMed] [Google Scholar]
- Shechter D, et al. Extraction, purification and analysis of histones. Nat Protoc. 2007;2:1445–57. doi: 10.1038/nprot.2007.202. [DOI] [PubMed] [Google Scholar]
- Torre L, et al. DNA methylation and histone acetylation of rat methionine adenosyltransferase 1A and 2A genes is tissue-specific. Int J Biochem Cell Biol. 2000;32:397–404. doi: 10.1016/s1357-2725(99)00140-5. [DOI] [PubMed] [Google Scholar]
- Umlauf D, et al. Site-specific analysis of histone methylation and acetylation. Methods Mol Biol. 2004;287:99–120. doi: 10.1385/1-59259-828-5:099. [DOI] [PubMed] [Google Scholar]
- Vucic EA, et al. Epigenetics of cancer progression. Pharmacogenomics. 2008;9:215–34. doi: 10.2217/14622416.9.2.215. [DOI] [PubMed] [Google Scholar]
- Yang H, et al. The role of c-Myb and Sp1 in the up-regulation of methionine adenosyltransferase 2A gene expression in human hepatocellular carcinoma. FASEB J. 2001;15:1507–16. doi: 10.1096/fj.01-0040com. [DOI] [PubMed] [Google Scholar]
- Yuan QX, et al. Mallory body induction in drug-primed mouse liver. Hepatology. 1996;24:603–12. doi: 10.1002/hep.510240324. [DOI] [PubMed] [Google Scholar]


