

Abstract
Over expression of FAT10 is characteristic of numerous types of carinoma including liver, gastric and colon carcinomas. In the case of colon carcinoma it is possible to determine at the point in the progression from the benign to the malignant process of colon cancer development by determining which stage in the neoplastic process FAT10 overexpression occurs. This stage was determined by measuring the intensity of fluoresence of immunohistochemically stained normal mucosa, tubular adenomas, hyperplastic polyps, serrated adenomas, villotubular, villous adenomas and invasive adenocarcinoma stages. Using this approach it was found the overexpression of FAT10 began at the serrated adenoma stage and continued to include the villous and villotubular stages and the invasive adenocaricnoma stage. The FAT10 overexpression by invasive adenocarcinoma was accompanied by the expression of the catalytic subunits of the immunoproteasome which is functionally tied to overexpression of FAT10, Toll-like receptor activation and the proinflammatory response.
Keywords: FAT10, immunoproteasome, Toll-like receptors, interferon, proinflammatory response
INTRODUCTION
Papers, beginning with Lee et al (2003), have reported that FAT10 is up-regulated in colon cancer (Lukasiak et al, 2008). They reported that FAT10 was overexpressed in 80% of colon cancers. Lukasiak et al, 2008, found that 8 of 15 colon cancers (53%) overexpressed FAT10 as indicated by RT-PCR. The highest increase was 15 fold.
The overexpression of FAT10 by colon epithelial neoplasms suggests that proinflammatory cytokines are involved in the pathogenesis of colon cancer (Lukasiak et al., 2008). This is based on the fact that the FAT10 phenotype is a response to Toll-like receptor ligands and the cytokines IFN-γ and TNFα in liver cancer (Raasi et al., 1999; Bardag-Gorce et al., 2010a; Oliva et al., 2010; Bardag-Gorce et al., 2010b). Both IFN-γ and TNFα induce FAT10 (UBD) together with the immunoproteasome including all three catalytic subunits LMP2-7 and MECL-1 (Lukasiak et al, 2008; Bardag-Gorce et al., 2010a). In the liver FAT10 overexpression is an epigenetic marker for liver neoplasia (Oliva et al 2008; French et al., 2010a and b). FAT10 overexpression is associated with a growth advantage of the overexpressing hepatocytes (Oliva et al, 2008). Overexpression of FAT10 correlated with tumor stage and metastasis in gastric carcinoma cases (Ji et al., 2009).
In view of the overexpression of FAT10 as a sign of the influence of proinflammatory cytokines in powering the neoplastic process in the colon, we have systematically immunostained colon neoplasms to determine the level of expression of FAT10 at various stages in the carcinogenic process.
METHODS AND MATERIALS
Random samples of colon biopsy of colon neoplasms at various stages of developments as follows: normal colonic mucosa, hyperplastic polyps, tubular adenomas, serrated adenomas, villotubular adenomas, low grade dysplasias, high grade dysplasias, intramucosal adenocarcinomas, invasive adenocarcinomas were immunostained for FAT10.
Immunofluorescence staining and photography.
The biopsies were stained with a rabbit polyclonal antibody to FAT10 (ENZO Life Science Int Inc, Plymoth Meeting, PA). The second antibody used was donkey anti-rabbit (Jackson Immuno Research Lab, Inc., West Grove, PA) which was labeled with fluorescence isocyanate (FITC). 4’,6-Diamidino-2-pheylindole (DAPI) was used as a nuclear stain. The intensity of FITC/FAT10 staining was measured semiquantitatively using 2x objective magnification and a standard brightness setting of 250 ms using a Nikon 400 fluorescent microscope, and the Nikon morphometric system. A colon carcinoma was also stained with rabbit antibodies to the catalytic subunits of the immunoproteasome; LMP2 (Santa Cruz, Santa Cruz, CA), LMP7 (Abcam, Cambridge, MA), and MECL-1 (Santa Cruz, Santa Cruz, CA).
STATISTICAL ANALYSIS
Results are expressed as group Mean ± S.E.M. Data were evaluated using one-way ANOVA followed by Student’s t-test for comparisons between lesional groups and normal controls. Means were considered significantly different at P<0.05.
RESULTS
Role of FAT expression in colonic neoplasms
The role of FAT10 expression of eighteen cases of normal colon mucosa with or without an associated neoplasm, were measured for staining intensity using an antibody against FAT10. The intensity of staining was not significantly different whether there was an associated neoplasm or not (145±6.4 fluorenscent intensity units). An example is shown in Fig 1A. The intensity measurements and photographs were always taken using the same brightness setting and the same magnification so as to compare the intensity of the fluorescence of the different colonic neoplastic lesions.
Fig 1.
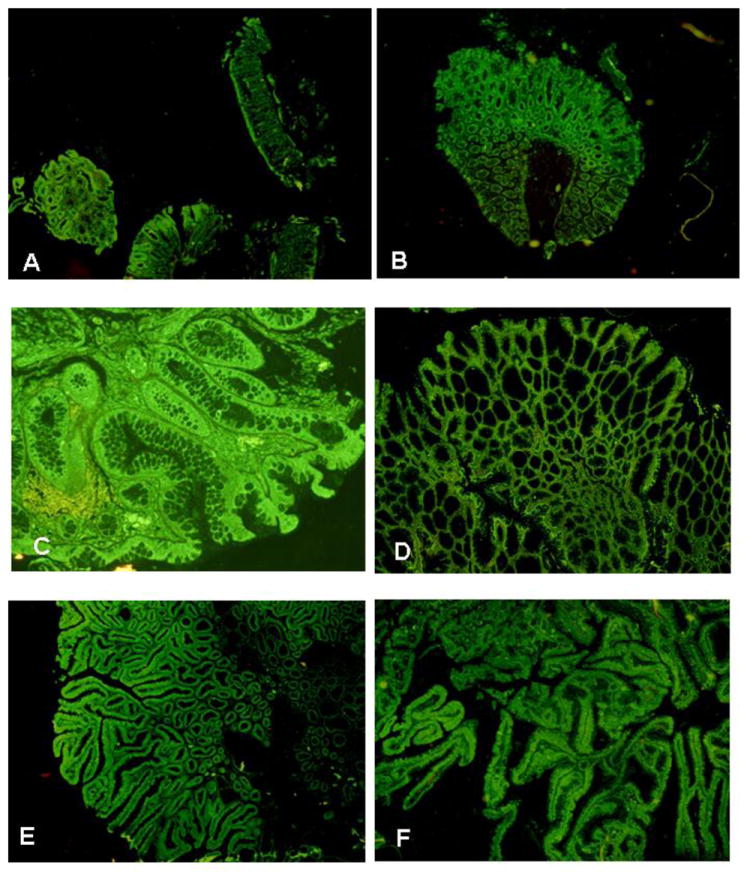
A. Normal colon mucosa cut at different planes immunostained for FAT10. x22. B. Tubular adenoma immunostained for FAT10. Note that the tubular adenoma at the top stains greener than the normal mucosa located at the bottom of the photo. x22. C. Hyperplastic polyp immunostained for FAT10. x22. D. Serrated adenoma immunostained for FAT10. x22. E. Villotubular adenoma immunostained for FAT10. x22. F. Villous adenoma immunostained for FAT10. x22.
Eight cases of tubular adenoma were measured and the staining intensity for FAT10 was not significantly different when compared with normal mucosa (Fig 1B, Fig 2, 157±4.9 fluorescent units, P=0.262).
Fig 2.
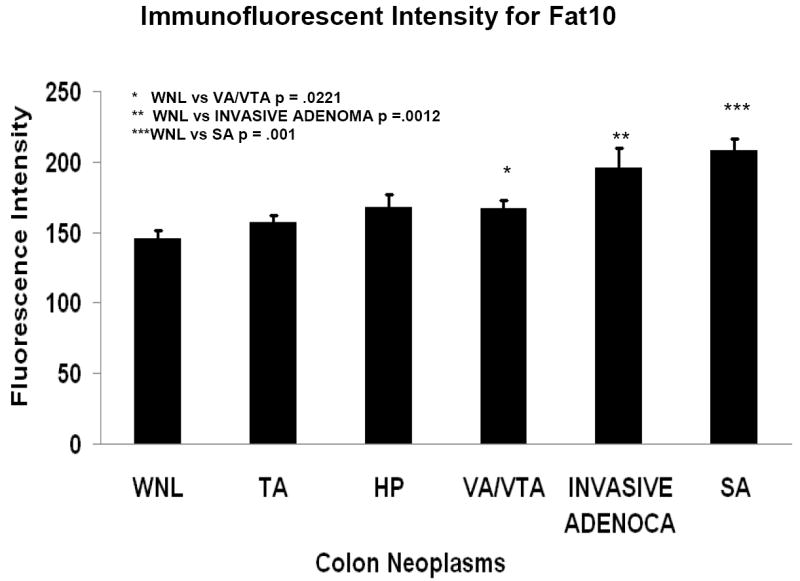
Fluorescent intensity bar graph of the colonic normal mucosa (WNL) and neoplasms. TA (tubular adenoma), HP (hyperplastic polyps), VA/VTA (villous adenoma/villotubular adenoma), SA (serrated adenoma). (Mean ±S.E.M.).
Five hyperplastic polyps were measured and the staining intensity for FAT10 was not significantly different when compared with normal mucosa (Fig 1C, Fig 2, 168±9.0 fluorescent units, P=0.098).
Five serrated adenomas were measured and the staining intensity for FAT10 was significantly increased compared to normal mucosa (Fig 1D, Fig 2, 208±8.5 fluorescent units, P=0.0001).
Twelve villotubular and villous adenomas (Fig 2E&F) were measured and the staining intensity for FAT10 was significantly increased compared to normal mucosa (Fig 2, 167±5.5 fluorescent units; P=0.0221).
Six invasive carcinomas were measured and the staining intensity for FAT10 was significantly increased compared to normal mucosa (Fig 3A, Fig 2, 196±14.1 fluorescent intensity, P=0.0012).
Fig 3.
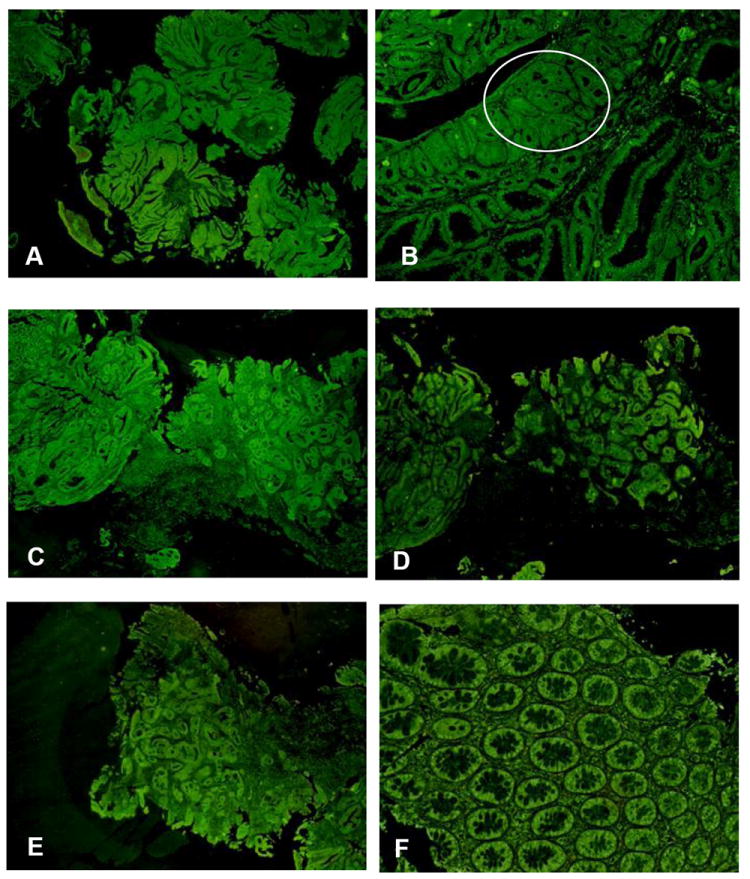
A. Invasive adenocarcinoma immunostained for FAT10. x22. B. High grade dysplasia (circle) in a villotubular adenoma. x44. C. Invasive adenocarcinoma immunostained for LMP2. x22. D. Invasive adenocarcinoma immunostained for LMP7. x22. E. Invasive adenocarcinoma immunostained for MECL-1. x22. F. Normal mucosa immunostained for MECL-1. x109.
Foci of low and high grade dysplasia and intramucosa adenocarcinoma did not appear to differ in fluorescent intensity (Fig 3B) but this was not measured because of the difficulty of locating these foci in the villotubular adenomas when the fluorescent stained specimens were examined.
Role of immunoproteasome catalytic subunits
Immunostains for the immunoproteasome catalytic subunits LMP2 and 7 and MECL-1 were performed on an invasive adenocarcinoma of the colon because the expression of the immunoproteasome subunits are coexpressed with FAT10 in response to the proinflammatory cytokines interferon gamma and TNFα (Lukasiak et al., 2008; Bardag-Gorce et al., 2010). The colon carcinomas cells stained strongly positive with antibodies to LMP2 (Fig 3C), LMP7 (Fig 3D) and MECL-1 (Fig 3E). The glands in the normal colon mucosa were also stained positive (Fig 3F).
DISCUSSION
Fan et al., (2008), using laser capture microdissecion and cDNA microarrays, documented overexpression of FAT10 by colon carcinoma cells compared to normal colon mucosa cells. In the present study, using semiquantitative immunohistochemistry for FAT10, we observed a significant increase in staining intensity for FAT10 in serrated adenomas, villotubular adenomas and invasive colon carcinomas. Although tubular adenomas and hyperplastic polyps tended to show an increase in staining intensity compared to normal mucosal cells, the increase was not at a significant level. These results suggest that FAT10 expression is involved in the mechanism of progression from the benign polyps to the development of invasive carcinoma.
FAT10, like the immunoproteasome catalytic subunits, LMP2 and 7 is expressed by a gene located at the major histocompatability complex class 1 locus on chromosome 6.
(Fan et al., 1996; Bates et al., 1997; Ebstein et al., 2009). The expression of these genes is up regulated by toll-like receptor ligands and the cytokines interferon gamma (IFNγ) and TNF) (Oliva et al., 2010; Lukasiak et al., 2008; Raasie et al., 1999, Bardag-Gorce et al., 2010a; Bardag-Gorce et al, 2010b). The expressions of FAT10 is down-regulated by wild type p53 (Zhang et al., 2006) and up-regulated by mutant p53 (Ji et al., 2009). The up-regulation of IFNγ receptors IFNqR1 and 2 (Bardag-Gorce et al., 2010b) in response to the activation of the toll-like receptors by bacterial, viral or chemical agents in the colon could activate the FAT10 associated up regulation of the immunoproteasome expression (i.e. the catalytic subunits LMP2 and 7 and MECL-1) and the proinflammatory response which leads to the neoplastic transformation of colon epithelium analogous to the same phenomenon in liver carcinogenesis (French et al., 2010b). To test this hypothesis we immunostained a colon carcinoma with antibodies to LMP2 and 7 and MECL-1. The invasive colon carcinoma cells stained intensity positive for all 3 catalytic subunits suggesting that proinflammatory cytokines are involved in the mechanisms of colon carcinogenesis.
Acknowledgments
The authors thank Adriana Flores for typing the manuscript. This study was supported by an NIH/NIAAA Alcoholic Center Grant P50-011999-11 Morphology Core.
Footnotes
Publisher's Disclaimer: This is a PDF file of an unedited manuscript that has been accepted for publication. As a service to our customers we are providing this early version of the manuscript. The manuscript will undergo copyediting, typesetting, and review of the resulting proof before it is published in its final citable form. Please note that during the production process errors may be discovered which could affect the content, and all legal disclaimers that apply to the journal pertain.
References
- Bardag-Gorce F, Oliva J, French BA, Li J, Dedes J, French SW. SAMe prevents the induction of immunoproteasome and preserves the 26s proteasome in the DDC induced MDB-mouse model. Exp Mol Pathol. 2010a;88:352–362. doi: 10.1016/j.yexmp.2010.03.001. [DOI] [PMC free article] [PubMed] [Google Scholar]
- Bardag-Gorce F, Oliva J, Lin A, Li J, French BA, French SW. SAMe prevents the up regulation of toll-like receptor signaling in Mallory body forming hepatocytes. Exp Mol Pathol. 2010b;88:376–379. doi: 10.1016/j.yexmp.2010.02.004. [DOI] [PMC free article] [PubMed] [Google Scholar]
- Bates EE, Ravel O, Dieu MC, Ho S, Guret C, Bridon JM, Ait-Yaha S, Briere F, Carux C, Banchereau J, Lebecque S. Identification and analysis of a novel member of the ubiquitin family expressed in dendritic cells and mature B cells. Eur J Immunol. 1977;27:2471–2477. doi: 10.1002/eji.1830271002. [DOI] [PubMed] [Google Scholar]
- Ebstein F, Lange A, Urban C, Seifert U, Kruger E, Kloetzel PM. Maturation of human dendritic cells is accompanied by functional remodeling of the ubiquitin-proteasome system. Int J Biochem Cell Biol. 2009;41:1205–1215. doi: 10.1016/j.biocel.2008.10.023. [DOI] [PubMed] [Google Scholar]
- Fan W, Cai W, Parimoo S, Schwartz DC, Lennon CG, Weissman SM. Identification of seven new human MHC class 1 region genes around the HLA-F locus. Immunogenetics. 1996;44:97–103. doi: 10.1007/BF02660056. [DOI] [PubMed] [Google Scholar]
- Fan J, Peng Z, Zhou C, Qiu G, Taug H, Sun Y, Wang X, Li Q, Le X, Yie K. Gene-expression profiling in Chinese patients with colon cancer by coupling experimental and bioinformatic genome wide gene expression analysis: identification and validation of IFITM3 as a biomarker of early colon carcinogenesis. Cancer. 2008;113:266–275. doi: 10.1002/cncr.23551. [DOI] [PubMed] [Google Scholar]
- French SW, Bardag-Gorce F, Li J, French BA, Oliva J. Mallory-Denk body pathogenesis revisited. World J Hepatol. 2010a;2 doi: 10.4254/wjh.v2.00. [DOI] [PMC free article] [PubMed] [Google Scholar]
- French SW, Oliva J, French BA, Li J, Bardag-Gorce F. Alcohol, nutrition and liver cancer: role of toll-like receptor signaling. World J Gastroenterol. 2010b;16:1344–1348. doi: 10.3748/wjg.v16.i11.1344. [DOI] [PMC free article] [PubMed] [Google Scholar]
- Ji F, Jin X, Xu QW, Wang ZW, Chen YL. FAT10 level in human gastric cancer and its relation with mutant p53, lymph node metastasis and TNM staging. World J Gastroenterol. 2009;15:2228–2233. doi: 10.3748/wjg.15.2228. [DOI] [PMC free article] [PubMed] [Google Scholar]
- Lee CGL, Ren J, Cheon ISY, Ban KHK, Ooi LLPJ, Tan SY, Kan A, Nuchprayoon I, Jin R, Lee K-H, Choti M, Lee LA. Expression of the FAT10 gene is highly up regulated in hepatocellular carcinoma and other gastrointestinal and gynecological cancers. Oncogene. 2003;22:2592–2603. doi: 10.1038/sj.onc.1206337. [DOI] [PubMed] [Google Scholar]
- Lukasiak S, Schiller C, Oehlscheger G, Krause P, Legler DF, Autschbach F, Schirmacher P, Breuhahn K, Groettrup M. Proinflammatory cytokines cause FAT10 up regulation in cancers of liver and colon. 2008;27:6068–6074. doi: 10.1038/onc.2008.201. [DOI] [PubMed] [Google Scholar]
- Oliva J, Bardag-Gorce F, Lin A, French BA, French SW. Role of cytokines in UBD promoter regulation and Mallory Denk body-like formation. Exp Mol Pathology. 2010;89:1–8. doi: 10.1016/j.yexmp.2010.04.001. [DOI] [PMC free article] [PubMed] [Google Scholar]
- Oliva J, Bardag-Gorce F, French BA, Li J, McPhaul L, Amidi F, Dedes J, Habibi A, Nguyen S, French SW. FAT10 is an epigenetic marker for liver preneoplasia in a drug-primed mouse model of tumorigenesis. Exp Mol Pathol. 2008;84:102–112. doi: 10.1016/j.yexmp.2007.12.003. [DOI] [PMC free article] [PubMed] [Google Scholar]
- Raasi S, Schmidtke G, deGuli R, Groettrup M. A ubiquitin-like protein which is synergistically inducible by interferon-γ and tumor necrosis factor α. 1999 doi: 10.1002/(SICI)1521-4141(199912)29:12<4030::AID-IMMU4030>3.0.CO;2-Y. [DOI] [PubMed] [Google Scholar]
- Zhang DW, Jeang KT, Lee CG. p53 negativity regulates the expression of FAT10, a gene up regulated in various cancers. Oncogene. 2006;25:2318–2327. doi: 10.1038/sj.onc.1209220. [DOI] [PubMed] [Google Scholar]