

Abstract
Bone morphogenetic proteins (BMPs) are secreted protein ligands that control numerous biological processes, such as cell differentiation and cell proliferation. Ligands are regulated by a large number of structurally diverse extracellular antagonists. PRDC or Protein related to DAN and Cerberus is a BMP antagonist of the DAN family, which is defined by a conserved pattern of cysteine residues that form a ring structure. Here we present the expression and purification of recombinant mouse PRDC (mPRDC) from bacterial (E. coli) inclusion bodies through oxidative refolding. Functional mPRDC was isolated from a nonfunctional component through reverse phase chromatography and shown to inhibit BMP2 and BMP4 in a cell-based luciferase reporter assay. Recombinant mPRDC also bound directly to BMP2, BMP4 and BMP7, but not activin A. Furthermore, circular dichroism indicated that mPRDC is folded and contains a higher than anticipated helical content for a DAN family member protein.
Keywords: Oxidative refolding, BMP antagonist, TGFβ family
Introduction
The TGFβ family of secreted protein ligands is composed of over 30 individual members categorized into three main classes (activins, bone morphogenetic proteins and TGFβs). During development ligands execute the instructions that define the body plan of animals and in the adult are involved in numerous biological processes (e.g. inflammation, reproduction and immune surveillance) [1–5]. Ligands signal by assembling type I and type II Ser/Thr kinase receptors to activate intracellular pathways [6–7].
A number of structurally distinct extracellular protein antagonists bind and neutralize TGFβ family ligands. Antagonists and receptors compete for similar surfaces on the ligand. Structural studies have revealed that the antagonists noggin and follistatin both interact at the type I and type II ligand interfaces, although with quite different strategies [8–13]. Antagonists typically bind with high affinity to a particular class of ligands, but can have overlapping activities with a number of family members [14–16].
BMPs have the largest and most diverse array of extracellular inhibitors. This includes chordin, twisted gastrulation, noggin and several members of the DAN family, which include PRDC, gremlin, DAN, SOST, Coco and Cerberus [17–22]. PRDC, also known as gremlin2, has been shown to be a potent antagonist of BMP2 and BMP4 signaling [23]. PRDC was first identified in a gene trapping experiment and was found to be expressed in commissural neurons of the central nervous system [24]. PRDC has also been shown to be highly expressed in the brain, ovary and spleen and may play an important role in regulating BMP activity in these tissues [23]. Evidence supports the interplay of BMP4 and PRDC in epibrachial neuron specification and osteogenesis [25].
Although the overall sequence identity of DAN family members is low, antagonists exhibit a conserved arrangement of cysteine residues that form an eight-membered ring [26]. The ring assembles into a cystine knot motif similar to TGFβ family ligands, as depicted in the NMR structures of SOST [27–28]. Secondary structure predictions of the other family members indicate that most DAN antagonists display a mixture of β-sheet and random coil, resulting in a flattened structure without a hydrophobic core [27–28]. This topology, along with the large number of disulfide bonds, increases the difficulty of large-scale recombinant protein production of DAN family members.
Several expression strategies are available to facilitate the production of disulfide-bonded proteins. Recent advances have been made in mammalian cell expression, which have helped increase expression yields and decrease production times [29]. However, these methods are still significantly more costly and more time-consuming than recombinant protein expression using bacteria. Disulfide bonded proteins are typically over-expressed in bacteria as insoluble aggregates or inclusion bodies (IB). To recover the protein, IB are then purified, resolubilized and subjected to oxidative refolding. Similar to the crystallization of proteins, optimal solution conditions for refolding are highly dependent on the protein under investigation. As the number of successfully refolded disulfide bonded proteins increases, a number of trends have been identified [30–31]. For instance, it is common to vary the redox potential of the refolding solution (e.g. the ratio of oxidized and reduced glutathione) or to include L-arginine, which has been shown to prevent protein aggregation [32–34]. Prior to refolding, proteins are typically subjected to chromatographic separation, which occurs under strong reducing conditions or after the cysteines have been reversibly modified by S-sulfonation. Several examples have demonstrated the effective use of S-sulfonation of proteins prior to refolding [35–37]. The use of S-sulfonation in the refolding of human PRDC has previously been reported [38]. In this study, we present an optimized refolding protocol with increased yields for the efficient production and purification of biologically active mouse PRDC (mPRDC).
Materials and Methods
Construction of pET-mPRDC Plasmid
The gene sequence encoding the 441 base pairs of mouse PRDC (amino acid residues: 22–168) (GenBank accession no. AB011030) was amplified from pCS2-mPRDC-6xMyc (a generous gift from Dr. Eek-hoon Jho, University of Seoul, Korea) [39] by standard PCR reaction. The insert was cloned into pET-21a (Novagen) using NdeI and XhoI and designated pET21a–mPRDC. The 5′ primer included the ATG start codon and the 3′ primer included the TCA stop codon. This resulted in a protein product that did not include additional purification tags. The nucleotide sequence was verified using primers corresponding to the T7 promoter and terminator present in the vector.
Protein Expression and Inclusion Body Preparation
For protein expression, the pET21a–mPRDC plasmid was transformed into E. coli BL21 (DE3) Rosetta cells and grown on Lysogeny broth (LB) agar plates supplemented with ampicillin (100 mg/ml) (amp) and chloramphenicol (34 mg/ml) (cam) at 37°C overnight. A single colony was used to inoculate a 20 mL starter culture of LB/amp/cam media and incubated with shaking overnight at 37°C. One liter of LB/amp/cam media was inoculated with the starter culture and incubated at 37°C with shaking until the OD at 600 nm reached 0.8–1.0. Expression of recombinant mPRDC was then induced by addition of 0.5 mM IPTG. After 3.5 hrs, cells were harvested by centrifugation at 10,000 × g for 10 min at 4°C. Pellets containing mPRDC IB were resuspended in the following buffer (1x PBS pH 7.4, 0.35 mg/ml lysozyme, 10 μg/ml DNAse I, 3 mM MgCl2) and lysed through sonication. Lysate was centrifuged at 7,000 × g for 30 min at 4°C. The pellet containing the IB was resuspended in 50 ml of IB wash buffer (50 mM Tris, 100 mM NaCl, 0.5% Triton X-100, 1 mM EDTA, pH 8.0), followed by centrifugation at 13,200 × g for 10 min at 4°C. This step was repeated two times followed by an identical wash with a buffer lacking Triton X-100. IB pellets were resuspended in 5 ml of 8 M Urea, 100 mM Tris, 1 mM EDTA, 10 mM Na2S4O6, 100 mM Na2SO3, pH 8.5, stirred for 16 hrs at room temperature and clarified through centrifugation.
Pre-refolding Purification, Refolding and Purification
Purification of the solubilized IB was performed as previously described with minor modifications [38]. Briefly, the solubilized IB was loaded on a Sephacryl S-200 column (120 ml) equilibrated in 8 M Urea, 50 mM MES, 200 mM NaCl, 1 mM EDTA, pH 6.0. Fractions containing mPRDC were diluted with 6 M Urea, 20 mM MES, pH 6.0 and loaded on a Hiprep 16/10 SP XL cation-exchange column (20 ml) and eluted with a 1M NaCl gradient over 10 column volumes (10 CVs). Fractions containing purified, denatured mPRDC were pooled and added drop-wise into refolding solutions (Table 1) to a final concentration of 0.1 mg/ml and incubated at 4°C under constant stirring. After 5 days of refolding, mPRDC was applied to a C18 reverse phase HPLC column (14.2 ml) and eluted with a linear gradient (6.6 CVs) of acetonitrile (30–50%) containing 0.1% TFA. Fractions of individual peaks containing mPRDC were pooled and buffer exchanged with 20 mM HEPES, 150 mM NaCl, pH 7.5. Relative protein purity and concentrations were determined by SDS-PAGE densitometry measurements and the bicinchoninic (BCA) protein assay (Thermo Scientific).
Table 1.
Formulation of mPRDC refolding solutions
| Solution a | 1 | 2 | 3 | 4 | 5 | 6 | 7 | 8 | 9 | 10 |
|---|---|---|---|---|---|---|---|---|---|---|
| Tris HCl pH 8.5 (50 mM) | --b | --c | ||||||||
| NaCl (150 mM) | --d | |||||||||
| GSH/GSSG (5 mM/5 mM) | --e | --f | ||||||||
| Cysteine (0.5 mM) | --g | |||||||||
| EDTA (5 mM) | ||||||||||
| Arginine (0.5 M) | --h | --i | --j | |||||||
| % Inhibitionk | 98.5 | 39.6 | 0 | 0 | 98.2 | 93.4 | 92.8 | 97.3 | 87.3 | 98.4 |
| Yield (μg/μl)l | 0.05 | <0.01 | <0.01 | <0.01 | 0.03 | 0.04 | 0.03 | 0.03 | 0.04 | 0.03 |
| Precipitationm | * | *** | *** | ***** | * | * | *** | ** | ** | ** |
Components used for each solution unless otherwise noted:
Tris HCl, pH 7.4;
MES pH 5;
1 M NaCl;
5 mM/1 mM GSH/GSSG;
1 mM/5 mM GSH/GSSG;
0mM cysteine,
1% CHAPS;
1% sodiumtaurodeoxycholate;
No arginine.
Inhibitory activity of 10 μl of refolded, dialyzed protein on BMP2 signaling in the luciferase reporter assay.
Total protein recovery as measured by BCA.
Precipitation was scored using a five-point scale from one
indicating no precipitation to five
indicating mostly precipitated.
Circular Dichroism (CD) Measurements
CD spectral investigations were performed on an Aviv 215 spectropolarimeter. mPRDC was measured at a protein concentration of 0.8 mg/ml buffered in 10 mM NaH2PO4, 100 mM NaF, pH 8.0. Spectra were recorded from 190 to 300 nm at a rate of 20 nm/min with a step resolution and bandwidth of 1 nm at 25°C. Each spectrum represents an average of 3 scans and is expressed as the molar mean residue ellipticity at a given wavelength.
Luciferase-reporter assay
To measure the potency of mPRDC to inhibit BMP and activin A signaling, a cell-based luciferase-reporter assay was used. For BMP inhibitory studies, C2C12-BRE stable cells [40] (a generous gift from Dr. Gareth Inman, Beatson Institute for Cancer Research, UK) were plated at 2×10⁴ cells/well in 24-well plates containing DMEM supplemented with 2 mM L-glutamine, 10% fetal bovine serum (FBS), 100 U/ml of penicillin, 100 U/ml streptomycin and 700 μg/ml G418 and grown at 37°C in 5% CO2. After 18 hrs, cells were washed with PBS and the medium was replaced with 0.5 ml of DMEM plus 0.1% FBS and 1x Pen/Strep for 6 to 8 hrs. BMP-related ligands were mixed with mPRDC and allowed to incubate at room temperature for 45 to 60 min and applied overnight to the C2C12-BRE cells. For activin A inhibitory studies, HEK293-CAGA stable cells were treated as previously described [41] with ligand alone or preincubated with mPRDC. Cells were lysed in 100 μl of 1x Passive Lysis Buffer and luciferase activity was measured using the Luciferase Assay System (Promega). Error bars indicate the standard deviation of percent activity from individual wells performed in triplicate. Percent activity was calculated as percentage of the ligand signal in the absence of mPRDC.
Surface Plasmon resonance (SPR) analysis
SPR measurements were performed using a Biacore 3000 (GE Biosciences). BMP2, 4, 7 were purchased from R&D Systems. Activin A was produced as previously described [11]. Ligands were immobilized on carboxymethylated dextran matrix (CM5) sensor chips by primary amine coupling and terminated with ethanolamine. All sensograms were corrected by subtraction from a control cell that was mock coupled in HPBS buffer (Biacore). mPRDC was diluted in running buffer (20 mM HEPES, 500 mM NaCl, 0.005% Surfactant P20, pH 7.4) and injected at various concentrations at a flow rate of 30 μl/min. The association phase was measured for 6 min followed by a 40 min dissociation phase. After each cycle, chip surfaces were regenerated by a short injection of 2 M GnHCl.
Results
Expression and purification of PRDC
Native, untagged mPRDC (17 kDa, residues 22–168) was over-expressed in E. coli BL21 (DE3) Rosetta cells. mPRDC was exclusively found in the insoluble fraction as inclusion bodies (Fig. 1A). A patent describing the purification and refolding of PRDC was used a starting point for subsequent optimization [38]. Following expression, the IB were isolated by centrifugation and washed repeatedly with and without the addition of Triton x-100. Purified IB were solubilized in urea and maintained under denaturing conditions until oxidative refolding was initiated. The major contaminant was a band that migrated at twice the expected MW. This band contained mPRDC as determined by western blotting, but failed to migrate at 17 kDa under highly reducing conditions. Since refolding yields can be dramatically affected by sample purity, we further purified mPRDC through a two-column scheme which included size exclusion (Sephacryl S-200) followed by cation exchange (Hiprep SP) under denaturing conditions (Fig. 1B). The resulting material was over 95% pure with a significant reduction in the relative levels of the 34 kDa contaminant.
Fig. 1.

Expression, isolation and refolding trials of mPRDC. (A) SDS-PAGE analysis of the mPRDC expression in E. coli BL21(DE3) Rosetta grown at 37°C. Lane designation is as follows: Lane M- MW standards (and in all subsequent gels), Lane 1- Cell lysate before induction, Lane 2- Cell lysate after overnight induction at 37°C with 0.5 mM IPTG, Lane 3- supernatant after lysis, lane 4- pellet after lysis. Arrow points to mPRDC band. In each lane 20 μl of sample was loaded. (B) Purification of denatured mPRDC IB with size exclusion and cation exchange SP-sepharose column. Lane 1- 2 μl of solubilized mPRDC IB. Lane 2- selected fraction of mPRDC from HiLoad Sephacryl S-200 column elution, Lane 3- selected fraction from Hiprep 16/10 SP XL column elution after S-200 purification. (C) Reduced and (D) Nonreduced SDS-PAGE analysis of mPRDC refolding. Samples were clarified by centrifugation to remove precipitated protein prior to loading. Lanes 1–10 corresponds to the different refolding conditions of mPRDC as described in Table 1.
PRDC refolding trials
Refolding mPRDC under conditions previously described (50 mM Tris HCl pH 8.5, 1M NaCl, 0.5 mM cysteine) resulted in a significant amount of protein precipitation, decreasing the overall yield. Therefore, to determine more efficient refolding conditions that resulted in higher yields of active protein, mPRDC was subjected to a panel of commonly used oxidative refolding reagents and additives, as described in Table 1. Typically during oxidative refolding, misfolded protein either precipitates or forms a ladder of disulfide-bonded aggregates. Therefore, we monitored the success of refolding by both reduced and non-reduced SDS-PAGE (Figs. 1C and 1D). Recovery yields were determined by BCA protein assay then confirmed by SDS-PAGE gel. (Table 1). Significantly more precipitation was observed in the solutions without L-arginine (Fig. 1D, lanes 2, 3 and 4) than in the buffers containing 0.5 M L-arginine (Fig. 1D, lanes 1 and 5–10). This demonstrates that L-arginine is a critical component that prevents mPRDC aggregation during refolding [32–34]. To determine if samples contained bioactive mPRDC, refolded protein was analyzed for the ability to inhibit BMP signaling in C2C12 cells stably transfected with the luciferase gene under control of a BMP-responsive promoter [40]. The protein recovery yield and biological activity of refolded mPRDC as measured by percent BMP inhibition for each condition are presented in Table 1. Several conditions resulted in high yields of bioactive protein. For further analysis, we focused on condition 1 for large-scale purification and analysis.
Large scale preparation and refolding of PRDC
After selection of the refolding condition, IB were prepared from 4 L of induced E. coli culture, which yielded approximately 44 mg of mPRDC protein (Table 2). After initial rounds of purification, approximately 89% of the sample was discarded due to overlap with the 34 kDa contaminant. Refolding of purified mPRDC was initiated by rapid dilution into refolding buffer to minimize aggregation. After 5 days of refolding, it is possible to have a population of misfolded, inactive protein with non-native disulfide bond structure that remains soluble. Therefore, to further isolate properly folded mPRDC from the soluble misfolded component the sample was applied to a C18 reverse phase HPLC column. The protein eluted in two peaks; a sharp first peak (Peak-1) and a broader second peak (Peak-2) (Figs. 2A and 2B). The final purified mPRDC from Peak-1 was determined to be over 97% pure (Fig. 2C). The protein migrates as a monomer under both reducing and non-reducing SDS-PAGE with an apparent MW shift (Fig. 2C) supporting the presence of internal disulfide bonds. The final purification statistics are presented in Table 2, and the final yield is 0.3 mg per liter of bacterial culture.
Table 2.
Prokaryotic expression, refolding, and purification of recombinant mPRDC
| Purification step | Total Protein (mg) b | Total PRDC (mg) b | Overall yield (%) | Purity (%) c |
|---|---|---|---|---|
| Bacterial lysatea | 531.9 | 50 | 100 | 9.4 |
| Unwashed Inclusion bodies | 434.7 | 46.5 | 93 | 10.7 |
| Washed inclusion bodies | 76.2 | 44.1 | 88.2 | 57.9 |
| Sephacryl S-200 (IB) | 20.5 | 17.4 | 34.8 | 84.6 |
| Hiprep SP (IB) | 25.8 | 21.3 | 42.6 | 82.6 |
| Hiprep SP (IB/Sephacryl S-200) | 4.8 | 4.6 | 9.2 | 95.4 |
| Refold and C18 (Sephacryl S-200 only) | 3.4 | 3.1 | 6.2 | 89.6 |
| Refold and C18 (Hiprep SP only) | 4.9 | 4.1 | 8.2 | 82.5 |
| Refold and C18 (Sephacryl S-200+ Hiprep SP) | 1.3 | 1.26 | 2.6 | >97 |
Results are given for 8 g of wet weight cells derived from 4 L of E. coli culture.
Protein concentration from pooled samples determined by the BCA assay using bovine serum albumin as a standard protein.
The purity was determined by using SDS-PAGE densitometry software ImageJ (http://rsb.info.nih.gov/ij/).
Fig. 2.

Purification of refolded mPRDC. (A) Elution profile of mPRDC applied to a reverse phase C18 column. Sample: 50 ml of refolded mPRDC in (50 mM Tris HCl pH 8.5; 150 mM NaCl; 5 mM EDTA; 0.5 M arginine; 5 mM GSH; 5 mM GSSG; 0.5 mM cysteine); mobile phase A:[5% acetonitrile, 0.1% TFA]; mobile phase B:[95% acetonitrile, 0.1% TFA]; fractions 1 ml; flow rate 0.5 ml/min. Sample eluted with a linear gradient of 30–50% B for 2 hours. Fractions B5 and B6 were pooled and designated Peak-1 and fractions B10-B13 were pooled and designated Peak-2 (B) SDS-PAGE gel of selected C18 fractions under reducing conditions. Lane M- MW standards, Lane Load- 30 μl of refolded protein applied to the C18 column, Lane FT- unbound sample, Lanes B4-B11- 20 μl of the corresponding C18 fractions. (C) SDS-PAGE of pooled Peak-1 C18 fractions from different purification strategies after buffer exchange with 20 mM HEPES, 150 mM NaCl pH 7.5. Each lane was loaded with 2.5 μg of protein and analyzed under reducing and non-reducing conditions.
Although the purity of the final mPRDC was >97%, we wanted to determine if the overall yield could be increased by eliminating one of the two chromatographic steps prior to refolding. Therefore, the resolubilized IB were either purified by SEC or ion-exchange chromatography prior to refolding. In each case the protein was refolded under similar conditions and separated by the C18 reverse phase column. For comparison, the purification results, including yields, are presented in Table 2. During refolding more precipitation was observed with the different single-column purifications than with the two-column purification scheme. The final purified mPRDC from the different single-column purifications was analyzed by SDS-PAGE (Fig. 2C). Overall the yield is significantly higher for the one-step purification schemes, but the final product contains significantly more contaminants.
Recombinant PRDC inhibits BMP2 and BMP4
To determine if either Peak-1 or Peak-2 from the reverse phase C18 column contained biologically active mPRDC, each was assayed for its ability to inhibit BMP signaling using the C2C12-BRE luciferase-reporter assay [40]. Treatment of C2C12 cells with BMP ligand alone caused a robust increase in luciferase activity (Fig. 3). When BMP ligands were preincubated with increasing amounts of PRDC protein from Peak-1, both BMP2 and BMP4 signaling was abolished (Fig. 3A). In contrast, fractions from Peak-2 were relatively ineffective at the same inhibitor concentrations (Fig. 3B). We also tested if PRDC from Peak-1 and Peak-2 could inhibit the ligand activin A in a similar reporter assay (Fig. 3C) [41]. Consistent with previously published results for human PRDC produced in HEK293T cells, the PRDC from Peak-1 failed to inhibit activin A signaling [23]. Therefore, although both peaks represent soluble versions of PRDC, only Peak-1 contains properly folded and biologically active protein that is able to inhibit BMP signaling. This supports that reverse phase chromatography is an effective means of removing biologically inactive mPRDC that would hinder biophysical and structural characterization. Furthermore, this also supports that bacterial derived PRDC behaves similarly to PRDC expressed in mammalian cells.
Fig. 3.

Recombinant mPRDC inhibits BMP signaling. (A,B) C2C12 cells stably transfected with a BMP responsive luciferase reporter were treated with BMP2 (left) or BMP4 (right) alone or in pre-incubated with increasing concentrations of mPRDC from either Peak-1 (A) or Peak-2 (B). (C) Recombinant mPRDC does not inhibit activin A signaling. HEK293 response to activin A signaling shows that mPRDC Peak-1 (top) and Peak-2 (bottom) do not interfere with activin A signaling. Percent activity was calculated as percentage of the ligand signal in the absence of mPRDC.
Surface plasmon resonance analysis
We next determined if mPRDC binds directly to TGFβ family ligands by surface plasmon resonance. Ligands were immobilized on the sensor chips and binding sensograms were measured by injecting mPRDC as described under Materials and Methods. Fig. 4 shows an overlay of the sensograms obtained by interaction of mPRDC with sensor chips coupled to BMP2, 4, 7 and activin A. The binding curves were corrected for nonspecific binding and bulk refractive index effects by subtracting signals obtained from the reference flow cell. Binding was observed with all BMPs as indicated by the significant increase in response units. The binding profiles of mPRDC to BMP2 and 4 were characterized by a rapid association phase and an extremely slow dissociation phase. A similar behavior has previously been described for other TGFβ family antagonists [14–15]. In contrast to BMP2 and 4, mPRDC dissociated more rapidly from BMP7, indicating a weaker interaction (Fig 4). This matches reported results where human PRDC was shown to be a more effective BMP2 and 4 antagonist over BMP7 [23]. Binding appears specific for BMPs, as little or no interaction of mPRDC with activin A was observed (Fig 4).
Fig. 4.
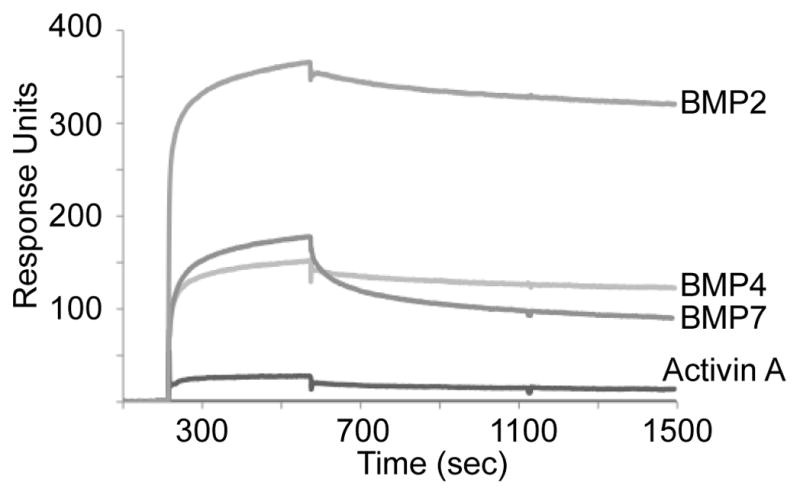
SPR analysis of mPRDC binding to immobilized BMP2, 4, 7 & activin A. mPRDC at 1.6 μM in 20 mM Hepes, 500 mM NaCl, 0.005% P20 pH 7.4 buffer at 25°C was injected over the immobilized sensor chip at a ow rate of 30 μL/min to monitor the association phase, and buffer alone was injected to measure the dissociation phase. A significant increase in response units (RU) were observed with BMP2, 4 & 7, while minimal binding occurred with activin A.
Secondary structure analysis of mPRDC
The secondary structure of refolded, biologically active mPRDC protein from Peak-1 was characterized by CD spectroscopy in the far-UV region (190–300 nm) (Fig. 5A). The CD spectra indicated that the recombinant protein contained a substantial amount of α-helix secondary structure, with a maximum in ellipticity at 202 nm and a minimum at 220 nm. Analysis of the secondary structure content with CD spectra analysis programs indicated a range of 33–52% α-helix [42–45]. This is a slightly higher helical content than expected from secondary structure predictions and also higher than that observed with the other DAN family members [17–19, 27–28]. In contrast, the CD spectra for the biologically inactive mPRDC of Peak-2 displayed a completely random coil profile (Fig 5B).
Fig. 5.

Far-UV CD based analysis of mPRDC form Peak-1 (A) or Peak-2 (B). The far-UV CD spectra of mPRDC in 10 mM NaH2PO4 and 100 mM NaF were recorded at 25°C in the range of 190–300 nm.
Discussion
Obtaining significant quantities of BMP antagonists is challenging due to the considerable number of intramolecular disulfide bonds that need to join in a defined arrangement. Generation of the BMP antagonist SOST has been achieved by both refolding bacterial inclusion bodies and by expression as a soluble maltose-binding protein fusion in E. coli (OrigamiB) [27–28]. PRDC and SOST are expected to have a similar disulfide-bonding pattern, but the production of recombinant mPRDC is complicated because PRDC consists of an odd number of cysteines, leaving one unpaired. In this study, we describe an optimized protocol for refolding mPRDC from bacterial inclusion bodies. We also show that, depending on the desired level of purity, the overall yield could be dramatically increased by eliminating one of the chromatographic steps prior to refolding. Therefore, studies that require high levels of purity would be better suited with a two-step purification scheme prior to refolding.
In the three refolding schemes tested, an active and inactive population of PRDC was formed, which required further separation. The inactive component likely contained a non-native arrangement of disulfide bonds but still remained soluble even though it exhibited little secondary structure. Interestingly, the lack of activity for this fraction suggests that the biological activity of PRDC is not confined to a small peptide sequence, but requires a properly folded protein. It is also possible that the inactive PRDC protein has a disulfide arrangement that sequesters the BMP binding epitopes.
The recombinant bacterial mPRDC produced here potently binds and inhibits BMP2, BMP4 and BMP7 but does not interfere with activin A signaling. The IC50 values reported here for BMP inhibition (IC50<1nM) of the bacterial recombinant mPRDC are similar or slightly better than those previously published on mammalian produced PRDC (IC50=3nM) [23]. PRDC includes two N-linked glycosylation consensus sequences, which are modified in mammalian cell expression. Since this modification is absent in bacteria, our data supports that N-linked glycosylation is not necessary for BMP binding and inhibition. This does not rule out the possibility that glycosylation is involved in BMP binding. The procedure presented here allows for the large-scale production of recombinant mPRDC derived from bacteria that is homogenous with similar potency towards BMP as the mammalian derived protein.
Highlights.
Determine optimal oxidative refolding conditions for refolding PRDC
Isolated active from inactive soluble PRDC by HPLC
Purified PRDC potently inhibits and binds BMP-type ligands
Acknowledgments
This work was supported by the NIH grant (GM084186) to T.B.T.
Abbreviations
- BMP
bone morphogenetic protein
- PRDC
protein related to dan and cerberus
- TGFβ
transforming growth factor beta
- DAN
differential screening-selected gene aberrant in neuroblastoma
- IB
inclusion body
- GnHCl
guanidine hydrochloride
- BRE
BMP responsive element
- MW
molecular weight
Footnotes
Publisher's Disclaimer: This is a PDF file of an unedited manuscript that has been accepted for publication. As a service to our customers we are providing this early version of the manuscript. The manuscript will undergo copyediting, typesetting, and review of the resulting proof before it is published in its final citable form. Please note that during the production process errors may be discovered which could affect the content, and all legal disclaimers that apply to the journal pertain.
References
- 1.Attisano L, Wrana JL. Signal transduction by the TGF-beta superfamily. Science. 2002;296:1646–1647. doi: 10.1126/science.1071809. [DOI] [PubMed] [Google Scholar]
- 2.Chang H, Brown CW, Matzuk MM. Genetic analysis of the mammalian transforming growth factor-beta superfamily. Endocr Rev. 2002;23:787–823. doi: 10.1210/er.2002-0003. [DOI] [PubMed] [Google Scholar]
- 3.Hogan BL. Bone morphogenetic proteins in development. Curr Opin Genet Dev. 1996;6:432–438. doi: 10.1016/s0959-437x(96)80064-5. [DOI] [PubMed] [Google Scholar]
- 4.Kingsley DM. The TGF-beta superfamily: new members, new receptors, and new genetic tests of function in different organisms. Genes Dev. 1994;8:133–146. doi: 10.1101/gad.8.2.133. [DOI] [PubMed] [Google Scholar]
- 5.Massague J. How cells read TGF-beta signals. Nat Rev Mol Cell Biol. 2000;1:169–178. doi: 10.1038/35043051. [DOI] [PubMed] [Google Scholar]
- 6.Derynck R. TGF-beta-receptor-mediated signaling. Trends Biochem Sci. 1994;19:548–553. doi: 10.1016/0968-0004(94)90059-0. [DOI] [PubMed] [Google Scholar]
- 7.Shi Y, Massague J. Mechanisms of TGF-beta signaling from cell membrane to the nucleus. Cell. 2003;113:685–700. doi: 10.1016/s0092-8674(03)00432-x. [DOI] [PubMed] [Google Scholar]
- 8.Groppe J, Greenwald J, Wiater E, Rodriguez-Leon J, Economides AN, Kwiatkowski W, Affolter M, Vale WW, Belmonte JC, Choe S. Structural basis of BMP signalling inhibition by the cystine knot protein Noggin. Nature. 2002;420:636–642. doi: 10.1038/nature01245. [DOI] [PubMed] [Google Scholar]
- 9.Harrington AE, Morris-Triggs SA, Ruotolo BT, Robinson CV, Ohnuma S, Hyvonen M. Structural basis for the inhibition of activin signalling by follistatin. EMBO J. 2006;25:1035–1045. doi: 10.1038/sj.emboj.7601000. [DOI] [PMC free article] [PubMed] [Google Scholar]
- 10.Thompson TB, Lerch TF, Cook RW, Woodruff TK, Jardetzky TS. The structure of the follistatin:activin complex reveals antagonism of both type I and type II receptor binding. Dev Cell. 2005;9:535–543. doi: 10.1016/j.devcel.2005.09.008. [DOI] [PubMed] [Google Scholar]
- 11.Stamler R, Keutmann HT, Sidis Y, Kattamuri C, Schneyer A, Thompson TB. The structure of FSTL3.activin A complex. Differential binding of N-terminal domains influences follistatin-type antagonist specificity. J Biol Chem. 2008;283:32831–32838. doi: 10.1074/jbc.M801266200. [DOI] [PMC free article] [PubMed] [Google Scholar]
- 12.Lerch TF, Shimasaki S, Woodruff TK, Jardetzky TS. Structural and biophysical coupling of heparin and activin binding to follistatin isoform functions. J Biol Chem. 2007;282:15930–15939. doi: 10.1074/jbc.M700737200. [DOI] [PubMed] [Google Scholar]
- 13.Cash JN, Rejon CA, McPherron AC, Bernard DJ, Thompson TB. The structure of myostatin:follistatin 288: insights into receptor utilization and heparin binding. EMBO J. 2009;28:2662–2676. doi: 10.1038/emboj.2009.205. [DOI] [PMC free article] [PubMed] [Google Scholar]
- 14.Hashimoto O, Kawasaki N, Tsuchida K, Shimasaki S, Hayakawa T, Sugino H. Difference between follistatin isoforms in the inhibition of activin signalling: activin neutralizing activity of follistatin isoforms is dependent on their affinity for activin. Cell Signal. 2000;12:565–571. doi: 10.1016/s0898-6568(00)00099-1. [DOI] [PubMed] [Google Scholar]
- 15.Keller S, Nickel J, Zhang JL, Sebald W, Mueller TD. Molecular recognition of BMP-2 and BMP receptor IA. Nat Struct Mol Biol. 2004;11:481–488. doi: 10.1038/nsmb756. [DOI] [PubMed] [Google Scholar]
- 16.Kusu N, Laurikkala J, Imanishi M, Usui H, Konishi M, Miyake A, Thesleff I, Itoh N. Sclerostin is a novel secreted osteoclast-derived bone morphogenetic protein antagonist with unique ligand specificity. J Biol Chem. 2003;278:24113–24117. doi: 10.1074/jbc.M301716200. [DOI] [PubMed] [Google Scholar]
- 17.Hsu DR, Economides AN, Wang X, Eimon PM, Harland RM. The Xenopus dorsalizing factor Gremlin identifies a novel family of secreted proteins that antagonize BMP activities. Mol Cell. 1998;1:673–683. doi: 10.1016/s1097-2765(00)80067-2. [DOI] [PubMed] [Google Scholar]
- 18.Pearce JJ, Penny G, Rossant J. A mouse cerberus/Dan-related gene family. Dev Biol. 1999;209:98–110. doi: 10.1006/dbio.1999.9240. [DOI] [PubMed] [Google Scholar]
- 19.Topol LZ, Marx M, Laugier D, Bogdanova NN, Boubnov NV, Clausen PA, Calothy G, Blair DG. Identification of drm, a novel gene whose expression is suppressed in transformed cells and which can inhibit growth of normal but not transformed cells in culture. Mol Cell Biol. 1997;17:4801–4810. doi: 10.1128/mcb.17.8.4801. [DOI] [PMC free article] [PubMed] [Google Scholar]
- 20.Zimmerman LB, De Jesus-Escobar JM, Harland RM. The Spemann organizer signal noggin binds and inactivates bone morphogenetic protein 4. Cell. 1996;86:599–606. doi: 10.1016/s0092-8674(00)80133-6. [DOI] [PubMed] [Google Scholar]
- 21.Ross JJ, Shimmi O, Vilmos P, Petryk A, Kim H, Gaudenz K, Hermanson S, Ekker SC, O’Connor MB, Marsh JL. Twisted gastrulation is a conserved extracellular BMP antagonist. Nature. 2001;410:479–483. doi: 10.1038/35068578. [DOI] [PubMed] [Google Scholar]
- 22.Balemans W, Van Hul W. Extracellular regulation of BMP signaling in vertebrates: a cocktail of modulators. Dev Biol. 2002;250:231–250. [PubMed] [Google Scholar]
- 23.Sudo S, Avsian-Kretchmer O, Wang LS, Hsueh AJ. Protein related to DAN and cerberus is a bone morphogenetic protein antagonist that participates in ovarian paracrine regulation. J Biol Chem. 2004;279:23134–23141. doi: 10.1074/jbc.M402376200. [DOI] [PubMed] [Google Scholar]
- 24.Minabe-Saegusa C, Saegusa H, Tsukahara M, Noguchi S. Sequence and expression of a novel mouse gene PRDC (protein related to DAN and cerberus) identified by a gene trap approach. Dev Growth Differ. 1998;40:343–353. doi: 10.1046/j.1440-169x.1998.t01-1-00010.x. [DOI] [PubMed] [Google Scholar]
- 25.Ideno H, Takanabe R, Shimada A, Imaizumi K, Araki R, Abe M, Nifuji A. Protein related to DAN and cerberus (PRDC) inhibits osteoblastic differentiation and its suppression promotes osteogenesis in vitro. Exp Cell Res. 2009;315:474–484. doi: 10.1016/j.yexcr.2008.11.019. [DOI] [PubMed] [Google Scholar]
- 26.Avsian-Kretchmer O, Hsueh AJ. Comparative genomic analysis of the eight-membered ring cystine knot-containing bone morphogenetic protein antagonists. Mol Endocrinol. 2004;18:1–12. doi: 10.1210/me.2003-0227. [DOI] [PubMed] [Google Scholar]
- 27.Veverka V, Henry AJ, Slocombe PM, Ventom A, Mulloy B, Muskett FW, Muzylak M, Greenslade K, Moore A, Zhang L, Gong J, Qian X, Paszty C, Taylor RJ, Robinson MK, Carr MD. Characterization of the structural features and interactions of sclerostin: molecular insight into a key regulator of Wnt-mediated bone formation. J Biol Chem. 2009;284:10890–10900. doi: 10.1074/jbc.M807994200. [DOI] [PMC free article] [PubMed] [Google Scholar]
- 28.Weidauer SE, Schmieder P, Beerbaum M, Schmitz W, Oschkinat H, Mueller TD. NMR structure of the Wnt modulator protein Sclerostin. Biochem Biophys Res Commun. 2009;380:160–165. doi: 10.1016/j.bbrc.2009.01.062. [DOI] [PubMed] [Google Scholar]
- 29.Cacciatore JJ, Chasin LA, Leonard EF. Gene amplification and vector engineering to achieve rapid and high-level therapeutic protein production using the Dhfr-based CHO cell selection system. Biotechnol Adv. 2010;28:673–681. doi: 10.1016/j.biotechadv.2010.04.003. [DOI] [PubMed] [Google Scholar]
- 30.Clark EDB. Refolding of recombinant proteins. Curr Opin Biotechnol. 1998;9:157–163. doi: 10.1016/s0958-1669(98)80109-2. [DOI] [PubMed] [Google Scholar]
- 31.Vallejo LF, Rinas U. Strategies for the recovery of active proteins through refolding of bacterial inclusion body proteins. Microb Cell Fact. 2004;3:11. doi: 10.1186/1475-2859-3-11. [DOI] [PMC free article] [PubMed] [Google Scholar]
- 32.Buchner J, Rudolph R. Renaturation, purification and characterization of recombinant Fab-fragments produced in Escherichia coli. Biotechnology (N Y) 1991;9:157–162. doi: 10.1038/nbt0291-157. [DOI] [PubMed] [Google Scholar]
- 33.Rudolph R. Renaturation of recombinant, disulfide-bonded proteins from inclusion bodies. In: Tschesche H, editor. Modern methods in protein and nucleic acid research. 1990. pp. 149–171. [Google Scholar]
- 34.Shiraki K, Kudou M, Fujiwara S, Imanaka T, Takagi M. Biophysical effect of amino acids on the prevention of protein aggregation. J Biochem. 2002;132:591–595. doi: 10.1093/oxfordjournals.jbchem.a003261. [DOI] [PubMed] [Google Scholar]
- 35.Chan WW. A method for the complete S sulfonation of cysteine residues in proteins. Biochemistry. 1968;7:4247–4254. doi: 10.1021/bi00852a016. [DOI] [PubMed] [Google Scholar]
- 36.Fischer B, Sumner I, Goodenough P. Isolation, Renaturation, and Formation of Disulfide Bonds of Eukaryotic Proteins Expressed in Escherichia-Coli as Inclusion-Bodies. Biotechnol Bioeng. 1993;41:3–13. doi: 10.1002/bit.260410103. [DOI] [PubMed] [Google Scholar]
- 37.Middelberg AP. Preparative protein refolding. Trends Biotechnol. 2002;20:437–443. doi: 10.1016/s0167-7799(02)02047-4. [DOI] [PubMed] [Google Scholar]
- 38.Economides AN, Stahl N. DCR5, A BMP-Binding protein, and applications thereof. 6,660,499 B1. US Patent. 2003
- 39.Im J, Kim H, Kim S, Jho EH. Wnt/beta-catenin signaling regulates expression of PRDC, an antagonist of the BMP-4 signaling pathway. Biochem Biophys Res Commun. 2007;354:296–301. doi: 10.1016/j.bbrc.2006.12.205. [DOI] [PubMed] [Google Scholar]
- 40.Herrera B, Inman GJ. A rapid and sensitive bioassay for the simultaneous measurement of multiple bone morphogenetic proteins. Identification and quantification of BMP4, BMP6 and BMP9 in bovine and human serum. BMC Cell Biol. 2009;10:20. doi: 10.1186/1471-2121-10-20. [DOI] [PMC free article] [PubMed] [Google Scholar]
- 41.Cash JN, Angerman EB, Kattamuri C, Nolan K, Zhao H, Sidis Y, Keutmann HT, Thompson TB. Structure of Myostatin{middle dot}Follistatin-like 3: N-terminal domains of Follistatin-type molecules exhibit alternate modes of binding. J Biol Chem. 2012;287:1043–1053. doi: 10.1074/jbc.M111.270801. [DOI] [PMC free article] [PubMed] [Google Scholar]
- 42.Andrade MA, Chacon P, Merelo JJ, Moran F. Evaluation of secondary structure of proteins from UV circular dichroism spectra using an unsupervised learning neural network. Protein Eng. 1993;6:383–390. doi: 10.1093/protein/6.4.383. [DOI] [PubMed] [Google Scholar]
- 43.Whitmore L, Wallace BA. Protein secondary structure analyses from circular dichroism spectroscopy: methods and reference databases. Biopolymers. 2008;89:392–400. doi: 10.1002/bip.20853. [DOI] [PubMed] [Google Scholar]
- 44.Whitmore L, Wallace BA. DICHROWEB, an online server for protein secondary structure analyses from circular dichroism spectroscopic data. Nucleic Acids Res. 2004;32:W668–673. doi: 10.1093/nar/gkh371. [DOI] [PMC free article] [PubMed] [Google Scholar]
- 45.Johnson WC. Analyzing protein circular dichroism spectra for accurate secondary structures. Proteins. 1999;35:307–312. [PubMed] [Google Scholar]