Abstract
The ability of cells to respond to changes in their environment is mediated by transcription factors that remodel chromatin and reprogram expression of specific subsets of genes. In Saccharomyces cerevisiae, changes in carbon source lead to gene induction by Adr1 and Cat8 that are known to require the upstream function of the Snf1 protein kinase, the central regulator of carbon metabolism, to exert their activating effect. How Snf1 facilitates transcription activation by Adr1 and Cat8 is not known. Here we show that under derepressing conditions, deletion of SNF1 abolishes the increase of histone H3 acetylation at the promoter of the glucose-repressed ADY2 gene, and as a consequence profoundly affects the chromatin structural alterations accompanying transcriptional activation. Adr1 and Cat8 are not required to regulate the acetylation switch and show only a partial influence on chromatin remodelling at this promoter, though their double deletion completely abolishes mRNA accumulation. Finally, we show that under derepressing conditions the recruitment of the histone acetyltransferase Gcn5 is abolished by SNF1 deletion, possibly explaining the lack of increased histone H3 acetylation and nucleosome remodelling.
The results highlight a mechanism by which signalling to chromatin provides an essential permissive signal that is required for activation by glucose-responsive transcription factors.
Keywords: Adr1, ADY2, Cat8, nucleosome remodelling, histone acetylation, Snf1
1. Introduction
The influence of the environment on gene expression is mediated by evolutionary conserved epigenetic mechanisms. Among the various stress conditions requiring cell adaptation, much attention has been recently focused on nutrient/metabolism-induced differentiation. Understanding the molecular mechanisms behind these transcriptional changes, by exploiting simple model systems such as yeast, will help to provide clues to cope with disease-related alterations of these processes [1].
In Saccharomyces cerevisiae, glucose depletion causes a coordinated transcriptional response consisting of a change in the mRNA level of more than one fourth of the genes [2,3]. The main glucose repression pathway was studied extensively for many years and is responsible for negative control - when glucose is available - of genes involved in respiration, gluconeogenesis and the metabolism of alternative carbon sources [4]. Central components of the pathway are the Snf1 protein kinase, the Mig1 DNA binding repressor and the Mig1-interacting co-repressor complex Cyc8(Ssn6)-Tup1 [5]. Snf1, a founding member of the Snf1/AMPK (AMP-activated protein kinase) family is required for adaptation to glucose limitation and the use of alternative carbon sources less preferred than glucose, such as sucrose, galactose, and ethanol [6–8]. In addition to its primary role in response to nutrient stress, Snf1 is involved in cell adaptation to many other environmental stresses, including osmotic stress, heat shock, alkaline pH, oxidative stress, and genotoxic stress [9]. Growing evidence suggests a much broader role of Snf1 as a master regulator of carbon and energy metabolism [1].
Snf1 affects cellular regulatory processes by a variety of mechanisms, including the control of genomic transcriptional programs and direct effects on the activity of metabolic enzymes [8]. Mechanisms of transcriptional control include phosphorylation and translocation of the Mig1 repressor [10,11], interaction with the activator Sip4 [12], phosphorylation and activation of Cat8 [13,14], regulation of the binding of the activator Adr1 [15], and interaction with the transcriptional apparatus [16,17]. Moreover, Snf1 was shown to have a role in histone acetylation at the INO1 promoter [18], although this finding is controversial [17], and recent evidence underlines direct regulation of Gcn5 transcriptional activity [19].
To understand whether Snf1 controls nucleosome structure and remodelling we analysed the phenotypic consequences of SNF1 deletion on the glucose-regulated ADY2 promoter during activation, and found that the absence of Snf1 affects Gcn5 recruitment and completely abolishes the increase in H3 acetylation occurring at the −1 and +1 nucleosomes, thus impairing their remodelling. In the same conditions, the absence of either Adr1 or Cat8 activators or both does not influence histone H3 acetylation and only partially affects chromatin remodelling, suggesting that the major role of Snf1 at this promoter is to control histone acetyltransferase function to drive nucleosome changes.
2. Material and methods
2.1 Yeast strains and media
Saccharomyces cerevisiae strains used in this work are all derived from W303-1A (MATa ade2 can1–100 his3–11, 15 leu2–13, 112 trp1–1 ura3–1), or W303-1B (MATα ade2 can1–100 his3–11, 15 leu2–13, 112 trpl-1 ura3–1), or W303-CH1a (MATa ade2-1 can1–100 his3–11, 15 leu2–3, 112 ssd1-d2 trp1–1 ura3–1 rho+): KVRY9 (wild type), W303-1B with ADR1-HA(3X)∷KAN; KVRY9–1 (snf1), same as KVRY9 except snf1Δ∷URA3 [15]; CKY19–1 (wild type), W303-1A; CKY13-1 (adr1), same as CKY19-1 except adr1Δ∷kanmx; CKY15-1 (cat8), same as CKY19-1 except cat8Δ∷kanmx; CKY23-1 (adr1 cat8), same as CKY19-1 except adr1Δ∷natmxcat8Δ∷kanmx [20,21]; ADR1, GCN5 and RPD3 were tagged with 13MYC epitopes in W303-CH1a using the pFA6a-13MYC-natmx6 tagging vector [22] to generate KBY91, KBY95 and KBY97, respectively. GAL83 and SNF1 were tagged with 6HA epitopes in KBY91 (ADR1-13MYC∷natmx) using the pYM3 (6HA-klTRP1) tagging vector [23] to generate KBY98 and KBY100, respectively. SNF1 was deleted from KBY95 (GCN5-13MYC∷natmx) and KBY107 (RPD3-13MYC∷natmx) by replacing the SNF1 ORF with the kanmx cassette amplified from pUG6 [24] to generate KBY105 and KBY107, respectively.
Yeast strains were grown in YPD medium (1% yeast extract, 2% bacto peptone, 3% glucose). To derepress the analysed genes, the cells were collected by centrifugation, washed twice with water, and resuspended in the same volume of fresh YP medium containing 0.05% glucose for the appropriate time.
2.2 Enzymes
All nucleases were purchased from Roche. Zymolyase 100T was purchased from Seikagaku Corp.
2.3 RNA analysis
Aliquots containing the same number of cells were collected by centrifugation, and total RNA was prepared as previously described [25]. After spectrophotometric determination of the RNA amount present in each aliquot, 10 μg of RNA were loaded onto 1.2% agarose-MOPS gels containing formaldehyde and ethidium bromide. Northern blot analysis was performed by standard procedures. Probes were prepared as follows: to detect ADY2 mRNA oligonucleotides used were Fw 5′GTACCATGAAATCCACTGTTATG3′ and Rev 5′CTGCATATGCGTTGTACCAA3′ (starting positions 610 and 755 respectively); to detect U3 snoRNA oligonucleotides used were Fw 5'TTTGAAGGGATAGGGCTCTATGGGTGGGT3' and Rev 5'TCGGTTTCTCACTCTGGGGTACAAAGGT3'; to detect ADH2 mRNA a 5′-end-labelled oligonucleotide was used (5′GTTGGTAGCCTTAACGACTGCGCTAAC3′ from +710 to +684 of the coding region).
2.4 ChIP with anti-acetylated histone antibody and real time PCR analysis
ChIP was carried out with a specific antibody raised against acetylated lysines K9 and K14 of histone H3 (Upstate, Catalogue N. 06-599), as described previously [26], with some modification: both dimethyladipimate (Thermo SCIENTIFIC) and formaldehyde were used as crosslinking agents. Immunoprecipitations were performed using 2 μg of anti-acetyl-histone H3 per 220 μg of cell lysate. Concentration of cell lysates was determined using the Bradford protein assay reagent (Bio-Rad) with bovine serum albumin (Roche) as standard. Control immunoprecipitations without antibody (No Ab) were also performed, in order to evaluate and subtract the background. Input, immunoprecipitated and No Ab DNA were analysed by real time PCR. For real time PCR 1 μl of input, immunoprecipitated DNA or No Ab were used as template in 20 μl reactions containing 1× Power SYBR Green PCR Master Mix (Applied Biosystems) and 15 pmol of each primer. PCR amplification was performed on ABI-PRISM, Applied Biosystems 7500 adopting the following conditions: initial denaturation was at 95°C for 5 min, followed by 40 cycles of: 95°C for 15 sec and 58°C for 60 sec. The promoter primers used in real-time PCR assays were as follows: Fw 5'AACCACAAAACAACTCATATACAAACAA3' and Rev 5'TAAATCTTGCCCAACGAATCATGAG3' to detect ADY2 nucleosome −1 and +1 H3 acetylation levels; as normalization control we used Fw 5'CTTCTTGGTTTGAGTAGAAAG3' and Rev 5'AACCGTTTTGAAACCAAACTC3' to detect ACT1. Biological replicates of samples were run in triplicate and data were analyzed using the Fast System SDS 1.4 Software (Applied Biosystems) which relies on the comparative Ct method of quantification [27]. Statistical analysis was carried out by Student's t test. Differences were considered significant when p< 0.05.
2.5 ChIP with anti-PolII, anti-c-Myc and anti-HA antibodies and quantitative real time PCR analysis
To detect PolII occupancy at the ADY2 promoter, ChIP was performed using a monoclonal antibody against the CTD of PolII (8WG16: Abcam ab817). To detect Snf1-HA and Gal83-HA occupancy, a sequential ChIP was done starting with a ChIP for PolII followed by a ChIP using a monoclonal antibody to the HA epitope (F-7: Santa Cruz sc-7392). To detect Gcn5-myc and Rpd3-myc occupancy, ChIP was performed with a monoclonal antibody to the c-myc epitope (9E10; Santa Cruz Biotechnology sc-40). Cells were crosslinked with 3 mM Ethylene glycol bis[succinimidylsuccinate] for 45 minutes followed by 1% formaldehyde for 15 minutes. Immunoprecipitations were performed using 6 μg of anti-c-myc or 2 μg anti-HA per 1 mg of cell lysate. Concentration of cell lysates was determined using the Bradford protein assay reagent (Bio-Rad) with bovine serum albumin (Sigma) as the standard. Input and immunoprecipitated DNA were analysed by quantitative real time PCR: immunoprecipitated DNA and different dilutions of input DNA were used as the template in 10 μl reactions containing 1X SsoFast EvaGreen SuperMix (Bio-Rad) and 3 pmol of each primer. PCR amplification was performed on a MJReasearch Chromo 4 System using the following temperature cycle: 95°C for 30 sec, followed by 40 cycles of 95°C for 5 sec and 60°C for 25 sec. The primers used in qPCR assays were as follows: Fw 5'GCACCTTGGTTGGATCGTAT3' and Rev 5'GTGTTTCCGCTCGTTTGTTC3' to detect Gcn5 and Rpd3 occupancy on ADY2 TSS; Fw 5'CCCCGCAACTTTCCTTATTT3' and Rev 5'ATCTCGCTGCAGATGACCTT3' to analyse Snf1, Gal83 and PolII occupancy; as a normalization control we used Fw 5'GCGTAACAAAGCCATAATGCCTCC3' and Rev 5'CTCGTTAGGATCACGTTCGAATCC3' to detect TEL06R. Biological triplicates were run and the Ct values were determined using the Opticon Monitor 3 software and the ChIP values were calculated using the Pfaffl method [28]. Statistical analysis was carried out by Student's t test. Differences were considered significant when p< 0.05.
2.6 Chromatin analysis
The analysis of nucleosome positioning was performed by using MN digestion of spheroplasts coupled with the indirect end labelling procedure [29]. Cells exponentially growing (A600 0.3 OD ml−1) in repressing (3% glucose) or derepressing (0.05% glucose) conditions were washed twice with water and then resuspended in Zymolyase buffer (1 M sorbitol, 50 mM Tris-HCl pH 7.5, 10 mM β-mercaptoethanol). Incubation with Zymolyase (0.01 mg OD−1) was for 20 min at room temperature. The resulting spheroplasts were collected by centrifugation and resuspended in Nystatin buffer (1 M sorbitol, 20 mM Tris-HCl pH 8.0, 1.5 mM CaCl2, 50 mM NaCl, 100 μg ml−1 Nystatin) in order to permeabilize cell membranes for the subsequent treatment with MN [30]. Incubation with MN was for 15 min at 37°C and the reaction was stopped with 5 mM EDTA, 1% SDS final concentrations. The samples were then treated with proteinase K for 2 h at 56°C and purified by phenol-chloroform extraction and ethanol precipitation. After secondary digestion with the appropriate restriction endonuclease the samples were run on 1.5% agarose gels in TBE 1× buffer and transferred to nitrocellulose filters. Southern blot and hybridization were performed by standard procedures. Probes for the indirect end-labelling analysis were prepared as follows: to prepare the ADH2 3' probe, pFA plasmid DNA was digested with HindIII and TaqI [31] and the fragment eluted by agarose gel; to prepare the ADY2 3' probe, yeast genomic DNA was subjected to PCR amplification with the oligonucleotides Fw 5′GTACCATGAAATCCACTGTTATG3′ and Rev 5′CTGCATATGCGTTGTACCAA3′ (starting positions 610 and 755 respectively) and the fragment was eluted by agarose gel.
3. Results
3.1 ADY2 promoter structure
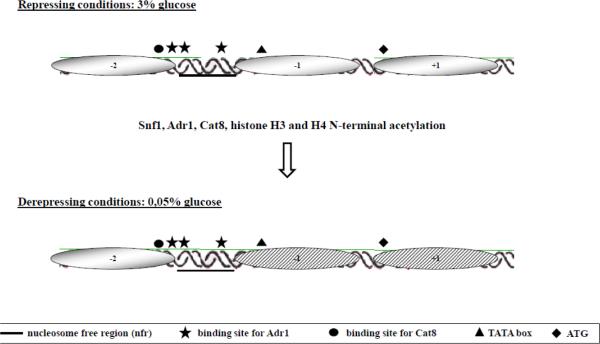
The ADY2 gene belongs to the class of glucose-regulated genes and functions as an acetate transporter and is involved in nitrogen utilisation [32,33]. The chromatin organisation of its promoter in both repressing and derepressing conditions has already been described [34]. A schematic representation of the promoter structure with the positions of the relevant regulatory nucleosomes and transcription factor binding sites is reported in Fig. 1. The TATA box-containing nucleosome −1 and ATG containing nucleosome +1 are remodelled between 30 min and 1 h after the shift to low glucose conditions, concomitantly with transcription activation. Alteration in the level of the core histones H3 and H4 N-terminal acetylation affects chromatin remodelling and transcription [34,35]. Among the regulators of ADY2 promoter function, the transcriptional activator Adr1 is only partially required for nucleosome destabilisation [34], suggesting that other factors could be more relevant to drive this event. We therefore investigated the role in chromatin conformational change of the transcriptional activator Cat8, which is known to bind the Carbon Source Responsive Element (CSRE), and the protein kinase Snf1, which is known to regulate the function of both Adr1 and Cat8.
Fig. 1.
ADY2 promoter structure. The drawing shows the 3 nucleosomes spanning the regulatory region of the ADY2 promoter. Their positions were previously mapped [41] and are as follows: nucleosome −2, −438 −308; nucleosome −1, −178 −18; nucleosome +1, −18 +172. The relevant regulatory sites are shown with symbols. Chromatin remodelling occurring when cells are shifted to low glucose conditions involves nucleosomes −1 and +1 as already described [35]
3.2 ADY2 mRNA accumulation is strongly impaired in the absence of Snf1 or both Adr1 and Cat8
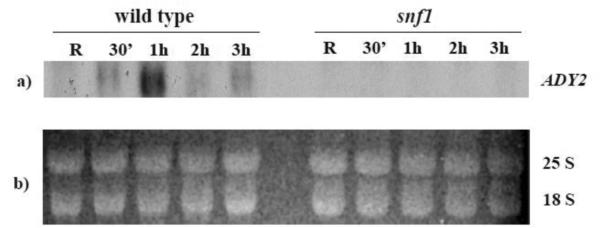
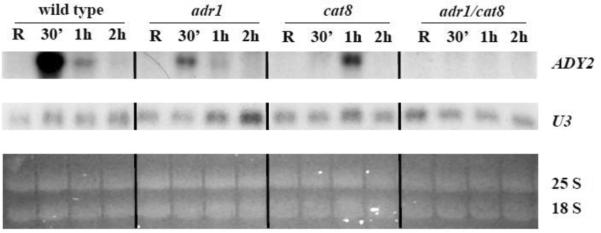
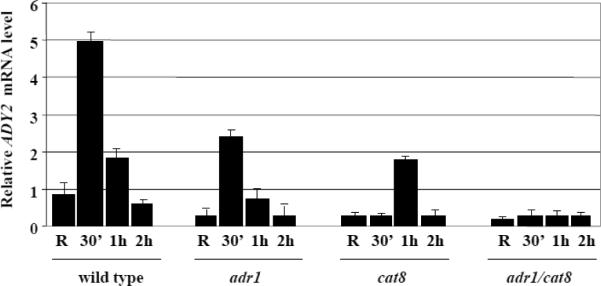
First, we analysed by Northern blotting the dependence of ADY2 mRNA accumulation on Adr1 and Cat8 in two sets of isogenic strains (wild type and snf1; wild type, adr1, cat8, and adr1cat8, see Material and methods for genotypic details). Fig. 2A shows the results obtained by comparing wild type and snf1 strains. A peak of mRNA accumulation is visible in the wild type strain after 1 h of growth in the presence of low glucose, whereas in the snf1-deleted strain transcription appears to be abolished. Fig 2B shows the results obtained by comparing wild type, adr1, cat8 and adr1cat8 strains. ADY2 mRNA accumulation in this wild type strain peaks at 30 min, with the earlier timing of activation, similar to the wild type strain shown in Fig. 2A. Evaluation of ADY2 mRNA level relative to U3 snoRNA levels (Fig. 2C) reveals reduced activation in strains lacking either Adr1 or Cat8 transcription factors. Interestingly, the peak of this reduced transcription is delayed to 1 h in the absence of Cat8. When both factors are lacking transcription is abolished.
Fig. 2.
Kinetics of ADY2 mRNA accumulation in wild type, snf1, adr1, cat8 and adr1 cat8 deletion strains. (A) Northern analysis for the wild type and snf1 deletion strains. Cells were collected in repressing conditions (R = 3% glucose) and at 30 min, 1 h, 2 h and 3 h after the shift to derepressing conditions (0.05% glucose). 10 μg of total RNA were loaded on 1.2% formaldehyde-agarose gel, transferred to a nylon membrane and hybridized with a probe specific for ADY2 gene, as described in Material and methods. 25S and 18S indicate the two major yeast rRNA species. (B) Northern analysis for the wild type (CKY19–1), adr1 (CKY13–1), cat8 (CKY15–1) and adr1 cat8 (CKY23–1) strains. Cells were collected in repressing conditions (R = 3% glucose) and at different times (30 min, 1 h and 2 h) after the culture was shifted to derepressing conditions (0.05% glucose). 25S and 18S indicate the two major yeast rRNA species. Normalisation was obtained by probing for U3 snoRNA. (C) Histograms represent the densitometric evaluation of ADY2 mRNA level relative to U3 snoRNA level. Error bars indicate the standard deviation of data obtained by two biological replicates.
Taken together the results indicate that Snf1 plays a major role in ADY2 mRNA accumulation, presumably by controlling the function of the two activators Adr1 and Cat8, whose simultaneous absence cause the same transcriptional phenotype as SNF1 deletion.
3.3 Chromatin remodelling is only partially affected in the absence of either or both Adr1 and Cat8
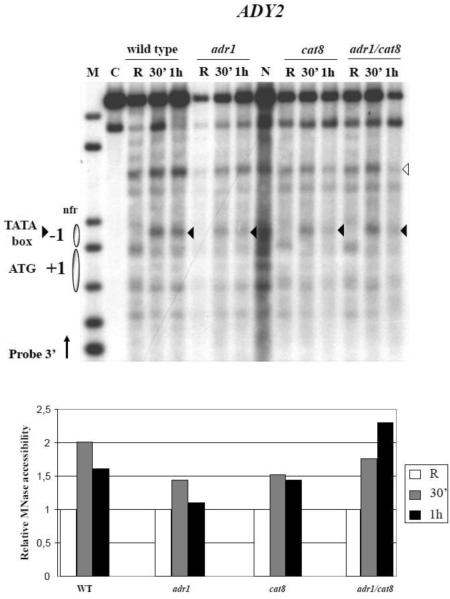
We next analysed by Micrococcal Nuclease (MN) digestion of nystatin permeabilised spheroplasts nucleosome destabilisation occurring at the ADY2 promoter during activation in low glucose conditions. Fig. 3 shows the results obtained by comparing wild type, adr1, cat8 and adr1cat8 deletion strains. MN accessibility inside nucleosome −1, and more precisely at the TATA box (black arrowhead), is strongly increased after 30 min in activating medium in the wild type strain, at the time of maximal mRNA accumulation (Fig. 2B), and slightly decreases at 1 h (see Fig. 3, lower panel for quantification). Deletion of ADR1 partially reduces this accessibility, as already described [34], and the same holds true when CAT8 is deleted alone. When CAT8 is deleted in combination with ADR1 chromatin remodelling is still observed.
Fig. 3.
Analysis of chromatin remodelling at the ADY2 promoter in strains carrying deletion of ADR1, CAT8 or ADR1 CAT8. Top panel: nystatin treated spheroplasts from wild type (CKY19–1), adr1 (CKY13–1), cat8 (CKY15–1), and adr1 cat8 (CKY23–1) cells growing in repressing (R = 3% glucose) or derepressing (0.05% glucose, for 30 min and 1 h) conditions were digested with MN (1.2 units 400 ml−1 for each condition). After secondary digestion with EcoRI restriction enzyme the samples were transferred to a nitrocellulose filter and hybridized with a probe 3' (see Material and methods). Nucleosomes are represented by ovals. C, control sample not treated with MN but digested with EcoRI; N, purified genomic DNA treated in vitro with MN and digested with EcoRI; M, molecular weight marker, 1 kb DNA ladder (Invitrogen); nfr, nucleosome free region. Bottom panel: histograms show the relative MN accessibility of the −1 nucleosome. The MN band corresponding to chromatin remodelling in the −1 nucleosome (black arrowhead) was quantified relative to an unrelated MN band (white arrowhead) present in a chromatin region not expected to be affected by the conditions tested, and therefore considered indicative of the actual amount of digested DNA loaded in the lane. For the repressing (R) conditions the value of the ratio black/white arrowheads has been fixed to 1.
These results indicate that efficient chromatin remodelling requires the activity of either Adr1 or Cat8, but remodelling can still occur even in the absence of both activators, suggesting they have a stronger effect on RNA polymerase function, rather than nucleosome rearrangement.
3.4 Adr1 and Cat8 are not required for the increase of histone H3 acetylation level concomitant with chromatin remodelling
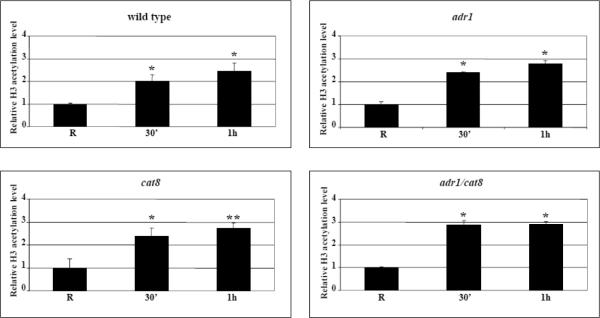
Because of the tight link between chromatin remodelling and histone acetylation observed at a group of co-regulated genes including ADY2 [34,35], we investigated the role of the two transcription factors Adr1 and Cat8 in the increase of histone H3 acetylation normally observed when glucose is lowered in a wild type strain, in the promoter region spanning part of the −1 and part of the +1 nucleosomes. Fig. 4A shows the results obtained by comparing wild type, adr1, cat8 and adr1 cat8 deletion strains in chromatin immunoprecipitation (ChIP) experiments with an antibody against acetylated H3 K9 and K14. Surprisingly, the increase of acetylation level occurring at 30 min and 1 h of growth in derepressing conditions (0,05% glucose) is not abolished by either ADR1 or CAT8 single deletion, nor by the double deletion. The results indicate that Adr1 and Cat8 are not involved in the specific histone H3 acetylation events taking place during activation of ADY2.
Fig. 4.
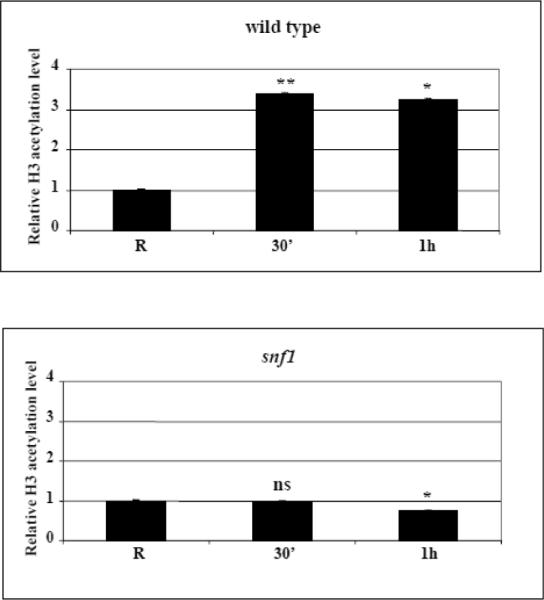
Kinetics of increase in histone H3 acetylation levels at the ADY2 promoter in wild type and mutant strains. (A) Chromatin immunoprecipitation was performed on wild type (CKY19–1), adr1 (CKY13–1), cat8 (CKY15–1) and adr1 cat8 (CKY23–1) mutant strains. Cells were collected in repressing conditions (R = 3% glucose) and at 30 min and 1 h after the shift to derepressing conditions (0.05% glucose). Cross-linked protein–DNA complexes were immunoprecipitated using antibody against acetylated lysines K9 and K14 of histone H3. Control material was without antibody (No Ab). DNA was amplified by real-time PCR using primer pairs as described in Material and methods. A primers pair for ACT1 promoter was used as control. The acetylation value of ADY2 promoter obtained by RT-PCR was corrected subtracting first the No Ab value, and then the input value. The same elaboration was performed for ACT1 used as reference gene. The final value of ADY2 acetylation level was calculated subtracting ACT1 value from ADY2 value. Histograms show the relative H3 acetylation enrichment during activation, obtained by dividing the value at 30 min and at 1 h of derepression by the value in repressing conditions (R value ~1). Error bars indicate the standard deviation of data obtained from biological replicates of samples analyzed in triplicate. *p<0.05; **p<0.001; ns, not significant. (B) Chromatin immunoprecipitation was performed as in (A) but on wild type and snf1 deletion strains.
3.5 SNF1 deletion abolishes the increase of histone H3 acetylation level in activating conditions
We previously described that the increase of histone H3 acetylation level, required for activation of the ADY2 promoter, depends on the function of the acetyltransferase Gcn5 [35], as shown by using a point mutation in the Gcn5 catalytic site. Since Adr1 and Cat8 are not relevant for the induction of this specific histone modification in derepressing conditions, we argued that a more direct role could be played by Snf1 protein kinase. We therefore investigated by ChIP in both repressing and activating conditions the same promoter region spanning part of the −1 and part of the +1 nucleosomes, in wild type and isogenic snf1 deletion strains, and the results are shown in Fig. 4B. We observed that the increase in histone H3 acetylation was completely abolished in the absence of Snf1, implying a major role for this protein kinase in driving chromatin modifications required for promoter remodelling and transcriptional activation.
3.6 Snf1 plays a major role in chromatin remodelling at the ADY2 promoter
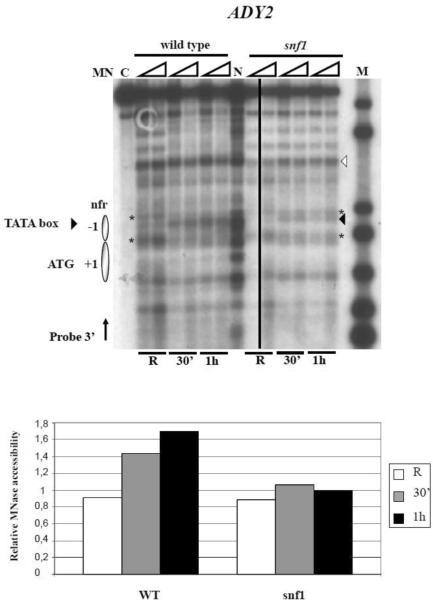
The results shown so far indicate that the absence of both Adr1 and Cat8 activators do not strongly compromise chromatin remodelling at the ADY2 promoter (Fig. 3), whereas their most relevant role is played at a step subsequent to nucleosome rearrangement, presumably to drive RNA polymerase II recruitment, as previously demonstrated [36] and as indicated by the loss of mRNA accumulation in the double deletion mutant (Fig. 2B). We therefore performed chromatin analysis by MN to assess the role of Snf1 in promoter structural remodelling. Fig. 5 shows the results obtained by comparing wild type and snf1 deletion strains. Three features indicative of chromatin remodelling can be observed in the wild type strain: i) MN accessibility at the TATA box level inside nucleosome −1 (arrowhead) is strongly increased after 30 min in activating medium; ii) the intensity of the MN bands corresponding to the upstream and downstream borders of nucleosome −1 (asterisk) decreases, as expected by a more dynamic chromatin configuration; iii) accessibility inside the ATG-containing nucleosome +1 is visible. Some of these features are not observed in the absence of Snf1: in fact, the intensity of the MN bands corresponding to nucleosome −1 borders (asterisk) remains constant, and the accessibility inside nucleosome +1 is abolished, suggesting a much more static chromatin structure lacking H3 tail acetylation. Even though MN accessibility of the TATA region appears to increase under derepressing conditions in the absence of Snf1, the ratio between the relative MN accessibility of the TATA box (black arrowhead) and of the upstream border (higher asterisk), that we consider as indicative of the extent of remodelling of the −1 nucleosome during activation, is much higher in the wild type strain (see quantitative analysis in Fig. 5, bottom panel).
Fig. 5.
Analysis of chromatin remodelling at the ADY2 promoter in wild type and snf1 deletion strains. Nystatin treated spheroplasts from wild type and snf1 cells growing in repressing (R = 3% glucose) or derepressing (0.05% glucose, for 30 min and 1 h) conditions were digested with MN (0.6 and 1.2 units 400 ml−1 for each condition). After secondary digestion with EcoRI restriction enzyme the samples were transferred to a nitrocellulose filter and hybridized with a probe 3' (see Material and methods). Nucleosomes are represented by ovals. C, control sample not treated with MN but digested with EcoRI; N, purified genomic DNA treated in vitro with MN and digested with EcoRI; M, molecular weight marker, 1 kb DNA ladder (Invitrogen); nfr, nucleosome free region. Bottom panel: histograms show the extent of remodelling of the −1 nucleosome, represented as the ratio between the relative MN accessibility of the TATA box (black arrowhead) and of the upstream border (higher asterisk), measured in the samples treated with 1.2 MN units. Each value was normalized relative to an unrelated MN band (white arrowhead) present in a chromatin region not expected to be affected by the conditions tested, and therefore considered indicative of the actual amount of digested DNA loaded in the lane.
We therefore assign to Snf1 a role in driving the chromatin conformational changes necessary to allow the start of mRNA accumulation at the ADY2 promoter, because in this specific instance, we were able to rule out the involvement of the two main activators Adr1 and Cat8 in histone acetylation.
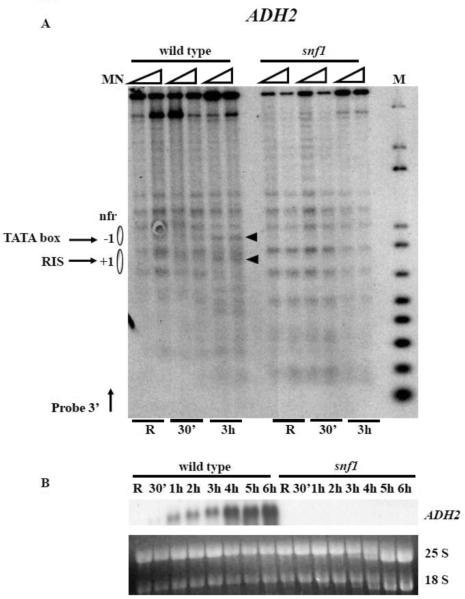
We also analysed the effects of deleting SNF1 on chromatin remodelling at the well characterized ADH2 promoter and the result is shown in Fig. 6, panel A. Chromatin remodelling, slightly visible after 30 min in derepressing conditions in the wild type strain, became prominent after 3 h, involving several nucleosomes including −1 and +1. In the same conditions, no remodelling (Fig. 6, panel A) and no transcription (Fig. 6, panel B) was observed in the snf1 deletion mutant. This phenotype was already observed in the case of the adr1 deletion mutant [37], and histone H3 acetylation was also shown to depend on ADR1 at this promoter [35].
Fig. 6.
Analysis of chromatin remodelling at the ADH2 promoter in wild type and snf1 deletion strains. (A) Nystatin treated spheroplasts from wild type and snf1 cells growing in repressing (R = 3% glucose) or derepressing (0.05% glucose, for 30 min and 3 h) conditions were digested with MN (0.6 and 1.2 units 400 ml−1 for each condition). After secondary digestion with HindIII restriction enzyme the samples were transferred to a nitrocellulose filter and hybridized with a probe 3' (see Material and methods). Nucleosomes are represented by ovals. M, molecular weight marker, 1 kb plus DNA ladder (Invitrogen); nfr, nucleosome free region; RIS, RNA Initiation Sites. (B) Northern analysis of ADH2 mRNA accumulation. Total RNA was prepared from aliquots of cells growing in repressing (R = 3% glucose) or derepressing (0.05% glucose, for 30 min, 1 h, 2 h, 3 h, 4 h, 5 h, and 6 h) conditions. 25S and 18S indicate the two major yeast rRNA species.
We conclude that a major role of Snf1 is to control chromatin structure and function at glucose-repressed promoters, and whether this role is played directly or through the activity of DNA binding factors apparently depends on the specific promoter architecture.
3.7 Snf1 is required to recruit Gcn5 at the ADY2 promoter
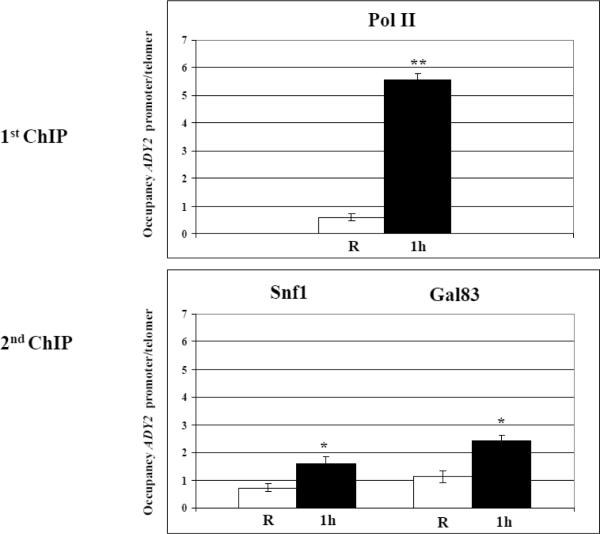
In order to understand the mechanism by which Snf1 regulates histone H3 acetylation and chromatin remodelling at the ADY2 promoter, we asked whether Snf1 plays any role in recruitment of co-activators or co-repressors such as Gcn5 or Rpd3. We have already shown that both enzymes regulate ADY2 mRNA accumulation [35]. First we analysed Snf1 occupancy at the ADY2 promoter region, by performing a ChIP with anti HA antibodies to detect either Snf1-HA or its nuclear regulatory subunit, Gal83-HA, in the corresponding tagged strains. The signal was very weak for both Snf1 and Gal83 at the ADY2 promoter (data not shown). To enrich for chromatin bound Snf1, we performed an initial ChIP with a specific antibody to the PolII enzyme and subsequent re-ChIP with anti HA antibodies to detect either Snf1-HA or Gal83-HA. The results are shown in Fig. 7: when the glucose content in the medium is lowered to 0.05% (derepressing conditions) for 1 h, occupancy of Snf1, Gal83, and PolII increases at the ADY2 promoter, indicating that these factors are involved in the assembly of an activating complex that should be able to both remodel chromatin and initiate mRNA synthesis.
Fig. 7.
Analysis of Snf1, Gal83 and PolII occupancy at the ADY2 promoter. Chromatin immunoprecipitation was performed with Snf1-HA (KBY100) and Gal83-HA (KBY98) tagged strains. Cells were collected in repressing conditions (R = 3% glucose) and at 1 h after the shift to derepressing conditions (0.05% glucose). Cross-linked protein–DNA complexes were immunoprecipitated using first antibody against PolII enzyme (1st ChIP), followed by immunoprecipitation with antibody against HA (2nd ChIP). DNA was amplified by real-time PCR using primer pairs as described in Material and methods. Histograms show the occupancy of each protein at the ADY2 promoter relative to a control telomeric sequence, both in repressing (white) and derepressing (black) conditions. Error bars indicate the standard deviation of data obtained from 3 biological replicates of samples. *p<0.05; **p<0.001
The increase in occupancy for these factors was also demonstrated at two other Snf1-dependent promoters, ADH2 and ACS1 (Supplementary Fig. S1 and Fig. S2).
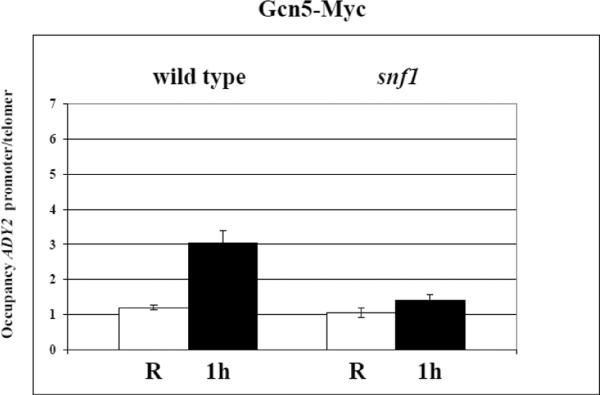
Next, we analysed by anti c-myc antibodies the occupancy of Gcn5-myc and Rpd3-myc in both SNF1 and snf1 deletion mutant, and the results are shown in Fig. 8: when the cells are shifted to derepressing conditions (0.05% glucose) for 1 h, the occupancy of the acetyltransferase Gcn5 at the ADY2 promoter strongly increases in the SNF1 strain, whereas in the snf1 deletion mutant no increase is observed, indicating a role of Snf1 in the recruitment of this histone acetylating enzyme.
Fig. 8.
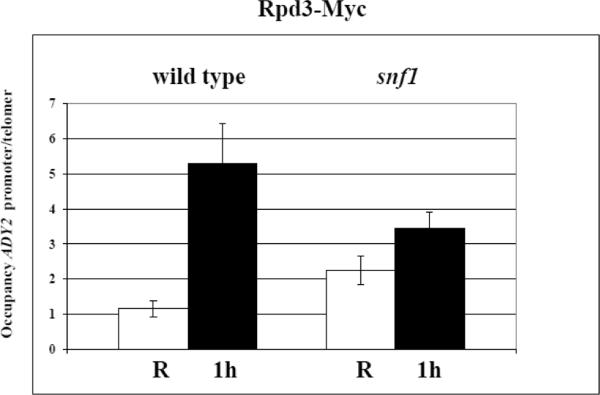
Analysis of Gcn5 and Rpd3 occupancy at the ADY2 promoter. (A) Chromatin immunoprecipitation was performed with Gcn5-myc tagged SNF1 and snf1 deletion mutant strains (KBY95 and KBY105, respectively). Cells were collected in repressing conditions (R = 3% glucose) and at 1 h after the shift to derepressing conditions (0.05% glucose). Cross-linked protein–DNA complexes were immunoprecipitated using antibody against c-myc. DNA was amplified by real-time PCR using primer pairs as described in Material and methods. Histograms show the occupancy of each protein at the ADY2 promoter relative to a control telomeric sequence, both in repressing (white) and derepressing (black) conditions. Error bars indicate the standard deviation of data obtained from 3 biological replicates of samples. (B) Chromatin immunoprecipitation was performed as in (A) except with Rpd3-myc tagged SNF1 and snf1 deletion mutant strains (KBY97 and KBY107, respectively).
In the same conditions, the occupancy of the deacetylase Rpd3 increases in the SNF1 strain, and this effect is still observed, although less pronounced, in the snf1 deletion mutant, suggesting Snf1-independent recruitment of this histone deacetylating enzyme in derepressing conditions. The same results were obtained with two additional Snf1-dependent promoters, ADH2 and ACS1 (Supplementary Fig. S3 and S4).
We conclude that the mechanism by which Snf1 plays its role in the control of histone acetylation and chromatin remodelling at the glucose-repressed ADY2 promoter, is exerted at the level of recruitment of the histone acetyltransferase Gcn5.
4. Discussion
Chromatin modifications play a crucial role in the activation of gene expression in response to external stimuli [38], including nutrient availability [39]. Relevant molecular events taking place at the promoter level are due to the combined effects of nucleosome positioning signals, ATP-dependent nucleosome remodellers, post-translational modifications and histone variants exchange, allowing activator binding and/or repressor removal [40].
Yeast cells obtain energy through fermentation of sugars such as glucose or galactose, or through oxidation of a variety of fermentation products, such as glycerol or ethanol [39]. The Snf1 protein kinase complex is primarily required for the adaptation of yeast cells to glucose limitation, but also affects cellular processes, such as ageing, meiosis, and pseudohyphal growth [8]. Many different mechanistic roles were assigned to Snf1, including phosphorylation and translocation of the Mig1 repressor [10,11], interaction with the activator Sip4 [12], phosphorylation and activation of Cat8 [13, 14], regulation of the binding of the activator Adr1 [15], and interaction with the transcriptional apparatus [16,17].
Interestingly, the Snf1 protein kinase was shown to drive histone acetylation at the INO1 promoter [18], and more recently to regulate Gcn5 transcriptional activity [19]. Nevertheless, a direct involvement of Snf1 in the control of chromatin structure has not been previously reported. We therefore investigated the phenotypic consequences of SNF1 deletion on the glucose-regulated ADY2 promoter during activation, and found that the absence of Snf1 impairs the remodelling occurring at the TATA box-containing nucleosome −1 and ATG containing nucleosome +1, by completely abolishing the increase in H3 acetylation observed in the wild type.
Our results reveal that, in the absence of both Adr1 and Cat8, H3 acetylation and remodelling can occur, suggesting that at this particular promoter Snf1 plays a prominent role in the control of chromatin structure and function, whereas the two transcription factors are required to recruit or stabilise transcription initiation complex components, such as PolII and TBP as previously shown [36].
In the case of the well characterised ADH2 promoter, Snf1 was shown to be required for Adr1 binding to chromatin [15], and Adr1 was in turn found to be responsible for the increase in H3 acetylation and remodelling at −1 and +1 nucleosomes in derepressing conditions [35,37]. Therefore, at the ADH2 promoter Snf1 regulates chromatin structure through the activity of Adr1, whereas in the case of ADY2, Snf1 presumably plays a more direct role.
We think that the specific promoter architecture of each gene is a key element in determining the exact mechanism of transcription activation. Promoter chromatin organisation is strictly dependent on nucleosome positioning that in turn is influenced by intrinsic DNA sequence features [41,42]. In addition to these sequence determinants, binding of various protein complexes [43] contributes to the shaping of each specific promoter, and as a consequence to the requirements of activators and co-activators necessary, as proposed [36,44]. The different localisation of histone variants could also have a role: for example, histone H2A.Z is present in the promoter nucleosomes −1 and +1 in the case of ADH2, whereas in the case of ADY2 it is found in the coding region at the level of nucleosomes +1, +2, +4 and +7 [45,46].
The results obtained at the ADY2 promoter provide the opportunity to better understand the mechanism by which Snf1 regulates chromatin function. Since we know that the catalytic activity of the acetyltransferase Gcn5 is required for the ADY2 promoter H3 acetylation increase in derepressing conditions [35], we hypothesize that one relevant target of Snf1 activity is Gcn5 itself, and that this protein kinase is required for the recruitment of Gcn5 (or the whole SAGA complex), as demonstrated in the case of HTX2 and HTX4 promoters [47]. By demonstrating that Snf1 plays a role in the recruitment of the histone acetyltransferase Gcn5 (Fig. 8A), we propose that this is the main mechanism by which Snf1 regulates histone acetylation and chromatin remodelling at the glucose-repressed ADY2 promoter. Moreover, we show Snf1-independent recruitment of the histone deacetylase Rpd3 in derepressing conditions (Fig. 8B): we think that the increased occupancy of Rpd3 at the ADY2 promoter during activation, coupled with the loss of Gcn5 recruitment, are actually responsible for the complete loss of histone H3 acetylation in the snf1 deletion mutant. Rpd3 activity was already shown to influence chromatin structure and transcription at Snf1-dependent promoters, including ADY2, by using histone deacetylase deletion mutant [35,48,49]. Interestingly, Rpd3 was shown to regulate transcriptional activation of other genes, such as DNA damage-inducible genes, presumably by orchestrating multiple rounds of transcription [50]. The fact that Rpd3 occupancy in the snf1 mutant under repressed conditions appears enhanced relative to wild type, could be the consequence of a genome-wide re-distribution of chromatin regulatory protein complexes among promoters in the absence of stimuli [43].
Since we show that Snf1 occupancy increases concomitantly with the shift to derepressing conditions, one question that needs to be answered is how does Snf1 get to the ADY2 promoter without being recruited by an activator. One possibility is that glucose signalling to chromatin initially involves recruitment of remodelling complexes, such as SWI/SNF, causing a change in chromatin conformation which allows increased occupancy of the Snf1 complex during activation. One alternative challenging possibility entails a reverse recruitment mechanism involving re-localization of the Snf1 complex to the nuclear periphery as shown for another glucose repressed gene [51].
Recently, Snf1 was shown to regulate Gcn5 transcriptional activity by removing the inhibition caused by Spt3 at the HIS3 promoter [19]. SPT3 encodes a subunit of SAGA, and was shown to either activate or inhibit transcription of some RNA polymerase II-dependent genes, by functionally interacting with several factors including the TATA-binding protein, Mot1, and the Not complex [52–55]. As a whole, these lines of evidence support a model in which TBP is the critical target of transcriptional regulation by Spt3. Therefore, the function of Snf1 in promoting Gcn5-dependent histone acetylation at the ADY2 promoter could be aimed at modifying nucleosome accessibility to facilitate dynamic and productive TBP interaction with the TATA box.
Snf1 could also affect histone acetylation by an independent pathway, involving metabolism: by inhibiting Acetyl Coenzyme A Carboxylase, a key enzyme catalyzing the entry into lipid metabolism [56,57], activation of Snf1 in low glucose conditions could keep high the acetyl CoA content, thus stimulating the activity of Gcn5 and other HATs.
Finally, a recent report points to a direct role of mammalian AMPK in stress-promoted transcription via histone H2B phosphorylation [58]. It will be interesting to determine whether this epigenetic modification is conserved in yeast by Snf1-dependent stress-induced transcription.
Supplementary Material
Highlights
The main role of Snf1 is to control chromatin structure and function
The specific promoter architecture of each gene is a key element in determining the exact mechanism of transcription activation.
Cell metabolism is controlled by epigenetic mechanisms
Acknowledgements
We thank Colin R. Goding and Ernesto Di Mauro for critical reading of the manuscript, and Marco La Fortezza for advice regarding statistical analysis. This work was supported by Ateneo, by MURST-CNR Progetto Genomica Funzionale, by FIRB, and by NIH grant GM26079 to ETY.
Footnotes
Publisher's Disclaimer: This is a PDF file of an unedited manuscript that has been accepted for publication. As a service to our customers we are providing this early version of the manuscript. The manuscript will undergo copyediting, typesetting, and review of the resulting proof before it is published in its final citable form. Please note that during the production process errors may be discovered which could affect the content, and all legal disclaimers that apply to the journal pertain.
REFERENCES
- [1].Usaite R, Jewett MC, Oliveira AP, Yates JR, 3rd, Olsson L, Nielsen J. Reconstruction of the yeast Snf1 kinase regulatory network reveals its role as a global energy regulator. Mol. Syst. Biol. 2009;5:319. doi: 10.1038/msb.2009.67. [DOI] [PMC free article] [PubMed] [Google Scholar]
- [2].DeRisi JL, Iyer VR, Brown PO. Exploring the metabolic and genetic control of gene expression on a genomic scale. Science. 1997;278:680–686. doi: 10.1126/science.278.5338.680. [DOI] [PubMed] [Google Scholar]
- [3].Gancedo JM. The early steps of glucose signalling in yeast. FEMS Microbiol. Rev. 2008;32:673–704. doi: 10.1111/j.1574-6976.2008.00117.x. [DOI] [PubMed] [Google Scholar]
- [4].Schüller H-J. Trancriptional control of nonfermetative metabolism in the yeast Saccharomyces cerevisiae. Curr. Genet. 2003;43:139–160. doi: 10.1007/s00294-003-0381-8. [DOI] [PubMed] [Google Scholar]
- [5].Papamichos-Chronakis M, Gligoris T, Tzamarias D. The Snf1 kinase controls glucose repression in yeast by modulating interactions between the Mig1 repressor and the Cyc8-Tup1 co-repressor. EMBO Reports. 2004;5:368–372. doi: 10.1038/sj.embor.7400120. [DOI] [PMC free article] [PubMed] [Google Scholar]
- [6].Gancedo JM. Yeast carbon catabolite repression. Microbiol. Mol. Biol. Rev. 1998;62:334–361. doi: 10.1128/mmbr.62.2.334-361.1998. [DOI] [PMC free article] [PubMed] [Google Scholar]
- [7].Carlson M. Glucose repression in yeast. Curr. Opin. Microbiol. 1999;2:202–207. doi: 10.1016/S1369-5274(99)80035-6. [DOI] [PubMed] [Google Scholar]
- [8].Hedbacker K, Carlson M. SNF1/AMPK pathways in yeast. Front. Biosci. 2008;13:2408–2420. doi: 10.2741/2854. [DOI] [PMC free article] [PubMed] [Google Scholar]
- [9].Hong SP, Carlson M. Regulation of Snf1 protein kinase in response to environmental stress. J. Biol. Chem. 2007;282:16838–16845. doi: 10.1074/jbc.M700146200. [DOI] [PubMed] [Google Scholar]
- [10].Treitel MA, Kuchin S, Carlson M. Snf1 protein kinase regulates phosphorylation of the Mig1 repressor in Saccharomyces cerevisiae. Mol. Cell. Biol. 1998;18:6273–6280. doi: 10.1128/mcb.18.11.6273. [DOI] [PMC free article] [PubMed] [Google Scholar]
- [11].Ostling J, Ronne H. Negative control of the Mig1p repressor by Snf1-dependent phosphorylation in the absence of glucose. Eur. J. Biochem. 1998;252:162–168. doi: 10.1046/j.1432-1327.1998.2520162.x. [DOI] [PubMed] [Google Scholar]
- [12].Lesage P, Yang X, Carlson M. Yeast Snf1 protein kinase interacts with Sip4, a C6 zinc cluster transcriptional activator: a new role for Snf1 in the glucose response. Mol. Cell. Biol. 1996;16:1921–1928. doi: 10.1128/mcb.16.5.1921. [DOI] [PMC free article] [PubMed] [Google Scholar]
- [13].Randez-Gil F, Bojunga N, Proft M, Entian KD. Glucose derepression of gluconeogenic enzymes in Saccharomyces cerevisiae correlates with phosphorylation of the gene activator Cat8p. Mol. Cell. Biol. 1997;17:2502–2510. doi: 10.1128/mcb.17.5.2502. [DOI] [PMC free article] [PubMed] [Google Scholar]
- [14].Charbon G, Breunig KD, Wattiez R, Vandenhaute J, Noel-Georis I. Key role of Ser562/661 in Snf1-dependent regulation of Cat8p in Saccharomyces cerevisiae and Kluyveromyces lactis. Mol. Cell. Biol. 2004;24:4083–4091. doi: 10.1128/MCB.24.10.4083-4091.2004. [DOI] [PMC free article] [PubMed] [Google Scholar]
- [15].Young ET, Kacherovsky N, van Riper K. Snf1 protein kinase regulates Adr1 binding to chromatin but not transcription activation. J. Biol. Chem. 2002;277:38095–38103. doi: 10.1074/jbc.M206158200. [DOI] [PubMed] [Google Scholar]
- [16].Kuchin S, Treich I, Carlson M. A regulatory shortcut between the Snf1 protein kinase and RNA polymerase II holoenzyme. Proc. Natl. Acad. Sci. USA. 2000;97:7916–7920. doi: 10.1073/pnas.140109897. [DOI] [PMC free article] [PubMed] [Google Scholar]
- [17].Shirra MK, Rogers SE, Alexander DE, Arndt K. The Snf1 protein kinase and Sit4 protein phosphatase have opposing functions in regulating TATA-binding protein association with the Saccharomyces cerevisiae INO1 promoter. Genetics. 2005;169:1957–1972. doi: 10.1534/genetics.104.038075. [DOI] [PMC free article] [PubMed] [Google Scholar]
- [18].Lo WS, Duggan L, Emre NC, Belotserkovskya R, Lane WS, Shiekhattar R, Berger SL. Snf1 a histone kinase that works in concert with the histone acetyltransferase Gcn5 to regulate transcription. Science. 2001;293:1142–1146. doi: 10.1126/science.1062322. [DOI] [PubMed] [Google Scholar]
- [19].Liu Y, Xu X, Kuo MH. Snf1p regulates Gcn5p transcriptional activity by antagonizing Spt3p. Genetics. 2010;184:91–105. doi: 10.1534/genetics.109.110957. [DOI] [PMC free article] [PubMed] [Google Scholar]
- [20].Ratnakumar S, Kacherovsky N, Arms E, Young ET. Snf1 controls the activity of Adr1 through dephosphorylation of Ser230. Genetics. 2009;182:735–745. doi: 10.1534/genetics.109.103432. [DOI] [PMC free article] [PubMed] [Google Scholar]
- [21].Ratnakumar S, Young ET. Snf1 dependence of peroxisomal gene expression is mediated by Adr1. J. Biol Chem. 2010;285:10703–10714. doi: 10.1074/jbc.M109.079848. [DOI] [PMC free article] [PubMed] [Google Scholar]
- [22].Van Driessche B, Tafforeau L, Hentges P, Carr AM, Vandenhaute J. Additional vectors for PCR-based gene tagging in Saccharomyces cerevisiae and Schizosaccharomyces pombe using nourseothricin resistance. Yeast. 2005;22:1061–1068. doi: 10.1002/yea.1293. [DOI] [PubMed] [Google Scholar]
- [23].Knop M, Siegers K, Pereira G, Zachariae W, Winsor B, Nasmyth K, Schiebel E. Epitope tagging of yeast genes using a PCR-based strategy: more tags and improved practical routines. Yeast. 1999;15:963–972. doi: 10.1002/(SICI)1097-0061(199907)15:10B<963::AID-YEA399>3.0.CO;2-W. [DOI] [PubMed] [Google Scholar]
- [24].Güldener U, Heck S, Fielder T, Beinhauer J, Hegemann JH. A new efficient gene disruption cassette for repeated use in budding yeast. Nucleic Acids Res. 1996;24:2519–2524. doi: 10.1093/nar/24.13.2519. [DOI] [PMC free article] [PubMed] [Google Scholar]
- [25].Schmitt ME, Brown TA, Trumpower BL. A rapid and simple method for preparation of RNA from Saccharomyces cerevisiae. Nucleic Acids Res. 1990;18:3091–3092. doi: 10.1093/nar/18.10.3091. [DOI] [PMC free article] [PubMed] [Google Scholar]
- [26].Hecht A, Grunstein M. Mapping DNA interaction sites of chromosomal proteins using immunoprecipitation and polymerase chain reaction. Meth. Enzymol. 1999;304:399–414. doi: 10.1016/s0076-6879(99)04024-0. [DOI] [PubMed] [Google Scholar]
- [27].Schmittgen TD, Livak KJ. Analyzing real-time PCR data by the comparative C(T) method. Nat. Protoc. 2008;3:1101–1108. doi: 10.1038/nprot.2008.73. [DOI] [PubMed] [Google Scholar]
- [28].Pfaffl MW. A new mathematical model for relative quantification in real-time RT–PCR. Nucleic Acids Res. 2001;29:2002–2007. doi: 10.1093/nar/29.9.e45. [DOI] [PMC free article] [PubMed] [Google Scholar]
- [29].Wu C. The 5' ends of Drosophila heat shock genes in chromatin are hypersensitive to DNase I. Nature. 1980;286:854–860. doi: 10.1038/286854a0. [DOI] [PubMed] [Google Scholar]
- [30].Venditti S, Camilloni G. In vivo analysis of chromatin following nystatin-mediated import of active enzymes into Saccharomyces cerevisiae. Biochem. Biophys. Acta. 1994;1219:677–689. doi: 10.1007/BF00277353. [DOI] [PubMed] [Google Scholar]
- [31].Verdone L, Cesari F, Denis CL, Di Mauro E, Caserta M. Factors affecting Saccharomyces cerevisiae ADH2 chromatin remodeling and transcription. J. Biol. Chem. 1997;272:30828–30834. doi: 10.1074/jbc.272.49.30828. 1997. [DOI] [PubMed] [Google Scholar]
- [32].Young ET, Dombek KM, Tachibana C, Ideker T. Multiple pathways are co-regulated by the protein kinase Snf1 and the transcription factors Adr1 and Cat8. J. Biol. Chem. 2003;278:26146–26158. doi: 10.1074/jbc.M301981200. [DOI] [PubMed] [Google Scholar]
- [33].Paiva S, Devaux F, Barbosa S, Jacq C, Casal M. ADY2p is essential for the acetate permease activity in the yeast Saccharomyces cerevisiae. Yeast. 2004;21:201–210. doi: 10.1002/yea.1056. [DOI] [PubMed] [Google Scholar]
- [34].Agricola E, Verdone L, Xella B, Di Mauro E, Caserta M. Common chromatin architecture, common chromatin remodeling and common transcription kinetics of ADR1-dependent genes in Saccharomyces cerevisiae. Biochemistry. 2004;43:8878–8884. doi: 10.1021/bi049577+. [DOI] [PubMed] [Google Scholar]
- [35].Agricola E, Verdone L, Di Mauro E, Caserta M. H4 acetylation does not replace H3 acetylation in chromatin remodeling and transcription activation of ADR1-dependent genes. Molecular Microbiology. 2006;62:1433–1446. doi: 10.1111/j.1365-2958.2006.05451.x. [DOI] [PubMed] [Google Scholar]
- [36].Biddick RK, Law GL, Young ET. Adr1 and Cat8 mediate coactivator recruitment and chromatin remodeling at glucose-regulated genes. PLoS One. 2008;3:e1436. doi: 10.1371/journal.pone.0001436. [DOI] [PMC free article] [PubMed] [Google Scholar]
- [37].Verdone L, Camilloni G, Di Mauro E, Caserta M. Chromatin remodeling during Saccharomyces cerevisiae ADH2 gene activation. Mol. Cell Biol. 1996;16:1978–1988. doi: 10.1128/mcb.16.5.1978. [DOI] [PMC free article] [PubMed] [Google Scholar]
- [38].Weake VM, Workman JL. Inducible gene expression: diverse regulatory mechanisms. Nat Rev Genet. 2010;11:426–437. doi: 10.1038/nrg2781. [DOI] [PubMed] [Google Scholar]
- [39].Zaman S, Lippman SI, Zhao X, Broach JR. How Saccharomyces responds to nutrients. Annu Rev Genet. 2008;42:27–81. doi: 10.1146/annurev.genet.41.110306.130206. [DOI] [PubMed] [Google Scholar]
- [40].Henikoff S. Nucleosome destabilization in the epigenetic regulation of gene expression. Nat Rev Genet. 2008;9:15–26. doi: 10.1038/nrg2206. [DOI] [PubMed] [Google Scholar]
- [41].Caserta M, Agricola E, Churcher M, Hiriart E, Verdone L, Di Mauro E, Travers A. A translational signature for nucleosome positioning in vivo. Nucleic Acids Res. 2009;37:5309–5321. doi: 10.1093/nar/gkp574. [DOI] [PMC free article] [PubMed] [Google Scholar]
- [42].Travers A, Hiriart E, Churcher M, Caserta M, Di Mauro E. The DNA sequence-dependence of nucleosome positioning in vivo and in vitro. J. Biomol. Struct. Dyn. 2010;27:713–724. doi: 10.1080/073911010010524942. [DOI] [PMC free article] [PubMed] [Google Scholar]
- [43].Venters BJ, Wachi S, Mavrich TN, Andersen BE, Jena P, Sinnamon AJ, Jain P, Rolleri NS, Jiang C, Hemeryck-Walsh C, Pugh BF. A comprehensive genomic binding map of gene and chromatin regulatory proteins in Saccharomyces. Mol. Cell. 2011;41:480–492. doi: 10.1016/j.molcel.2011.01.015. [DOI] [PMC free article] [PubMed] [Google Scholar]
- [44].Biddick RK, Law GL, Chin KK, Young ET. The transcriptional coactivators SAGA, SWI/SNF, and mediator make distinct contributions to activation of glucose-repressed genes. J. Biol. Chem. 2008;283:33101–33109. doi: 10.1074/jbc.M805258200. [DOI] [PMC free article] [PubMed] [Google Scholar]
- [45].Albert I, Mavrich TN, Tomsho LP, Qi J, Zanton SJ, Schuster SC, Pugh BF. Translational and rotational settings of H2A.Z nucleosomes across the Saccharomyces cerevisiae genome. Nature. 2007;446:572–576. doi: 10.1038/nature05632. [DOI] [PubMed] [Google Scholar]
- [46].Ioshikhes IP, Albert I, Zanton SJ, Pugh BF. Nucleosome positions predicted through comparative genomics. Nat. Genet. 2006;38:1210–1215. doi: 10.1038/ng1878. [DOI] [PubMed] [Google Scholar]
- [47].van Oevelen CJ, van Teeffelen HA, van Werven FJ, Timmers HT. Snf1p-dependent Spt-Ada-Gcn5-acetyltransferase (SAGA) recruitment and chromatin remodeling activities on the HXT2 and HXT4 promoters. J. Biol. Chem. 2006;281:4523–4531. doi: 10.1074/jbc.M509330200. [DOI] [PubMed] [Google Scholar]
- [48].Verdone L, Wu J, van Riper K, Kacherovsky N, Vogelauer M, Young ET, Grunstein M, Di Mauro E, Caserta M. Hyperacetylation of chromatin at the ADH2 promoter allows Adr1 to bind in repressed conditions. EMBO J. 2002;21:1101–1111. doi: 10.1093/emboj/21.5.1101. [DOI] [PMC free article] [PubMed] [Google Scholar]
- [49].Tachibana C, Biddick R, Law GL, Young ET. A poised initiation complex is activated by SNF1. J. Biol. Chem. 2007;282:37308–37315. doi: 10.1074/jbc.M707363200. [DOI] [PubMed] [Google Scholar]
- [50].Sharma VM, Tomar RS, Dempsey AE, Reese JC. Histone deacetylases RPD3 and HOS2 regulate the transcriptional activation of DNA damage-inducible genes. Mol. Cell. Biol. 2007;27:3199–3210. doi: 10.1128/MCB.02311-06. [DOI] [PMC free article] [PubMed] [Google Scholar]
- [51].Sarma NJ, Haley TM, Barbara KE, Buford TD, Willis KA, Santangelo GM. Glucose-responsive regulators of gene expression in Saccharomyces cerevisiae function at the nuclear periphery via a reverse recruitment mechanism. Genetics. 2007;175:1127–1135. doi: 10.1534/genetics.106.068932. [DOI] [PMC free article] [PubMed] [Google Scholar]
- [52].Eisenmann DM, Arndt KM, Ricupero SL, Rooney JW, Winston F. Spt3 interacts with TFIID to allow normal transcription in Saccharomyces cerevisiae. Genes Dev. 1992;6:1319–1331. doi: 10.1101/gad.6.7.1319. [DOI] [PubMed] [Google Scholar]
- [53].Collart MA. The NOT, SPT3, and MOT1 genes functionally interact to regulate transcription at core promoters. Mol. Cell. Biol. 1996;16:6668–6676. doi: 10.1128/mcb.16.12.6668. [DOI] [PMC free article] [PubMed] [Google Scholar]
- [54].Belotserkovskaya R, Sterner DE, Deng M, Sayre MH, Lieberman PM, Berger SL. Inhibition of TATA-binding protein function by SAGA subunits Spt3 and Spt8 at Gcn4-activated promoters. Mol. Cell. Biol. 2000;20:634–647. doi: 10.1128/mcb.20.2.634-647.2000. [DOI] [PMC free article] [PubMed] [Google Scholar]
- [55].Mohibullah N, Hahn S. Site-specific cross-linking of TBP in vivo and in vitro reveals a direct functional interaction with the SAGA subunit Spt3. Genes Dev. 2008;22:2994–3006. doi: 10.1101/gad.1724408. [DOI] [PMC free article] [PubMed] [Google Scholar]
- [56].Woods A, Munday MR, Scott J, Yang X, Carlson M, Carling D. Yeast Snf1 is functionally related to mammalian AMP-activated protein kinase and regulates acetyl-CoA carboxylase in vivo. J. Biol. Chem. 1994;269:19509–19515. [PubMed] [Google Scholar]
- [57].Shirra MK, Patton-Vogt J, Ulrich A, Liuta-Tehlivets O, Kohlwein SD, Henry SA, Arndt KM. Inhibition of acetyl coenzyme A carboxylase activity restores expression of the INO1 gene in a snf1 mutant strain of Saccharomyces cerevisiae. Mol. Cell. Biol. 2001;21:5710–5722. doi: 10.1128/MCB.21.17.5710-5722.2001. [DOI] [PMC free article] [PubMed] [Google Scholar]
- [58].Bungard D, Fuerth BJ, Zeng PY, Faubert B, Maas NL, Viollet B, Carling D, Thompson CB, Jones RG, Berger SL. Signaling kinase AMPK activates stress-promoted transcription via histone H2B phosphorylation. Science. 2010;329:1201–1205. doi: 10.1126/science.1191241. [DOI] [PMC free article] [PubMed] [Google Scholar]
Associated Data
This section collects any data citations, data availability statements, or supplementary materials included in this article.


