

Abstract
Candidates with hepatocellular carcinoma (HCC) within Milan criteria receive standardized Model for End-Stage Liver Disease (MELD) exception points due to the projected risk of tumor expansion beyond Milan criteria, meant to be equivalent to a 15% risk of 90-day mortality from listing, with additional points every 3 months, equivalent to a 10% increased mortality risk. We analyzed the United Network for Organ Sharing database from 1/1/05–5/31/09 to compare 90-day waitlist outcomes of HCC vs. non-HCC candidates with similar MELD scores. 259 (4.2%) HCC candidates initially listed with 22 MELD exception points were removed for death or clinical deterioration within 90 days of listing vs. 283 (11.0%) non-HCC candidates with initial laboratory MELD scores of 21–23. 93 (4.6%) HCC candidates with 25 exception points (after 3–6 months wait-time) were removed for death or clinical deterioration within 90 days vs. 805 (17.3%) non-HCC candidates with laboratory MELD scores of 24–26. 20 (3.0%) HCC candidates with 28 exception points (after 6–9 months wait-time) were removed for death or clinical deterioration within 90 days vs. 646 (23.6%) non-HCC candidates with laboratory MELD scores of 27–29. In multivariable logistic regression models, HCC candidates had a significantly lower 90-day odds of waitlist removal for death or clinical deterioration (P<0.001). Over time, the risk of waitlist removal for death or clinical deterioration was unchanged for HCC candidates (P=0.17), while it increased significantly for non-HCC candidates. The current allotment of HCC exception points should be reevaluated given the stable risk of waitlist dropout for these candidates.
Keywords: Exception points, waitlist dropout, patient survival
Background
Since February 27th, 2002, the United Network for Organ Sharing (UNOS) has relied on the Model for End Stage Liver Disease (MELD) to prioritize candidates listed for liver transplantation in the United States. Initially developed and validated to predict 90-day waitlist mortality from the time of initial listing, the MELD score has subsequently been shown to accurately predict 90-day waitlist mortality for candidates throughout their time on the waitlist.1–6
There are candidates for whom the risk of waitlist removal for death or clinical deterioration is not adequately captured by the MELD score, including candidates with extra-hepatic manifestations of liver disease such as hepatopulmonary syndrome, metabolic liver disease, and most notably, candidates with hepatocellular carcinoma (HCC). For these conditions where MELD does not address the perceived and/or actual clinical risk, policymakers have instituted standardized criteria and algorithms by which candidates receive MELD exception points.7
Candidates with HCC whose tumors are within the Milan criteria (MC; either one tumor <5 cm or 3 tumors each less than 3 cm) receive standardized MELD exception points. When MELD allocation was initiated, there was agreement that mortality was not the appropriate endpoint for HCC candidates but rather tumor expansion beyond the MC that would necessitate dropout from the waitlist. As a result, candidates with HCC within MC and with T2 lesions were assigned 29 points at initial listing with incremental points granted every 3 months corresponding to a 10% increase in waitlist dropout. The initial point allocation was decreased to 24 in April 2003 and 22 in January 2005. Both of these decreases occurred as it was noted that the allocated MELD score did not correlate to the risk of waitlist dropout for these candidates. There have however been no further changes in the allocation of incremental exception points over time. The current policy states that an HCC candidate with tumor within MC may receive an exception MELD score, “equivalent to a 15% probability of candidate death within 3 months,” with 3 additional points given every 3 months, “equivalent to a 10% increase in candidate mortality.”7
Two recent publications have addressed the issue of differences in waitlist mortality between HCC vs. non-HCC candidates, and have demonstrated that non-HCC candidates have a greater risk of waitlist dropout.8,9 However, these studies did not specifically address the systematic upgrades in exception points based on waiting time, which is an issue that remains unresolved.
The goal of this study was to explore the appropriate designation of exception points for HCC candidates by: a) comparing the 90-day waitlist outcomes of candidates with an initial HCC exception score of 22 to non-HCC candidates with a similar initial MELD score; b) determining if HCC candidates with MELD exception scores of 22 have a 15% risk of waitlist dropout; c) determining if HCC candidates with MELD exception scores of 25 and 28 in fact have a 25% and 35% risk, respectively, of waitlist dropout; and d) comparing 90-day waitlist outcomes between HCC candidates with MELD exception scores of 25 and 28 vs. non-HCC candidates with similar MELD scores.
Methods
Study population
Analyses were based on data from the Organ Procurement and Transplantation Network (OPTN) UNOS database as of May 31, 2009. We included all adults (age ≥18) listed for initial liver transplantation between January 1, 2005 and May 31, 2009. January 1, 2005 marked the implementation date for the current MELD allocation policy. The HCC group included all candidates who received exception points for T2 stage HCC (within MC) according to the current exception policy. The non-HCC cohort included all candidates without a diagnosis of HCC, after excluding candidates with any other approved non-HCC exception. This enabled a comparison of HCC candidates to those with comparable laboratory MELD scores. All status 1 candidates were excluded.
Outcome
The primary outcome was waitlist removal for death or clinical deterioration within 90 days. This endpoint included all candidates removed with the code of “died,” in addition to those removed because they were “too sick” or “medically unsuitable.” We considered candidates removed from the waitlist due to clinical deterioration as equivalent to those who died because chronic liver disease is almost uniformly fatal without transplantation. Such grouping is consistent with prior research.10,11 Death on the waitlist, excluding clinical deterioration, was evaluated as a secondary outcome.
For the cohort of candidates evaluated from the time of initial listing, the 90-day outcome was determined from the date of receipt of 22 MELD exception points for HCC candidates, or from listing for non-HCC candidates. For the analyses of HCC and non-HCC candidates who had already been listed, 90 days was determined from the time of receipt of additional HCC exception points (MELD of 25 and 28) for HCC candidates, or 90 days from the updated MELD score (MELD 24–26 or MELD 27–29; see ‘MELD categories’ below) for non-HCC candidates.
The current analysis utilized the binary outcome of waitlist removal (yes/no) within 90 days for death or clinical deterioration rather than the time to waitlist removal, because the MELD score is meant to predict 90-day waitlist mortality. Also, because HCC candidates are granted additional MELD exception points every 3 months, we wanted to determined the 90-day risk of waitlist removal for HCC candidates after receipt of 22, 25, or 28 exception points.
MELD Categories
All HCC candidates listed with 22 MELD exception points were compared to all non-HCC candidates listed with an initial laboratory MELD score of 21–23. A comparison group of non-HCC candidates with a calculated MELD of 21–23 at listing was chosen, because if the HCC exception MELD accurately predicts 90-day waitlist survival from initial listing, these two groups would be expected to have similar 90-day risks of waitlist removal for death or clinical deterioration. A MELD range of 21–23 was chosen, as limiting analysis solely to non-HCC candidates with calculated MELD score of 22 resulted in a sample size substantially smaller than the HCC cohort (N=877). To ensure a lack of selection bias in the non-HCC group, a secondary analysis was conducted to compare candidates with 22 HCC MELD exception points to all non-HCC candidates with a MELD score of 21–23, regardless of initial MELD score. This demonstrated a similar 90-day risk of waitlist removal or death as the analysis with non-HCC candidates with an initial laboratory MELD score of 21–23 (data not shown).
Ninety day outcomes for HCC candidates with MELD scores of 25 and 28 were also compared to non-HCC candidates with MELD scores of 24–26, and 27–29, respectively. The non-HCC cohorts included all candidates with MELD scores of 24–26 and 27–29, regardless of the initial MELD score (see flow sheet in Figure 1). This is exemplified by a candidate who first enters the waitlist with a MELD score of 14, but subsequently escalates to a MELD score of 25. This candidate would have the same expected 90-day mortality as one who first enters the waitlist with a different MELD score but who also subsequently arrives at a MELD of 25.1 Candidates with laboratory MELD scores of 24–26 and 27–29 at any point in time on the waitlist were chosen to enable a comparison between non-HCC candidates and HCC candidates with equivalent MELD scores and, thus, similar predicted risks of waitlist removal for death or clinical deterioration. Non-HCC candidates could have a calculated MELD score of 24–26 or 27–29 at more than one point in time. Therefore, within each MELD category (MELD 24–26 and MELD 27–29), we included only the first time point at which the MELD score met the criteria for that stratum.
Figure 1.

Flowsheet describing non-HCC candidates included in study
To ensure that candidate outcomes were not included in more than one MELD category (i.e. a candidate listed with a MELD of 21 on 1/1/06, whose MELD increased to 25 on 2/1/06, and who died on 3/1/06, thus dying within 90 days of the MELD score of both 21 and 25), non-HCC candidates were included in a subsequent category only if they remained on the waitlist for more than 90 days after inclusion in the preceding category (i.e. a candidate listed with a MELD of 21, with a subsequent increase to 24 would only be included in the 24–26 cohort if the MELD of 24 listing date was at least 90 days after the MELD 21 listing date).
Statistical Analysis
Characteristics of HCC and non-HCC candidates were compared using Fisher’s exact tests and chi-square tests for dichotomous variables and two-sample t tests or Wilcoxon rank-sum tests for continuous variables. Chi-square tests were used to compare the unadjusted 90-day risk of removal for death or clinical deterioration for HCC versus non-HCC candidates within each MELD category as well as among HCC candidates in the three different MELD categories. Student t-tests compared MELD scores at waitlist removal for HCC and non-HCC candidates. For comparisons of outcomes after waitlist removal, we utilized data from the Social Security Death Master File that was included in the OPTN/UNOS dataset, updated as of March 14, 2011. For candidates removed from the waitlist for clinical deterioration, Wilcoxon rank-sum tests were used to compare the average time between waitlist removal and actual death. As a supplementary analysis, chi-square tests were used to determine if the 90-day risk of waitlist removal for death or clinical deterioration for HCC candidates listed with a MELD score of 22 was similar to non-HCC candidates with initial MELD scores of less than 21.
Logistic regression models were used to determine whether the odds of waitlist removal for death or clinical deterioration within 90 days of listing differed between HCC and non-HCC candidates. Separate models were fit to compare HCC candidates with exception MELD scores of 22, 25, and 28 to non-HCC candidates with MELD scores of 21–23, 24–26, and 27–29, respectively. Adjustment variables were selected for inclusion if they were independently associated with the outcome (P<0.05), if their removal from the model changed the coefficient for HCC by ≥10%, or for clinical validity. Variables tested using these criteria included recipient age at listing, gender, race/ethnicity, blood type, and insurance type (private or public). We included fixed effects for UNOS region to account for unobserved heterogeneity in the risk of waitlist removal across regions and to account for any correlation due to clustering of candidates within regions.12
Unadjusted post-transplant recipient survival among HCC liver recipients was compared with log-rank testing. All analyses were conducted using Stata 11.13
This study received exempt review from the Institutional Review Board at the University of Pennsylvania.
Results
Initial Listings
Between January 1, 2005 and May 31, 2009 6,246 candidates were listed with T2 HCC exception points. Demographics and primary diagnoses of HCC and non-HCC cohorts are displayed in Table 1. Compared to non-HCC candidates, HCC candidates were older (P<0.001), more likely to be male (P<0.001), and more likely to be white (P<0.001) or Asian (P<0.001). The primary diagnoses of the HCC cohorts compared to each of the non-HCC cohorts differed. Based on the UNOS primary diagnosis codes, HCC candidates were less likely to have alcoholic, non-alcoholic steatohepatitis/cryptogenic, and cholestatic cirrhosis. While 28.7% (1793/6246) of HCC candidates were listed with HCC as the primary diagnosis without clear specification of background liver disease etiology, 863 (48.1%) were positive for HCV antibody. Including these candidates with HCC patients coded as having HCV as the primary diagnosis yields 3,526 (56.5%) of HCC patients as having HCV, a significantly greater proportion than the non-HCC cohort.
Table 1.
Patient demographics characteristics and primary diagnosis
| HCC Candidates | Non-HCC Candidates | |||
|---|---|---|---|---|
| MELD 22 (N=6,246) | MELD 21–23 (N=2,564) | MELD 24–26 (N=4,655) | MELD 27–29 (N=2,737) | |
| Age at listing, years, Mean ± SD | 56.5 ± 7.5 | 52.6 ± 9.9 | 53.1 ± 9.5 | 52.9 ± 9.6 |
| Male gender, N (%) | 4,817 (77.1) | 1,700 (66.3) | 3,017 (64.8) | 1,747 (63.8) |
| Race/Ethnicity, N (%) | ||||
| White | 4,087 (65.4) | 1,790 (69.8) | 3,325(71.4) | 1,901 (69.5) |
| Hispanic | 913 (14.6) | 378 (14.7) | 735 (15.8) | 466 (17.0) |
| Black | 533 (8.5) | 299 (11.7) | 432 (9.3) | 247 (9.0) |
| Asian | 643 (10.3) | 73 (2.8) | 123 (2.6) | 87 (3.2) |
| Other* | 69 (1.1) | 24 (0.9) | 40(0.9) | 36 (1.3) |
| Bloodtype, N(%) | ||||
| O | 2,923 (46.8) | 1,224 (47.7) | 2,260 (48.5) | 1,363 (49.8) |
| A | 2,316 (37.1) | 935 (36.5) | 1,790 (38.4) | 1,014 (37.1) |
| B | 783 (12.5) | 304 (11.9) | 500 (10.8) | 285 (10.4) |
| AB | 224 (3.6) | 101 (3.9) | 105 (2.3) | 75 (2.7) |
| Private insurance, N (%) | 3,977 (63.7) | 1,492 (58.2) | 2,805 (60.4) | 1,655 (60.5) |
| Primary diagnosis, N (%) | ||||
| Hepatitis C | 2,663 (42.6) | 892 (34.8) | 1,711 (36.8) | 997 (36.4) |
| Hepatocellular carcinoma | 1,793 (28.7) | 0 (0.0) | 0 (0.0) | 0 (0.0) |
| Alcoholic | 454 (7.3) | 562 (21.9) | 836 (18.0) | 507 (18.5) |
| NASH/Cryptogenic | 371 (5.9) | 395 (15.4) | 707 (15.2) | 389 (14.2) |
| Hepatitis B | 291 (4.7) | 55 (2.1) | 75 (1.6) | 65 (2.4) |
| Cholestatic | 100 (1.6) | 180 (7.0) | 401 (8.6) | 202 (7.4) |
| Metabolic/Autoimmune | 114 (1.8) | 148 (5.8) | 217 (4.7) | 126 (4.6) |
| Other | 460 (7.4) | 332 (12.9) | 708 (15.2) | 451 (16.5) |
Includes patients with ethnicity defined as Hawaiian, Native American, or Multi-racial
Waitlist Mortality
Figure 2 depicts the rates of waitlist removal for death or clinical deterioration within 90 days for candidates with and without HCC among the three MELD categories. 259/6,246 (4.2%) HCC candidates listed with 22 exception points were removed from the waitlist for death or clinical deterioration within 90 days of listing, compared with 283/2,564 (11.0%) of non-HCC candidates with an initial MELD score of 21–23. Similar data were obtained when all non-HCC candidates with a MELD score of 21–23, regardless of initial MELD score, were analyzed (data not shown). Of HCC candidates with a MELD score of 25, 93/2,009 (4.6%) were removed from the waitlist for death or clinical deterioration within 90 days, compared with 805/4,655 (17.3%) non-HCC candidates with a MELD score of 24–26. Lastly, 20/675 (3.0%) HCC candidates with a MELD score of 28 were removed from the waitlist for death or clinical deterioration within 90 days, compared with 646/2,737 (23.6%) of non-HCC candidates with a MELD score of 27–29.
Figure 2.

Percentage of patients that died or were removed due to being too sick within 90 days
The risk of death alone differed between HCC and non-HCC candidates (P<0.001) within each MELD stratum (2.0% vs. 7.6% for MELD 22/21–23, P<0.001; 2.1% vs. 11.4% for MELD 25/24–26, P <0.001; 1.3% vs. 15.6% for MELD 28/27–29, P<0.001). However, the risk of death alone for HCC candidates with exception MELD scores of 22, 25, and 28 were statistically similar (2.0% vs. 2.1% vs. 1.3%; P=0.42).
In the HCC cohorts, the proportion of waitlist removals for death equaled that for clinical deterioration (2.0% vs. 2.2%, P=0.49 for MELD 22; 2.1% vs. 2.5%, P=0.46 for MELD 25; 1.3% vs. 1.7%, P=0.65 for MELD 28). Conversely, in each of the non-HCC MELD cohorts, the proportion of waitlist removals for death was approximately twice that for clinical deterioration (7.6% vs. 3.4%, P<0.001 for MELD 21–23; 11.4% vs. 5.9%, P<0.001 for MELD 24–26; 15.6% vs. 8.0%, P<0.001 for MELD 27–29).
There was regional variability in the 90-day rates of waitlist removal for death or clinical deterioration among HCC and non-HCC cohorts (Supplementary Figure 1). Variability was similar among the HCC MELD 22 and 25 cohorts but was much more pronounced among the non-HCC cohorts.
Among HCC candidates that were removed for death or clinical deterioration, the mean laboratory MELD score at removal was 22.4 ± 10.2, and was similar across all three MELD categories. However, among non-HCC candidates, the MELD score at removal increased from 29.2 ± 7.7 for the MELD 21–23 cohort, to 31.9 ± 9.0 for the MELD 24–26 cohort, and finally to 32.2 ± 6.5 for the 27–29 cohort. Among HCC candidates removed for death or clinical deterioration, the laboratory MELD score at removal was higher than the exception MELD score in 106/257 (41.2%), 22/93 (23.7%), and 5/20 (25.0%) candidates in the MELD 22, 25, and 28 strata, respectively.
Among the HCC and non-HCC waitlist candidates in each MELD strata removed for clinical deterioration, a similar proportion in each group subsequently died during follow-up. However, in each MELD stratum, HCC candidates survived longer after delisting than non-HCC candidates (Table 2). Survival, provided in median (interquartile range) days was median (IQR): 27 (3–187) vs. 2 (1–14) days, P<0.001 for MELD 22 vs. MELD 21–23; 87 (8–202) vs. 3 (1–13) days, P<0.001 for MELD 25 vs. MELD 24–26; and 32.5 (1–175) vs. 1 (0–6) days, P=0.016 for MELD 28 vs. MELD 27–29.
Table 2.
Percent of removals due to clinical deterioration during follow-up and time to death
| Category | N* | Died during follow-up, N (%) | Days from delisting to death, Median (IQR) | P-Value† |
|---|---|---|---|---|
| HCC MELD 22 | 134 | 114 (85.1) | 27 (3–187) | <0.001 |
| Non-HCC MELD 21–23 | 91 | 74 (81.3) | 2 (1–14) | |
|
| ||||
| HCC MELD 25 | 50 | 43 (86.0) | 87 (8–202) | <0.001 |
| Non-HCC MELD 24–26 | 274 | 245 (89.4) | 3 (1–13) | |
|
| ||||
| HCC MELD 28 | 12 | 12 (100.0) | 32.5 (1–175) | 0.016 |
| Non-HCC MELD 27–29 | 220 | 192 (87.3) | 1 (0–6) | |
N= number of candidates removed due to being too sick or medically unsuitable
Wilcoxon rank-sum test comparing number of days from delisting to death between HCC and non-HCC within each MELD category
To explore if waitlist dropout risk for HCC candidates varied according to initial listing laboratory MELD scores, we stratified HCC candidates into laboratory MELD score ≥15 versus <15.14 Candidates with a laboratory MELD score ≥15 at initial listing had a higher 90-day risk of removal for death or clinical deterioration (8.4% vs. 2.5%, P<0.001 for MELD 22 cohort; 7.8% vs. 3.6%, P<0.001 for MELD 25 cohort; 5.2% vs. 2.3%, P=0.06 for MELD 28 cohort). However, comparing all candidates with initial laboratory MELD score of ≥15, waitlist dropout risk for non-HCC candidates remained higher than the HCC candidates.
Multivariable analysis
In univariable regression models, all recipient variables tested, except for blood type, were significantly associated with the risk of 90-day waitlist removal for death or clinical deterioration. Nevertheless, blood type was included in multivariable models given the potential association with the outcome of interest.15 In the multivariable regression models assessing 90-day survival of HCC candidates, each of the other independent variables tested (age at listing, gender, race/ethnicity, insurance) were significantly associated with the odds of waitlist removal for death or clinical deterioration within 90 days.
Table 3 provides unadjusted and adjusted odds ratios comparing 90-day waitlist removal for death or clinical deterioration between HCC and non-HCC candidates within each MELD stratum. The adjusted odds of waitlist removal were substantially and consistently lower for HCC candidates compared non-HCC candidates, and decreased with increased MELD score (MELD 22: OR=0.32, 95% CI: 0.27–0.39; MELD 25: OR=0.21, 95% CI: 0.17–0.27; MELD 28: OR=0.09, 95% CI:(0.05–0.14. Similar results were obtained examining 90-day waitlist removal for death alone.
Table 3.
Odds ratios comparing 90-day waitlist mortality or removal due to clinical deterioration between HCC and non-HCC candidates with in each MELD category
| Variable | Reference Group | Unadjusted Odds Ratio (95% CI) | Adjusted Odds Ratio (95% CI)* | P-Value |
|---|---|---|---|---|
| HCC MELD 22 | Non-HCC MELD 21–23 | 0.35 (0.29–0.41) | 0.32 (0.27–0.39) | <0.001 |
| HCC MELD 25 | Non-HCC MELD 24–26 | 0.23 (0.19–0.29) | 0.21 (0.17–0.27) | <0.001 |
| HCC MELD 28 | Non-HCC MELD 27–29 | 0.10 (0.06–0.16) | 0.09 (0.05–0.14) | <0.001 |
Multivariable model adjusted for recipient age at listing, gender, race/ethnicity, blood type, and insurance status (private vs. public), treating UNOS region as a fixed effect
Transplantation for HCC and non-HCC Candidates
Transplantation rates within 90 days were higher for each of the non-HCC cohorts, when compared to the HCC cohorts with similar MELD scores, with increasing rates correlating with increasing MELD scores (data not shown). Median donor risk index, mean donor age, and use of donation after cardiac (DCD) organs were similar among all six groups of patients. There was an increased use of regionally shared organs in the non-HCC MELD 24–26 and 27–29, when compared with their respective HCC cohorts (data not shown). Across the three HCC cohorts, a similar proportion of patients were transplanted with laboratory MELD scores <15 (65.0–70.5%), 15–21 (23.7–28.3%), and >22 (5.8–7.7%).
Post-Transplant Outcomes for HCC Candidates with MELD Exception Points of 22, 25, and 28
Among HCC candidates who were transplanted, post-transplant patient survival did not differ among the three MELD strata (p-value for log-rank test=0.21; table 4 and figure 3). At end of follow-up, 465 (16.5%), 161 (17.1%), and 48 (13.1%) HCC transplant recipients with exception MELD scores of 22, 25, and 28, respectively, died. Causes of graft failure are not well coded to determine the risk of recurrent HCC in transplanted patients. Although the risk of post-transplant mortality was higher for non-HCC recipients compared to HCC transplant recipients in the corresponding MELD category, the time to death was longer among for non-HCC recipients (data not shown).
Table 4.
Post-Transplant Outcomes of HCC Recipients
| Exception MELD at transplant | Alive at follow-up N (%)* |
Died during follow-up N (%)* |
Days to death, Median (IQR) |
|---|---|---|---|
| HCC MELD 22, N=2,822† | 2,145 (76.0) | 465 (16.5) | 282(94–604) |
| HCC MELD 25, N=944‡ | 730 (77.3) | 161 (17.1) | 237 (113–548) |
| HCC MELD 28, N=367** | 294 (80.1) | 48 (13.1) | 179 (26–585) |
P=0.20 comparing proportion died vs. alive between 3 MELD groups
78 with incomplete follow-up status
19 with incomplete follow-up status
10 with incomplete follow-up status
Figure 3.
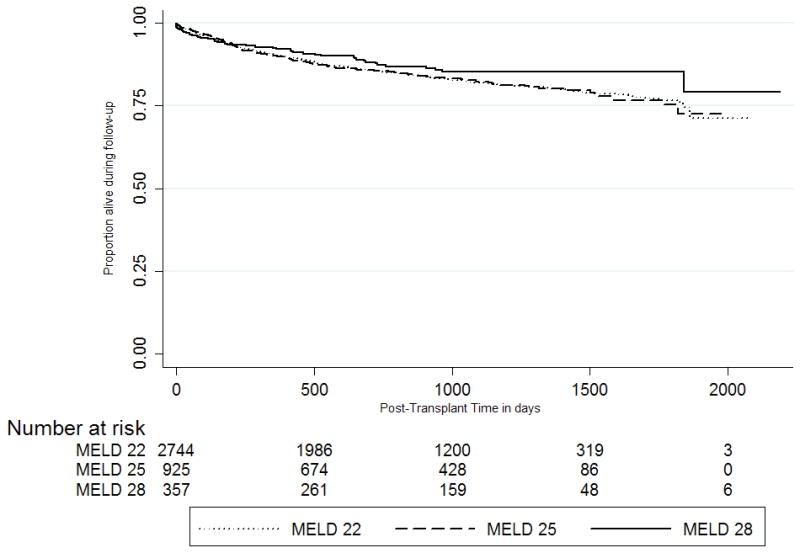
Post-Transplant Survival of HCC Recipients within Milan Criteria
Risk of Waitlist Removal for HCC MELD 22 Candidates versus Non-HCC MELD <21 Candidates
We compared the 90-day risk of waitlist removal for death or clinical deterioration for HCC candidates with an initial MELD of 22 compared to four strata of non-HCC candidates, all with initial MELD scores of less than 21 (Table 5). Compared to non-HCC candidates with MELD scores of <15, 15–16, 17–18, and 19–20, unadjusted 90-day risks of waitlist removal for death or clinical deterioration for HCC MELD 22 patients were most comparable to those of non-HCC candidates with an initial MELD score of 15–16 (90-day risk of removal for death or clinical deterioration 4.2% for HCC MELD 22 vs. 4.1% for non-HCC MELD 15–16).
Table 5.
Risk of death or removal due to clinical deterioration among HCC and non-HCC candidates with MELDs of 6–20 at the time of listing
| Category | Died/removed within 90 days N (%)* |
Died/removed while on waitlist N (%)† |
|---|---|---|
| HCC MELD 22 patients | 259 (4.2) | 637 (10.2) |
| Non-HCC patients‡ | ||
| MELD <15, N=12,570 | 277 (2.0) | 1,719 (13.7) |
| MELD 15–16, N=3,548 | 146 (4.1) | 590 (16.6) |
| MELD 17–18, N=2,894 | 166 (5.7) | 486 (16.8) |
| MELD 19–20, N=2,164 | 185 (8.6) | 378 (17.5) |
90-day death/removal defined as removal due to death or clinical deterioration within 90 days from listing
Defined as removal due to death or clinical deterioration during the entire period of time a candidate is on the waitlist
MELD score is the calculated MELD score at the time of initial listing
Discussion
We have shown that under the current allocation policy, the odds of waitlist removal for death or clinical deterioration have been significantly lower for HCC than for non-HCC candidates. The observed differences increase steeply as the analysis progresses from low to high MELD strata. These results not only reinforce previous work that has questioned the initial MELD exception points bestowed upon HCC candidates within MC, but newly challenge the incremental MELD exception points granted at three month intervals. Our data suggest that neither the initially nor the incrementally awarded MELD exception points for HCC accurately reflect the risk of waitlist removal for HCC candidates, particularly when juxtaposed against non-HCC candidates.
The current MELD allocation system is based on principles set forth by the Department of Health and Human Services in 1998 that organ allocation policy should be based on medical urgency.16 The Institute of Medicine resoundingly echoed this sentiment one year later with their recommendation to eliminate waiting time as an allocation criterion. Allocation policy should ensure equitable access to organs based on candidates’ medical characteristics and disease prognoses, rather than waiting times.3,17 Our analyses show that the current allocation policy, as it pertains to HCC candidates relative to non-HCC candidates, fails in both regards.
Although OPTN policy states that the initial 22 MELD exception points allocated to HCC candidates is meant to be equivalent to a 15% probability of waitlist dropout within 3 months, the data do not support this contention.7 Only 4.2% of HCC candidates with T2 stage HCC tumors listed at a MELD score of 22 are removed from the waitlist within 90 days due to death or clinical deterioration, compared with 11.0% of non-HCC candidates with MELD scores of 21–23. While the data presented here are similar to those of by Washburn et al, the two studies differ in that Washburn compared HCC candidates to all non-HCC candidates, regardless of MELD score8. Massie et al recently reported similar data as well. However, their HCC comparator group included all HCC candidates with 22 MELD exception points, and not only those within MC. From January 1, 2005 to March 23, 2011, 7,360 HCC candidates within MC were accepted for 22 MELD exception points. An additional 1,034 (14.0%) were categorized per UNOS coding criteria as “HCC not meeting criteria (with the “exception diagnosis code” of 3, categorizing “HCC not meeting criteria,” but the “exception HCC code” as a yes), yet received 22 MELD exception points through a petition to a regional review board. These candidates, who were presumably outside of Milan criteria, were not included in our analysis. This difference may explain the higher waitlist dropout rate reported in by Massie and colleagues. 9
We extended our analyses of HCC vs. non-HCC candidates to provide a novel assessment of the differences in risk of waitlist removal for HCC candidates with 25 and 28 MELD exception points, both to each other, and to non-HCC candidates with comparable laboratory MELD scores.
The magnitude of the difference in the risk of death between HCC vs. non-HCC candidates is staggering, especially at the higher levels of MELD. With increasing MELD scores, the risk of waitlist removal was stable for HCC candidates (4.6% for MELD 25 vs. 3.0% for MELD 28), while it increased significantly for non-HCC candidates (17.3% for MELD 24–26 and 23.6% for MELD 27–29). The additional exception points granted to HCC candidates every three months are meant to reflect the increasing risk of tumor extension beyond acceptable MC boundaries, with the number of points meant to reflect a 10% increase in the risk of waitlist dropout.7 The data we present clearly contradict the notion that waitlist dropout secondary to tumor progression increases over time. Point increases in the calculated MELD score directly correspond to a natural log increase in the risk of death. The fact that waitlist dropout for HCC does not escalate in the same manner calls into question the entire premise of granting exception MELD points to HCC candidates. Beyond waitlist removal, for HCC candidates delisted for clinical deterioration rather than death, survival after waitlist removal was significantly longer than that of non-HCC candidates.
Despite similar listing MELD scores, candidates with HCC consistently have lower laboratory MELD scores (13.2 vs. 22.0 for MELD 22/21–23, 13.1 vs. 24.8 for MELD 25/24–26, and 13.2 vs. 27.8 for MELD 28/27–29). The fact that the proportion of waitlist removals is stable across the three cohorts of HCC candidates, while it increases significantly for the non-HCC candidates suggests that the risk of waitlist removal is directly related to the severity of the underlying liver disease rather than tumor progression. Further support for this concept is the fact that the 90-day risk of waitlist removal for death or clinical deterioration is similar for HCC candidates listed with 22 exception points and non-HCC candidates listed with a laboratory MELD score of 15–16.
Although additional exception points are given to HCC candidates based on waiting time due to the concern for tumor progression, deeper consideration of the current MELD exception point policies were created in an era when locoregional therapy for HCC was not as widespread, and have not been altered despite evidence that these therapies have decreased waitlist dropout rates.18–20 Current locoregional strategies have been shown to improve survival of patients with HCC, both within and beyond MC. Among patients with HCC who are not transplant candidates and receive only locoregional therapy, those with a radiographic response have a median survival of two years.21 Furthermore, recent Italian data has demonstrated that candidates with T2 stage tumors who responded to locoregional therapy had a lower risk of waitlist dropout and decreased post-transplant HCC recurrence.20 This correlation between response to therapy and post-transplant HCC recurrence likely explains our finding that post-transplant survival of HCC recipients transplanted with 22, 25, and 28 exception points is similar with recurrence risk related more to therapy response than waiting time. Waitlist mortality for HCC candidates decreases with rising exception score, which correlates to longer wait-times. The available data does not support a definitive rationale for this finding. While the observation may be due to more favorable tumor biology, an alternative explanation is that these candidates receive additional locoregional therapies as they accrue exception points. Altogether, there is compelling evidence that current policies of automatic, incremental upgrades in exception points must be thoroughly reevaluated.
Our study has several limitations. Use of the OPTN/UNOS database limited the data elements available for covariate adjustments. However, the OPTN/UNOS database has not only been used for prior research evaluating this question, but also is used in the design and alteration of allocation policy. For our outcome definition, we are relying on the outcomes of HCC candidates under the current allocation system. We are unable to determine their risk of death or clinical deterioration had they not been given the same exception points. While it is theoretically possible that, had they not received exception points, fewer HCC candidates would have undergone transplantation and more HCC candidates would have been removed from the waitlist for death or clinical deterioration, it is unlikely that this explains the results we see. Given the magnitude of the difference in the risk of death of HCC versus non-HCC candidates, the risk of death for HCC candidates who were transplanted would have had to be substantially larger than that of non-HCC candidates who were transplanted to alter our current results. Our analyses focused only on candidates’ 90-day outcomes from single point in time. Although this has the potential to introduce time-dependent misclassification bias, a candidate’s current MELD score is the single most important determinant of mortality risk on the waiting list.1,9 Moreover, our goal was to evaluate the 90-day risk of waitlist dropout for HCC candidates from the time of receiving exception points to determine the appropriateness of current policies.1,9 We do not have data on the impact of locoregional therapies, which directly correlates with survival, and could help to stratify candidates with HCC for exception points.21 UNOS provides some data on whether candidates received locoregional therapy, but detailed data on number of treatments, and success of treatments is limited. Lastly, while we can compare post-transplant survival across the three HCC MELD cohorts, we cannot evaluate for differences in recurrent HCC, as this data is not reliably coded in OPTN/UNOS data.
In conclusion, our data suggest that HCC candidates have substantially lower odds of waitlist removal for death or clinical deterioration than non-HCC candidates across the broad range of MELD scores. The initial allocation of 22 MELD exception points to HCC candidates is too high, based on their actual risk of 90-day waitlist dropout from listing. The steep increase in risk differential between HCC and non-HCC patients within higher MELD strata (25 and 28) challenges the notion that increased waiting time for HCC candidates is associated with an increased risk of waitlist dropout justifying systematic addition of acceptance points every three months. These data highlight the urgent need to reconsider the equitable treatment of HCC and non-HCC patients by our national allocation policy. Although the intention of bestowing HCC exception points to accurately reflect the risk of waitlist removal for tumor expansion beyond acceptable listing criteria appears eminently reasonable, practice has demonstrated that the risk has been grossly over-estimated. Without question, certain HCC candidates merit exception points, but other factors, including response to loco-regional therapy, severity of underlying liver disease, and regional access to transplantation must be taken into account. While future research is planned to determine optimal allocation policies for HCC candidates relative to non-HCC candidates, our data strongly indicates that the current allotment of exception points for HCC should be lowered.
Supplementary Material
Acknowledgments
Grants/Support
National Institutes of Health (grant 1-F32-DK-089694-01 from the National Institute of Diabetes and Digestive and Kidney Diseases) (David Goldberg)
Health Resources and Services Administration (contract 234-2005-370011C). The contents are the responsibility of the authors alone and do not necessarily reflect the views or policies of the Department of Health and Human Services, nor does mention of trade names, commercial products, or organizations imply endorsement by the US Government.
Abbreviations
- HCC
Hepatocellular carcinoma
- UNOS
United Network for Organ Sharing
- MELD
Model for End-Stage Liver Disease
- MC
Milan criteria
- OPTN
Organ Procurement and Transplantation Network
Footnotes
Disclosure: The authors have no conflict of interest as it pertains to this manuscript.
References
- 1.Bambha K, Kim WR, Kremers WK, et al. Predicting survival among patients listed for liver transplantation: an assessment of serial MELD measurements. Am J Transplant. 2004 Nov;4(11):1798–1804. doi: 10.1111/j.1600-6143.2004.00550.x. [DOI] [PubMed] [Google Scholar]
- 2.Kamath PS, Kim WR. The model for end-stage liver disease (MELD) Hepatology. 2007 Mar;45(3):797–805. doi: 10.1002/hep.21563. [DOI] [PubMed] [Google Scholar]
- 3.Kamath PS, Wiesner RH, Malinchoc M, et al. A model to predict survival in patients with end-stage liver disease. Hepatology. 2001 Feb;33(2):464–470. doi: 10.1053/jhep.2001.22172. [DOI] [PubMed] [Google Scholar]
- 4.Leise MD, Kim WR, Kremers WK, Larson JJ, Benson JT, Therneau TM. A revised model for end-stage liver disease optimizes prediction of mortality among patients awaiting liver transplantation. Gastroenterology. 2011 Jun;140(7):1952–1960. doi: 10.1053/j.gastro.2011.02.017. [DOI] [PMC free article] [PubMed] [Google Scholar]
- 5.Malinchoc M, Kamath PS, Gordon FD, Peine CJ, Rank J, ter Borg PC. A model to predict poor survival in patients undergoing transjugular intrahepatic portosystemic shunts. Hepatology. 2000 Apr;31(4):864–871. doi: 10.1053/he.2000.5852. [DOI] [PubMed] [Google Scholar]
- 6.Wiesner R, Edwards E, Freeman R, et al. Model for end-stage liver disease (MELD) and allocation of donor livers. Gastroenterology. 2003 Jan;124(1):91–96. doi: 10.1053/gast.2003.50016. [DOI] [PubMed] [Google Scholar]
- 7.http://optn.transplant.hrsa.gov/PoliciesandBylaws2/policies/pdfs/policy_8.pdf.
- 8.Washburn K, Edwards E, Harper A, Freeman R. Hepatocellular carcinoma patients are advantaged in the current liver transplant allocation system. Am J Transplant. 2010 Jul;10(7):1643–1648. doi: 10.1111/j.1600-6143.2010.03127.x. [DOI] [PubMed] [Google Scholar]
- 9.Massie AB, Caffo B, Gentry SE, et al. MELD Exceptions and Rates of Waiting List Outcomes. Am J Transplant. 2011 Sep 15; doi: 10.1111/j.1600-6143.2011.03735.x. [DOI] [PMC free article] [PubMed] [Google Scholar]
- 10.Moylan CA, Brady CW, Johnson JL, Smith AD, Tuttle-Newhall JE, Muir AJ. Disparities in liver transplantation before and after introduction of the MELD score. JAMA. 2008 Nov 26;300(20):2371–2378. doi: 10.1001/jama.2008.720. [DOI] [PMC free article] [PubMed] [Google Scholar]
- 11.Austin MT, Poulose BK, Ray WA, Arbogast PG, Feurer ID, Pinson CW. Model for end-stage liver disease: did the new liver allocation policy affect waiting list mortality? Arch Surg. 2007 Nov;142(11):1079–1085. doi: 10.1001/archsurg.142.11.1079. [DOI] [PubMed] [Google Scholar]
- 12.French B, Heagerty PJ. Analysis of longitudinal data to evaluate a policy change. Stat Med. 2008 Oct 30;27(24):5005–5025. doi: 10.1002/sim.3340. [DOI] [PMC free article] [PubMed] [Google Scholar]
- 13.StataCorp. Stata Statistical Software: Release 11. College Statiom, TX: StataCorp LP; 2010. [Google Scholar]
- 14.Berg CL, Merion RM, Shearon TH, et al. Liver transplant recipient survival benefit with living donation in the model for endstage liver disease allocation era. Hepatology. 2011 Oct;54(4):1313–1321. doi: 10.1002/hep.24494. [DOI] [PMC free article] [PubMed] [Google Scholar]
- 15.http://srtr.org/csr/current/NatPublic201106/pdf/LI201106.pdf.
- 16.Anonymous. Organ Procurment and Transplantation Network--HRSA. Final rule with comment period. Federal Register. 1998;63:16296–16338. [PubMed] [Google Scholar]
- 17.Medicine Io; Committee on Organ Procurement and Transplantation policy. Organ Procurement and Transplantion: Assessing Current Policies and the Potential Impact of the DHHS FInal Rule. Washington, DC: National Academy Press; 1999. Analysis of waiting times; pp. 57–78. [PubMed] [Google Scholar]
- 18.Golfieri R, Cappelli A, Cucchetti A, et al. Efficacy of selective transarterial chemoembolization in inducing tumor necrosis in small (<5 cm) hepatocellular carcinomas. Hepatology. 2011 May;53(5):1580–1589. doi: 10.1002/hep.24246. [DOI] [PubMed] [Google Scholar]
- 19.Otto G, Herber S, Heise M, et al. Response to transarterial chemoembolization as a biological selection criterion for liver transplantation in hepatocellular carcinoma. Liver Transpl. 2006 Aug;12(8):1260–1267. doi: 10.1002/lt.20837. [DOI] [PubMed] [Google Scholar]
- 20.Cucchetti A, Cescon M, Bigonzi E, et al. Priority of candidates with hepatocellular carcinoma awaiting liver transplantation can be reduced after successful bridge therapy. Liver Transpl. 2011 Nov;17(11):1344–1354. doi: 10.1002/lt.22397. [DOI] [PubMed] [Google Scholar]
- 21.Memon K, Kulik L, Lewandowski RJ, et al. Radiographic response to locoregional therapy in hepatocellular carcinoma predicts patient survival times. Gastroenterology. 2011 Aug;141(2):526–535. e522. doi: 10.1053/j.gastro.2011.04.054. [DOI] [PMC free article] [PubMed] [Google Scholar]
Associated Data
This section collects any data citations, data availability statements, or supplementary materials included in this article.