

Abstract
Background
Adolescents with a family history of alcoholism (FHP) are at risk for developing an alcohol use disorder (AUD), and some studies indicate that FHP individuals show deficits in executive functioning. The ability to make adaptive decisions is one aspect of successful executive functioning that is often measured during risk-taking tasks; however, this behavior has not been examined in FHP youth. Since impaired decision-making could predispose FHP youth to make poor choices related to alcohol use, the current study examined the neural substrates of risk-taking in FHP adolescents and their family history negative (FHN) peers.
Methods
Thirty-one (18 FHP, 13 FHN) youth between 13-15 years old were included in this study. All youth had used little to no alcohol prior to study involvement. Functional magnetic resonance imaging was used to examine the neural substrates of risk-taking during the Wheel of Fortune (WOF) decision-making task (Ernst et al., 2004) in FHP and FHN youth.
Results
FHP youth did not differ from FHN youth in risk-taking behavior, but showed less brain response during risky decision-making in right dorsolateral prefrontal cortex and right cerebellar regions compared to FHN peers.
Conclusions
Despite no behavioral differences on the WOF decision-making task, FHP youth exhibited atypical neural response during risk-taking compared to FHN peers. Atypical brain activity, in regions implicated in executive functioning could lead to reduced cognitive control, which may result in risky choices regarding alcohol use. This could help explain the higher rates of AUDs seen in FHP adolescents. Further examination of risky behavior and associated brain response over the course of adolescence is necessary to characterize the vulnerabilities of FHP youth in the absence of alcohol abuse.
Keywords: fMRI, Risk-taking, Alcoholism, Adolescence, Family History
1. Introduction
Adolescents with a family history of alcoholism (FHP) are at risk for developing an alcohol use disorder (AUD) (Dawson et al., 1992). Previous studies have reported atypical behavior (Herting et al., 2010), brain structure (Hanson et al., 2010; Hill et al., 2007), and brain functioning (Herting et al., 2011; Schweinsburg et al., 2004; Spadoni et al., 2008) in largely alcohol-naïve FHP youth, indicating that the vulnerability for developing an AUD in these youth may be associated with abnormal behavior and neural activity that underlie heritable aspects of an AUD. In particular, pre-morbid deficits in executive functioning may contribute to the development of an AUD (Harden and Pihl, 1995). Compared to their peers, FHP adolescents show deficits in behavioral inhibition (King et al., 2009), one aspect of executive functioning, and these impairments have been associated with the development of substance use disorders (Chapman et al., 2007). In addition, poorer executive functioning has also been linked to risky decision-making in alcohol-dependent individuals (Bechara et al., 2001). While a propensity towards risk-taking has been seen in FHP young adults (LaBrie et al., 2009) and alcohol-naïve rats selectively bred for high alcohol preference (Roman et al., 2007), it is unknown whether an attraction toward risky behavior may be present in FHP human adolescents, in the absence of alcohol abuse. Further, as some studies of FHP adolescents also include youth who have already initiated alcohol and/or substance use (King et al., 2009), reduced cognitive control may not be associated with family history status alone. This confound makes it difficult to dissociate the effects of alcohol and drugs from the contribution of family history of AUD on the brain.
While measureable behavioral differences are often absent between FHP and FHN youth (Schweinsburg et al., 2004; Silveri et al., 2011), numerous functional magnetic resonance imaging (fMRI) studies of executive functioning have reported atypical brain response in FHP adolescents compared to youth with negative family history (FHN), albeit with varying results. For example, during response inhibition, FHP youth have shown both weaker prefrontal (Schweinsburg et al., 2004) and enhanced prefrontal and anterior cingulate cortex (Silveri et al., 2011) activity, as well as atypical subcortical brain response (Heitzeg et al., 2010) compared to FHN youth. In addition, reduced default mode network activity during vigilance has also been shown in FHP youth (Spadoni et al., 2008). Recent evidence has suggested the presence of weaker fronto-cerebellar functional connectivity in FHP youth, circuitry known to play a role in cognitive control (Herting et al., 2011). While previous studies have examined reward anticipation in FHP adolescents and adults (Andrews et al., 2011; Bjork et al., 2008), only one study, of adults, has investigated brain response specifically during reward-based decision-making (Acheson et al., 2009). Thus, while many studies have found aberrant cognitive control-related brain activity in FHP youth, comparison of decision-making related behavior and brain response has not been made in FHP and FHN adolescents.
To fill this gap, we used a reward-based decision-making task to investigate risk-taking behavior and associated neural response in FHP and FHN youth. Based on higher rates of alcohol-related risk-taking in FHP young adults (LaBrie et al., 2009), we predicted that FHP youth would make more risky choices on the decision-making task than FHN youth. Furthermore, we were interested in examining cognitive control-related brain circuitry needed for adaptive decision-making, which includes the lateral prefrontal cortex (PFC) (Vanderhasselt et al., 2009). We hypothesized that even in the absence of alcohol abuse, FHP youth would show less lateral PFC activity during risky decision-making compared to their peers, which would be indicative of reduced cognitive control. Furthermore, based on evidence for cerebellar involvement in decision-making processes (Blackwood et al., 2004; Ernst et al., 2004), and because abnormal cerebellar structure and functional connectivity has been implicated in risk for alcoholism (Herting et al., 2011; Hill et al., 2007), we predicted weaker cerebellar brain activity in FHP youth. Lastly, since reward-related brain regions, such as the ventromedial prefrontal cortex (vmPFC) appear to be important in behavioral self-regulation during risky decision-making tasks (Manes et al., 2002), and because decision-making deficits are associated with vmPFC dysfunction in heavy alcohol users (Bechara et al., 2001; Johnson et al., 2008), we further hypothesized that FHP youth would show less risk-taking activation in vmPFC, compared to FHN peers.
2. Materials and Methods
Participants
Adolescent participants (13-15 years old) were recruited throughout the local community. Specifically, 18 FHP (6 females) youth were recruited as part of an ongoing longitudinal study of at-risk youth, while 13 FHN (5 females) youth were recruited to match the at-risk sample on the demographic variables of interest. Following written assent and consent, participants and their parents were interviewed separately during a comprehensive telephone screen that included the Diagnostic Interview Schedule for Children Predictive Scales (Lucas et al., 2001), the Family History Assessment Module (FHAM) (Rice et al., 1995), the Brief Lifetime version of the Customary Drinking and Drug Use Record (Brown et al., 1998), and the Structured Clinical Interview (Brown et al., 1994). Exclusionary criteria included left handedness (Oldfield, 1971), DSM-IV psychiatric diagnoses, absence of family history information, serious medical problems, significant head trauma, mental retardation or learning disabilities, psychotic illness in a biological parent, prenatal exposure to drugs or alcohol, and MRI contraindications. In addition, no adolescents in the sample had ever engaged in heavy alcohol or substance use, as we excluded youth with > 10 lifetime alcoholic drinks or > 2 drinks on any occasion, > 5 uses of marijuana, any other drug use, or > 4 cigarettes per day. The study was approved by the Oregon Health & Science University (OHSU) Institutional Review Board.
Definition of Family History of Alcoholism
The FHAM was administered to both a biological parent and youth to assess whether first or second degree relatives of the adolescent participant met DSM-IV criteria for an AUD, as self-reports have been found to be a reliable way to determine familial alcohol or substance use (Andreasen et al., 1986). FHP adolescents were those with at least one biological parent with a history of alcohol abuse and/or dependence or those with two or more second degree relatives meeting this criterion on either the maternal or paternal side of the family. Categorizing individuals based on first or first and second degree relatives with an AUD has been shown to be a valid predictor of alcohol use vulnerability and future dependence (Stoltenberg et al., 1998). A complete absence of family history of AUD was required to categorize youth as FHN.
In the FHP group, family history density (FHD) was calculated for each participant based on the youth’s familial relatedness to the relative(s) with an AUD. Biological parents received a score of 0.5, grandparents a score of 0.25, while aunts and uncles with an AUD received a weighted ratio of 0.25/each, divided by the total number of aunts and uncles on the maternal or paternal side of the family in which the AUD was reported. This resulted in six FHP youth with FHD scores below 0.5. FHD scores in the FHP youth ranged from 0.06 to 1.00 with mean = 0.49 and standard deviation (SD) = 0.27.
fMRI task
To assess risk-taking and associated neural response, participants performed a modified version of the Wheel of Fortune (WOF) Task (Fig. 1), a two-choice computerized decision-making task described previously (Ernst et al., 2004). Briefly, during this task, participants chose between different probabilities of winning various monetary amounts. A participant’s choice that randomly matched the computer’s choice, based on the pre-defined probabilities, was a winning trial, while a choice that did not match the computer’s choice resulted in no win. Participants were instructed to try to win as much money as possible, because they would receive a portion of their earnings in the end. While in the fMRI scanner, participants performed 72 trials during two 10 minute runs of 36 trials (twelve 90%/10% wheels (Fig. 1a), fourteen 70%/30% wheels (Fig. 1b), and ten 50%/50% wheels (Fig. 1c)) each. Selecting a low probability/high reward option (10% or 30% portions of a wheel) during the selection phase was considered to be a “risky” choice, selecting a high probability/low reward option (70% or 90% portions of the wheel) was considered to be a “safe” choice, and selecting either 50% portion of the wheel was considered to be a “chance” choice (Ernst et al., 2004). Based on previous findings of base rates of percent risky (10% or 30% selection) and safe (90% or 70% selection) responding during the WOF task (Ernst et al., 2004), a greater number of 90/10 and 70/30 wheels were included to increase power for fMRI analyses. Chance wheels were included because they reflect decision-making during maximum uncertainty. Trial presentation was randomized, with inter-trial intervals jittered between 1-11 seconds. A practice session familiarized participants with the task before entering the scanner. In the scanner, all responses were recorded on a 4-button optical button box. Following the MRI protocol, participants completed a questionnaire that assessed effort and strategies used during the task. There were no significant group differences in response to any of these questions. In addition to the compensation for participation in the study, subjects received approximately 10% of their earnings from the task. There was no group difference in amount received; FHP youth ($7.44), FHN youth ($7.08), p > 0.05. Since the aims of this study were to understand brain activity during decision-making, only the selection phase of the trials was examined for the imaging analysis. Notably, however, analysis of the anticipation and outcome phases indicated that FHP and FHN youth did not differ on RT or responses (all p > 0.05).
Figure 1.
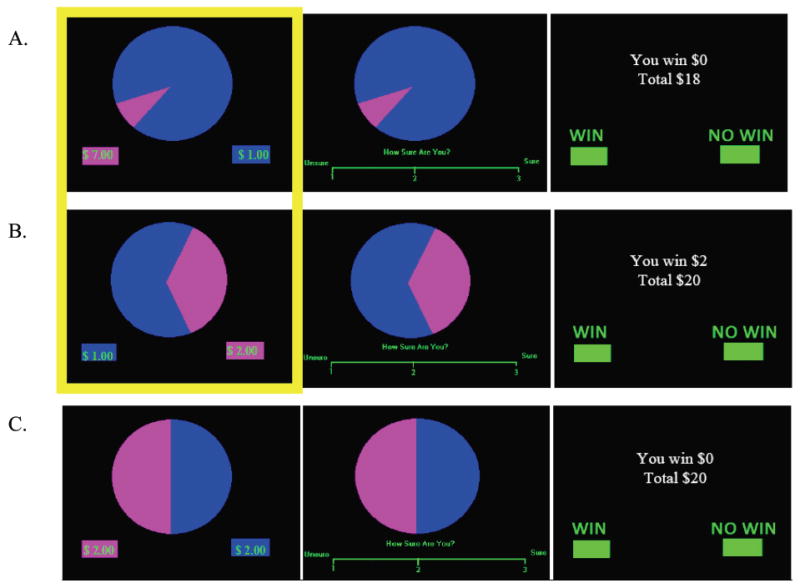
Wheel of Fortune Task. (a) Example of not winning when selecting the low probability/high reward option instead of the high probability/low reward option (10% - $7.00 vs. 90% - $1.00). During the selection phase of the trial, participants chose which portion of the wheel they thought would win them money, during anticipation they responded to how sure they were of winning, and during feedback they responded to whether or not they won money during that trial, in addition to being shown their total earnings. Trials were 10.5 seconds long and consisted of a selection (3 sec), anticipation (3.5 sec), and feedback (4 sec) phase. (b) Example of winning after selecting the 30% portion of the wheel in the 30% - $2.00 vs. 70% - $1.00 wheel. (c) Example of not winning after selecting a chance portion of the wheel. The highlighted portions of Fig. 1a and 1b indicate the task trials associated with risky (magenta) and safe (blue) choices during the selection phase, which were compared for the current analysis.
Image Acquisition
Participants were scanned at OHSU’s Advanced Imaging Research Center on a 3.0 Tesla Siemens Magnetom Tim Trio. Anatomical, high-resolution T1-weighted MPRAGE structural scans were collected in the sagittal plane (TR = 2300 ms, TE = 3.58 ms, TI = 900 ms, flip angle = 10°, FOV = 240 × 256 mm, voxel size = 1 × 1 × 1.1 mm, 160 slices, acquisition time = 9:14). Functional T2* weighted gradient echo-planar images were collected axially, parallel to the anterior commissure – posterior commissure (AC-PC) line (TR = 2000 ms, TE = 30 ms, flip angle = 90°, FOV = 240 mm2, voxel size = 3.75 × 3.75 × 3.8 mm, 33 slices, acquisition time = 2 runs of 300 TRs, lasting 10 minutes each).
Image Processing
Analysis of Functional NeuroImages (AFNI) was used for preprocessing, which included slice timing correction, motion correction, co-registration of functional and anatomical images, and spatial smoothing with a 6.0 mm full-width half-maximum Gaussian kernel (Cox, 1996; Cox and Jesmanowicz, 1999). Time repetitions (TRs) during, which movement was > 2.5 mm or 2.5° in any of the three displacement or rotational parameters were censored. No significant group differences were found in the number of TRs censored [t(12.34) = -1.11, p > 0.05].
Functional masks were created to mask out non-brain areas, after which the time series data were normalized to scale percent signal change by its mean. Regressors representing risky, chance, and safe selections, as well as anticipation and outcome phases, were modeled using AFNI’s BLOCK option with stimulus times corresponding to the time each phase of the trial began, with duration of the event coded as the length of each phase convolved with a gamma-variate hemodynamic response function, while modeling delays in the hemodynamic response (Cohen, 1997). Brain response during the anticipation and outcome phases were modeled, but were treated as regressors of no interest. The estimated baseline model in this analysis was AFNI’s intrinsic baseline, which is comprised of the mean blood-oxygen level dependent (BOLD) signal from the entire timecourse of the task, linear drift, unmodeled fixation periods between trials, and regressors of no interest (e.g., motion parameters) (Cox, 1996). Contrast images for average percent signal change of chance vs. baseline, risky vs. baseline, safe vs. baseline, risky vs. safe selections, and the mean of risky and safe decision types vs. chance selections were analyzed (Ernst et al., 2004). Data were then resampled into 3.0 mm3 voxels and transformed into standardized space (Talairach and Tournoux, 1988), prior to group-level analyses.
Group Analysis
Demographic and Behavioral Data
Statistical analyses were performed in SPSS (SPSS for Windows, Release 17.0, 2008). Participant demographics and behavioral data were examined for outliers > 2.5 SD from the mean and normal distribution using Shapiro-Wilk tests. Demographic and behavioral data were analyzed using independent-samples t-tests and non-parametric tests when data were not normally distributed. Nominal data was analyzed with Chi-square tests. Reaction times (RT) on risky and safe selections between the groups were analyzed using a repeated measures analysis of variance (ANOVA). Regression analyses were performed to examine the relationship between behavioral measures and FHD scores.
Imaging Data
To best represent task-related activity for both FHP and FHN participants, individual group t-test maps were initially voxel thresholded at p < 0.05 (minimum cluster size of 200 contiguous voxels) to show representative brain activity for each group using one-sample t-tests. The unclustered, voxel thresholded (p < 0.05) map for each group, was combined to form a map of task-related brain activity for the entire sample. Group differences in decision-making related activity were then examined within this task-related activity map. To control for Type I error in between-group analyses, AFNI’s AlphaSim Monte Carlo simulation was performed using both a voxel (p < 0.05) and cluster threshold (α < 0.05) (Forman et al., 1995). Significant clusters in the task-related activity maps were those with 62 contiguous significant voxels that exceeded 1674 μl. For behavioral analyses and combined fMRI and behavioral analyses, p < 0.05 was considered significant.
3. Results
Behavioral Data
Participant characteristics are presented in Table 1. Family history status and extraversion were the only variables significantly different between groups. No significant between group differences were found on risk-taking or RT during the WOF task. While both FHP and FHN youth made more risky than safe choices, there was a trend for FHP adolescents to make fewer risky choices (60.27±4.91 %) than FHN adolescents (73.84±4.40 %) [t(29) = -1.97, p = 0.06]. Also, there was a trend for all youth to make fewer risky choices with increased age [t(27) = -1.93, p = .06], with no significant interaction between groups for this effect [t(27) = -.19, p > .05]. Although group differences in RT were not present, there was a main effect of selection type [F(1, 29) = 5.90, p < 0.05, partial η2 = 0.17], such that all youth made faster responses on risky vs. safe choices. There was no significant interaction between family history status and selection type for RT in the task [F(1, 29) = 1.29, p > 0.05]; however, there was a significant relationship indicating that slower RT on risky vs. safe selections was associated with fewer risky choices in both FHP and FHN youth [Overall model R2 = 0.47, β = -0.61, F(2, 28) = 12.48, t(28) = -4.33, p < 0.05] (Fig. 2). FHD scores did not correlate with task behavior (all p > 0.05).
Table 1.
Participant Characteristics.
| FHPh (n = 18) | FHN (n = 13) | Statistic | |
|---|---|---|---|
| Female (n) | 6 | 5 | X21 = 0.09 |
| Age | 14.18 (0.70) | 14.24 (0.75) | t29 = -0.22 |
| Pubertal Statusa | 2.64 (0.49) | 2.68 (0.59) | t29 = -0.17 |
| Caucasian (%) | 94.4 | 100 | X21 = 0.75 |
| IQb | 110.56 (11.21) | 111.46 (11.56) | t29 = -0.22 |
| GPAc | 3.37 (0.60) | 3.64 (0.44) | U29 = 86, Z = -1.26 |
| Socioeconomic Statusd | 37.22 (15.66) | 30.77 (13.35) | U29 = 86.5, Z = -1.23 |
| JEPIe Extraversion | 18.65 (2.18)f | 15.92 (3.23) | t28 = -2.73* |
| JEPI Neuroticism | 7.56 (4.26) | 6.38 (3.31) | t29 = -.83 |
| FHDg | 0.49 (0.27) | 0 |
Values are presented as mean (S.D.), unless otherwise indicated. Note: there were no statistically significant differences between groups on any variables (all p > 0.05), except for JEPI extraversion (p < 0.05).
Pubertal Development Scale; scores range 1-5, with higher scores reflecting greater maturity.
Wechsler’s Abbreviated Scale of Intelligence.
Grade Point Average.
Hollingshead Index of Social Position; higher scores indicate lower socioeconomic status; mean scores here are commensurate with middle (FHP) and upper-middle class (FHN) status (Hollingshead & Redlich, 1958).
Junior Eysenck Personality Inventory (Eysenck, 1963).
n = 17 because of one excluded outlier (>2.5 SD from mean).
Family History Density; distribution for FHP youth was the following: 33.33% biological father with AUD; 33.33% aunts/uncles with AUD; 16.67% grandparents with AUD; 16.67% with grandparent and aunts/uncles with AUD; 0% biological mother with AUD.
Two FHP youth had used alcohol and substances in the current study, and use for both of these youth was below the limited amount permitted for eligibility as described in the Methods. No FHN youth had ever used alcohol or substances in the present sample.
Indicates p < 0.05.
Figure 2.
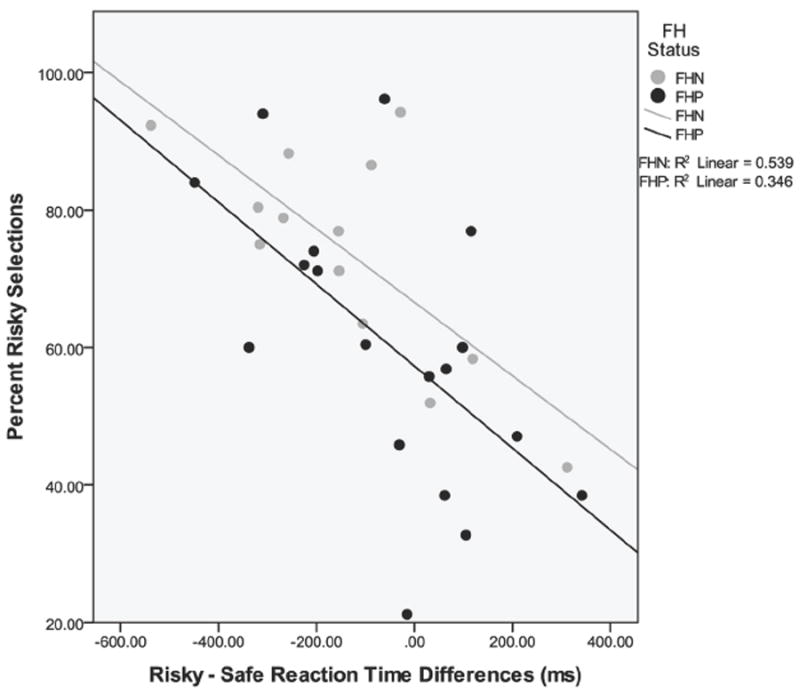
Scatter plot of risky – safe selection reaction time and percent risky selections on the task. Slower reactions times on risky vs. safe choices predicted fewer risky selections on the task. [Overall model R2 = 0.47, β = -0.61, F(2, 28) = 12.48, t(28) = -4.33, p < 0.05]. FH = family history, FHN = family history negative, FHP = family history positive.
fMRI
Whole-brain Risky vs. Safe and Chance Selection BOLD Response
Overall, whole-brain analysis for each group indicated that FHP and FHN youth engaged similar brain areas when making risky vs. safe selections, including bilateral temporal, parietal, occipital and frontal lobes and subcortical regions (see Table 2 for a detailed description of activated clusters and Figure 3 for representative brain activity in each group). Results of the whole-brain analysis are consistent with previous findings of risky vs. safe selection BOLD activity using this task (Ernst et al., 2004). Furthermore, FHP and FHN youth engaged similar brain areas when making chance selections during the task. Parietal, occipital, and frontal lobes, as well as the cerebellum, were activated in each of the groups (Table 2).
Table 2.
Whole-brain analysis of decision-making related brain activity in FHP and FHN youth.
| Anatomic Location | Side | x | y | z | Volume (voxels) | t-value | Cohen’s d |
|---|---|---|---|---|---|---|---|
| Risky (10/30) vs. Safe (70/90) Selection | |||||||
|
| |||||||
| FHP | |||||||
|
| |||||||
| Cluster 1: STG, MTG, MFG, IFG, PG, HIPP, AMYG, Basal Ganglia, Insula | L | -23 | -2 | -34 | 793 | 2.64 | 0.62 |
|
| |||||||
| Cluster 2: SFG, PCG, PoCG, SPL, IPL | L | -44 | -38 | 60 | 540 | 2.71 | 0.64 |
|
| |||||||
| Cluster 3: MOG, LG, FG, Cuneus | L | -2 | -89 | -4 | 401 | 2.72 | 0.64 |
|
| |||||||
| Cluster 4: STG, IFG, PG, HIPP, AMYG, THAL | R | 29 | -11 | -28 | 327 | 2.65 | 0.62 |
|
| |||||||
| Cluster 5: MeFG, SFG, PCG, PoCG, SPL, IPL | R | 32 | -41 | 66 | 248 | 2.69 | 0.63 |
|
| |||||||
| Cluster 6: MOG, IOG, Cuneus, LG, FG, ITG | R | 20 | -92 | -10 | 231 | 2.56 | 0.60 |
|
| |||||||
| FHN | |||||||
|
| |||||||
| Cluster 1: PG, HIPP, AMYG, DLPFC, PCG, PoCG, ACC, THAL, TL, FG, CG, Insula, Bilateral: Precuneus | R | 53 | -56 | -16 | 2934 | 2.69 | 0.75 |
|
| |||||||
| Cluster 2: STG, MTG, AMYG, IPL, THAL, MOG, FG, IFG, MFG, PCG, PoCG, ACC, HIPP, PG Insula, Bilateral: LG, Basal Ganglia | L | 2 | -86 | -13 | 1897 | 2.70 | 0.75 |
|
| |||||||
| Cluster 3: Inferior Cerebellar Tonsil, Posterior Cerebellar Tonsil, Brainstem | R | 5 | -23 | -40 | 335 | 2.64 | 0.67 |
|
| |||||||
| Cluster 4: Bilateral: OFC, ACC, MeFG | -5 | 14 | -19 | 232 | 2.70 | 0.75 | |
|
| |||||||
| FHP < FHN | |||||||
|
| |||||||
| DLPFC | R | 35 | 20 | 27 | 66 | -2.69 | 1.00 |
| Inferior Cerebellar Tonsil | R | 8 | -32 | -43 | 73 | -2.81 | 1.04 |
|
| |||||||
| Chance (50) Selection | |||||||
|
| |||||||
| FHP | |||||||
|
| |||||||
| Cluster 1: PCG, PoCG, SFG, Bilateral: SPL, IPL, MOG, IOG, PG, Precuneus, Cuneus, Cerebellum | L | -34 | -53 | -34 | 5629 | 5.42 | 1.28 |
|
| |||||||
| Cluster 2: Bilateral: SFG, MeFG, CG | -5 | 26 | 33 | 249 | 5.07 | 1.20 | |
|
| |||||||
| FHN | |||||||
|
| |||||||
| Cluster 1: Bilateral: FG, LG, IOG, MOG, Cuneus, Cerebellum | 2 | -83 | -10 | 2024 | 5.37 | 1.49 | |
|
| |||||||
| Cluster 2: IPL, SPL, PoCG, MFG, PCG, MeFG, Precuneus | L | -35 | -20 | 66 | 759 | 5.33 | 1.48 |
|
| |||||||
| Cluster 3: PCG, IPL, SPL | R | 8 | -74 | 51 | 208 | 4.92 | 1.36 |
|
| |||||||
| FHP < FHN or FHP > FHN | |||||||
|
| |||||||
| No clusters | |||||||
Whole-brain patterns of risky (10/30) vs. safe (70/90) and chance (50) selection brain activity in each group and significant group differences in brain response. For each cluster, the anatomic location of significant voxels, the coordinates of the peak voxels of the cluster in Talaraich space, the size of the cluster, as well as the corresponding t-value and the effect size (Cohen’s d) are listed. One sample t-tests for risky vs. safe selection whole-brain analyses for each group were evaluated at p < 0.05 with a minimum cluster size of 200 voxels to illustrate overall patterns of activation in each group during risky decision-making. One sample t-tests for chance selection whole-brain analyses for each group were evaluated at a more stringent threshold of p < 0.001 with a minimum cluster size of 200 voxels. Significant group differences are corrected for multiple comparisons, voxel/clusterwise correction p < 0.05; minimum cluster volume: 62 voxels. Abbreviations: R = right; L = left; ACC = anterior cingulate cortex; AMYG = amygdala; CG = cingulate gyrus; DLPFC = dorsolateral prefrontal cortex; FG = fusiform gyrus; HIPP = hippocampus; IFG = inferior frontal gyrus; IOG = inferior occipital gyrus; IPL = inferior parietal lobule; ITG = inferior temporal gyrus; LG = lingual gyrus; MeFG = medial frontal gyrus; MFG = middle frontal gyrus; MOG = middle occipital gyrus; MTG = middle temporal gyrus; OFC = orbitofrontal cortex; PCG = precentral gyrus; PoCG = postcentral gyrus; PG = parahippocampal gyrus; SFG = superior frontal gyrus; SPL = superior parietal lobule; STG = superior temporal gyrus; THAL = thalamus; TL = temporal lobe.
Figure 3.
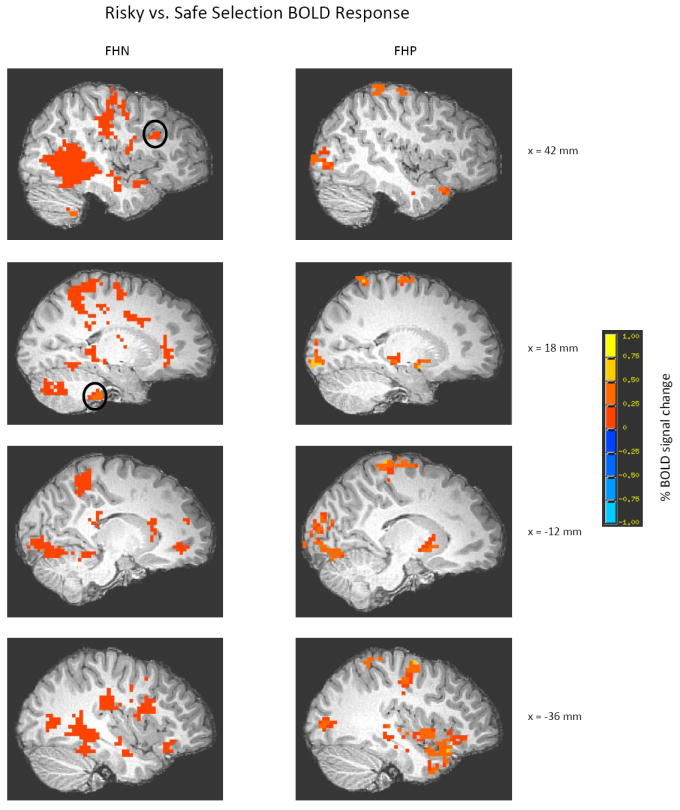
Whole-brain patterns of risky (10/30) vs. safe (70/90) brain activity for FHN and FHP youth. One sample t-tests for risky vs. safe selection whole-brain analyses for each group were evaluated at p < 0.05 with a minimum cluster size of 200 voxels to illustrate overall patterns of activation in each group during risky decision-making. For a detailed description of all brain areas activated at this threshold for each group, see Table 2. Circled areas represent the location where group differences in right DLPFC (peak coordinates of cluster: x = 35 mm, y = 20 mm, z = 27 mm) and right inferior cerebellar tonsil (peak coordinates of cluster: x = 8 mm, y = -32 mm, z = -43 mm) brain activity arise. Maps are rendered onto a representative subject’s T1-weighted anatomical image. DLPFC = dorsolateral prefrontal cortex, FHN = family history negative, FHP = family history positive.
Group Differences in Decision-making Related BOLD Response
Prior to examining group differences in risk-related brain activity, the average number of risky and safe TRs was compared between groups. Repeated measures ANOVA revealed no significant interaction of group status and number of TRs modeled for risky (FHP youth: 30.5, FHN youth: 37.9) and safe selections (FHP youth: 20.2, FHN youth: 13.2); (F(1, 29) = 4.14, p > 0.05). To ensure relevance to decision-making, areas of group difference in risky vs. safe, chance vs. baseline, and mean risky and safe vs. chance selection were examined using a whole-brain analysis restricted to decision-making-related areas of activation.
First, we examined brain activity in the risky vs. safe decision-making contrast. Following correction for multiple comparisons, two brain regions showed significantly different BOLD response in FHP vs. FHN youth. Specifically, clusters in the right dorsolateral prefrontal cortex (DLPFC) (1782 μl, Fig. 3) and right cerebellar tonsil (1971 μl, Fig. 4) showed significantly less BOLD activity in FHP compared to FHN adolescents during risky vs. safe decision-making. Notably, these group differences remained significant after excluding the six FHP youth with the lowest FHD scores (FHD < 0.5; cerebellum: p < 0.01, DLPFC: p < 0.001).
Figure 4.
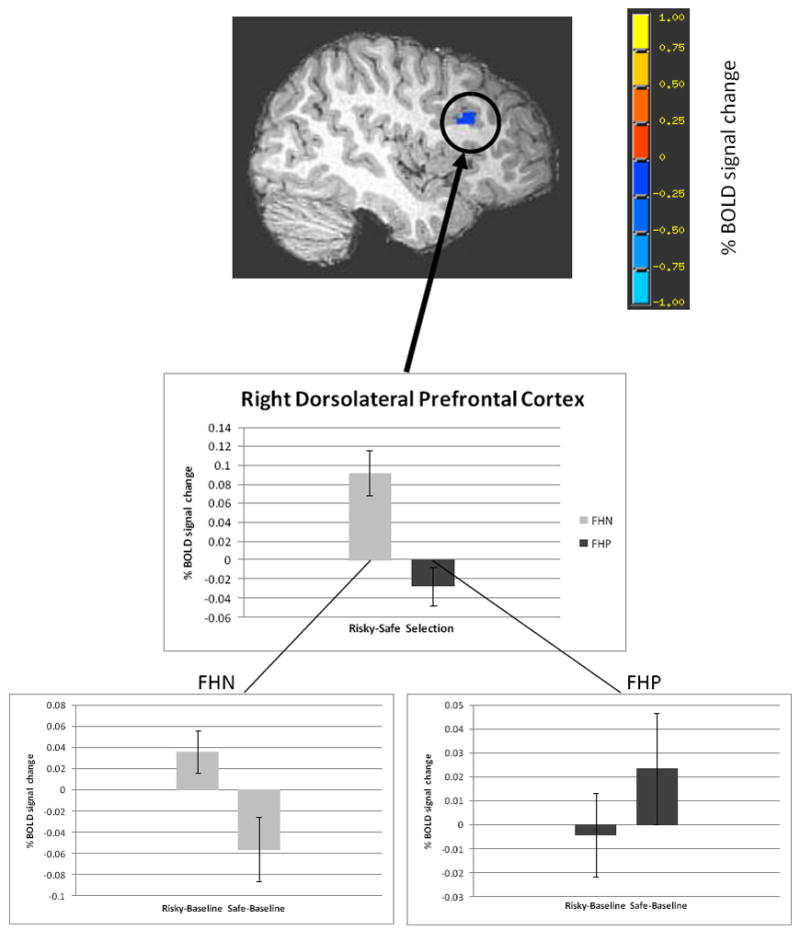
Less BOLD response in FHP youth than FHN youth in the risky vs. safe selection contrast (voxel/clusterwise threshold p < 0.05) in right DLPFC (peak coordinates of cluster: x = 35 mm, y = 20 mm, z = 27 mm). Bar graphs represent percent signal change (mean +/- SEM) in the risky vs. safe contrast independently for each of the groups. The inset for each group illustrates brain activity during risky vs. baseline and safe vs. baseline conditions. Maps are rendered onto a representative subject’s T1-weighted anatomical image.
To further understand how percent signal change during risky and safe decisions compared to baseline brain activation for each group (e.g. activation or deactivation of decision-making related BOLD response vs. baseline brain activity), the mean percent signal change for each participant in the risky vs. safe decision-making contrast was extracted from the two clusters of significant group difference in brain activity. There was a significant interaction between selection type and group in both of the clusters [right DLPFC: F(1, 29) = 14.53, MSE = 0.004, p < 0.05, partial η2 = 0.33; right cerebellar tonsil: F(1, 29) = 15.61, MSE = 0.35, p < 0.05, partial η2 = 0.35]. FHN youth showed significantly greater mean BOLD response when making risky vs. safe decisions in both of the clusters [right DLPFC: t(12) = 3.83, p < 0.05; right cerebellar tonsil: t(12) = 2.92, p < 0.05]. FHP youth also significantly differed in risky vs. safe selection brain response in the right cerebellar tonsil [t(17) = -2.25, p < 0.05], but displayed no differences in brain activity between risky and safe selection types in the right DLPFC [t(17) = -1.36, p > 0.05]. These results remained significant after covarying for the group difference in extraversion, percent risky/safe decision-making, and RT.
While no interactions between performance and family history status related to brain activity in either the DLPFC or the cerebellum, there was a significant relationship between RT on risky vs. safe selections and BOLD response in the DLPFC, regardless of family history status [Overall model R2 = 0.49, F(3, 27) = 8.55, RT: β = .37, t(27) = 2.62, p < 0.05]. Furthermore, given the relationship between intelligence and executive functioning (Foley et al., 2009), we examined whether IQ correlated with DLPFC activity during risky decision-making. No significant relationship between IQ and DLPFC activity was present [Overall model R2 = 0.02, F(1, 29) = 0.56, β = -.14, t(29) = -.75, p > 0.05]. Finally, FHD was not related to neural response during risky decision-making in FHP youth.
Additionally, we examined brain activity during selection of the chance portion of a wheel, which contrasted BOLD response during selection of the 50 portion of the wheel against baseline brain activity, but no significant group differences were present. Following this analysis, we also examined brain response during decision-making, more generally, by contrasting the average BOLD response for both risky and safe decision types against chance selection brain activity. This analysis showed that FHP youth engaged bilateral parietal circuitry significantly more in risky and safe decisions vs. chance selection than FHN youth (Table 3).
Table 3.
Whole-brain analysis of mean risky and safe selection compared to chance selection brain activity in FHP and FHN youth.
| Anatomic Location | Side | x | y | z | Volume (voxels) | t-value | Cohen’s d |
|---|---|---|---|---|---|---|---|
| Mean Risky and Safe Selection vs. Chance Selection | |||||||
| FHP | |||||||
| Cluster 1: MOG, IOG, SOG, ITG, MTG, PC, FG, LG, PG, SPL, IPL, Cuneus, Precuneus, Cerebellum | R | 50 | -65 | -13 | 1391 | 2.82 | 0.66 |
| Cluster 2: MOG, IOG, SOG, ITG, MTG, PC, FG, LG | L | -47 | -74 | -13 | 1196 | 2.79 | 0.66 |
| PG, SPL, IPL Cuneus, Precuneus, Cerebellum, PoCG | |||||||
| Cluster 3: SFG, MFG, Bilateral: ACC, CG, MeFG | R | 41 | 62 | 12 | 509 | 2.59 | 0.61 |
| FHN | |||||||
| Cluster 1: ITG, FG, PG, STG, Insula, Putamen, PCG, PoCG, IPL | R | 44 | -14 | -31 | 689 | -2.69 | 0.75 |
| Cluster 2: IFG, MFG, Insula | L | -50 | 47 | 3 | 519 | -2.81 | 0.78 |
| Cluster 3: PoCG, Bilateral: MeFG, PCG | R | 26 | -29 | 72 | 289 | -2.60 | 0.72 |
| FHP > FHN | |||||||
| Cluster 1: Cerebellum, FG, MOG, IOG, SOG, MTG, ITG, PG | L | -47 | -68 | -13 | 518 | 2.81 | 1.04 |
| Cluster 2: FG, MOG, MTG, ITG, Cuneus, PC, SOG, Precuneus | R | 47 | -47 | -16 | 300 | 2.52 | 0.94 |
| Cluster 3: Precuneus, SPL, IPL | R | 32 | -62 | 54 | 172 | 2.83 | 1.05 |
| Cluster 4: Precuneus, SPL, IPL | L | -23 | -56 | 51 | 95 | 2.73 | 1.01 |
| Cluster 5: LG, FG, Cerebellum | R | 26 | -59 | -10 | 88 | 2.78 | 1.03 |
| FHP < FHN | |||||||
| No clusters |
Whole-brain patterns of mean risky (10/30) and safe (70/90) vs. chance (50) selection brain activity in each group and significant group differences in brain response. For each cluster, the anatomic location of significant voxels, the coordinates of the peak voxels of the cluster in Talaraich space, the size of the cluster, as well as the corresponding t-value and the effect size (Cohen’s d) are listed. One sample t-tests for mean risky (10/30) and safe (70/90) vs. chance (50) whole-brain analyses for each group were evaluated at p < 0.05 with a minimum cluster size of 200 voxels to illustrate overall patterns of activation in each group during decision-making. Significant group differences are corrected for multiple comparisons, voxel/clusterwise correction p < 0.05; minimum cluster volume: 60 voxels. Abbreviations: R = right; L = left; ACC = anterior cingulate cortex; CG = cingulate gyrus; FG = fusiform gyrus; IFG = inferior frontal gyrus; IOG = inferior occipital gyrus; IPL = inferior parietal lobule; ITG = inferior temporal gyrus; LG = lingual gyrus; MeFG = medial frontal gyrus; MFG = middle frontal gyrus; MOG = middle occipital gyrus; MTG = middle temporal gyrus; PC = posterior cingulate, PCG = precentral gyrus; PoCG = postcentral gyrus; PG = parahippocampal gyrus; SFG = superior frontal gyrus; SOG = superior occipital gyrus; SPL = superior parietal lobule; STG = superior temporal gyrus.
4. Discussion
The goal of the current study was to investigate reward-based decision making and associated brain activity in adolescents at risk for alcoholism, to better understand vulnerabilities that may lead to the development of an AUD. Contrary to our hypothesis, FHP youth did not differ from FHN youth in risk-taking behavior; however, despite comparable task performance, there were significant between-group differences in risk-related PFC and cerebellar brain response.
To our knowledge, no studies have previously examined risk-taking behavior in FHP youth, an adolescent group with an even greater propensity toward alcohol use (Dawson et al., 1992). Since some studies indicate that FHP youth show deficits in executive functioning (Harden and Pihl, 1995), we hypothesized that such individuals would exhibit greater risk-taking, secondary to reduced cognitive control, even in the absence of alcohol abuse. Unexpectedly, we found a trend for FHP youth to make fewer risky choices on the WOF task than FHN youth. While family history of alcoholism is a robust risk factor for developing an AUD (Dawson et al., 1992), certainly not all FHP individuals go on to develop alcoholism. This may be due to environmental protective factors, such as positive family functioning (Hill et al., 1992) that could reduce risk-taking propensity in some FHP youth. Additionally, some studies suggest that anxiety during decision-making may promote risk avoidance (Maner et al., 2007), and neuroticism may lead to avoidance of anxiety associated with bad outcomes (i.e. not winning money), with this latter personality factor shown to mediate the relationship between family history of alcoholism and alcohol abuse (Loukas et al., 2000). Although our groups did not differ on the personality trait of neuroticism, we did not assess anxiety associated with making decisions during the WOF, and this may be another possibility for the lower risky choices observed in FHP youth. Furthermore, since risky behaviors, such as alcohol use, are positively associated with peer drinking (Curran et al., 1997), examining risky decision-making in social situations may produce different findings. Thus, future fMRI studies should devise tasks to examine social influence on risk-taking in FHP youth and controls, since adolescents are particularly susceptible to risky decisions in the presence of peers (Chein et al., 2011; Gardner and Steinberg, 2005).
Notably, both groups of adolescents in this study showed comparable brain response to a previous study that examined whole-brain activity in this task during risky decision-making in adults (Ernst et al., 2004). As hypothesized, FHP youth displayed reduced risk-related activation in the right DLPFC compared to FHN peers. The DLPFC develops substantially during adolescence (Gogtay et al., 2004), is believed to subserve many aspects of executive functioning (Tamm et al., 2002; Thomas et al., 1999), and has been implicated for its role in decision-making (Van Leijenhorst et al., 2010). While we also hypothesized that less neural response to risky decision-making would be observed in the vmPFC in FHP youth, our data did not support this result. It is possible that the lack of group differences seen in this region may indicate that atypical vmPFC activity during risk-taking, as seen in alcoholics (Bechara et al., 2001), is a result of alcohol abuse itself, and may not be aberrant in high-risk FHP youth. Thus, our findings indicate that weaker risk-related brain response in the DLPFC may contribute to poorer cognitive control, which could render FHP adolescents vulnerable to poor behavioral regulation, resulting in the decision to use alcohol.
To better understand the nature of risk-related brain activity in FHP youth, BOLD response during each decision type was compared to baseline brain activity. Interestingly, this analysis showed that FHP youth did not differ in DLPFC brain response during either type of decision, while FHN youth showed significantly greater DLPFC activity during overall risky vs. safe choices. This may indicate that FHN youth are evaluating these decisions differently, while FHP youth do not differentiate between the two choices, as observed in the similar patterns of brain activity seen regardless of the decision they made. Thus, the current findings support recent literature suggesting atypical brain activity (Heitzeg et al., 2010; Silveri et al., 2011) during tasks of executive functioning in FHP youth compared to their peers in brain regions important for cognitive control.
In addition to differences in DLPFC activity, FHP youth showed less risk-related BOLD response in the cerebellum. Although the function of the cerebellum in motor control has long been established (McLeod and Van der Meulen, 1968), recent studies have implicated the cerebellum in executive functioning (Lie et al., 2006). Specifically, cerebellar tonsil involvement has been shown during tasks of working memory (Desmond et al., 1997) and attention (Allen et al., 1997). This role of the cerebellar tonsil in executive functioning is not surprising given the reciprocal anatomical projections between the cerebellum and the PFC (Brodal, 1978). Interestingly, previous studies have found morphometric cerebellar abnormalities (Chanraud et al., 2007) and disrupted fronto-cerebellar systems (Sullivan et al., 2003) in alcoholics, while FHP youth also show structural abnormalities in the cerebellum (Hill et al., 2007), as well as atypical fronto-cerebellar circuitry (Herting et al., 2011). In the current study, hypoactivity of the DLPFC and cerebellum during decision-making in largely alcohol-naïve FHP youth lends further support to the hypothesis that fronto-cerebellar systems may be disrupted in individuals at high risk for alcoholism, even prior to the onset of alcohol abuse.
To further clarify the nature of our group differences in brain response during decision-making, we also analyzed brain activity during chance decisions, and found no group differences. This indicates that differences in brain response between FHP and FHN youth are not present when making decisions that do not involve risk, and suggests that FHP youth have weaker neural response specifically related to risky decision-making, which may render them at greatest risk for poor choices regarding alcohol use. Also, in order to understand whether FHP and FHN youth engage computational neurocircuitry differently during decision making, we analyzed brain activity during risky and safe decisions vs. chance selections. FHP youth engaged parietal areas, important for computational calculations (Dehaene et al., 2003), to a greater extent than FHN youth, suggesting that aberrant brain response in fronto-parietal areas is another feature of family history risk for AUD. Given that differences in brain activity in the risky and safe decisions vs. chance selection contrast were not seen in the same regions as those present during risky vs. safe decision-making, these findings may suggest atypical brain response that is independent of differences seen during risk taking-related brain activity.
While this study is the first to investigate risk-taking behavior and associated neural activity in FHP and FHN youth, limitations and future directions should be discussed. First, since the current findings indicate atypical frontal and cerebellar risk-related brain activity in FHP adolescents, which might help to explain the greater alcohol-associated risk-taking later seen in FHP young adults (LaBrie et al., 2009), prospective longitudinal study designs are crucial for determining these cause and effect relationships. Second, the current study did not find any relationship between FHD and decision-making related behavior or brain response. This may be due to a narrow range and overall low mean of FHD scores in this sample, which may have precluded detection of these relationships. Additionally, the influence of both genetic and environmental factors on brain and behavior phenotypes related to a family history of alcoholism may differ by participant, increasing the difficulty of FHD to provide a clear linear relationship to brain and behavioral measures. While we assessed family history of alcoholism by interviewing both parent and youth, multiple adult informants could provide more precise information. Third, due to a small sample size, we were unable to analyze sex differences associated with family history status risk, an important future direction, particularly given previous work indicating sex differences in FHP youth (Silveri et al., 2008). Finally, since there are limitations in interpreting the relationship of risk-taking during a monetary decision-making task to risky behaviors surrounding alcohol use, developing non-monetary tasks to assess risky decision-making during adolescence will also be important.
In conclusion, the current study found weaker risk-related brain activity during decision-making in prefrontal and cerebellar regions in FHP youth compared to FHN peers. Importantly, despite the lack of differences in risk-taking behavior, these findings emphasize that atypical neural activity exists during decision-making, in the absence of alcohol abuse, in youth with a familial history of alcoholism. This could render FHP youth vulnerable to poor decision-making, such as the initiation of heavy alcohol use. Previous studies showing atypical brain response in FHP youth during tasks of executive functioning (Schweinsburg et al., 2004; Spadoni et al., 2008), along with current findings of aberrant brain activity in regions implicated in cognitive control, indicate that future work is necessary to understand how these deficits contribute to the higher rates of AUDs seen in FHP adolescents.
Figure 5.
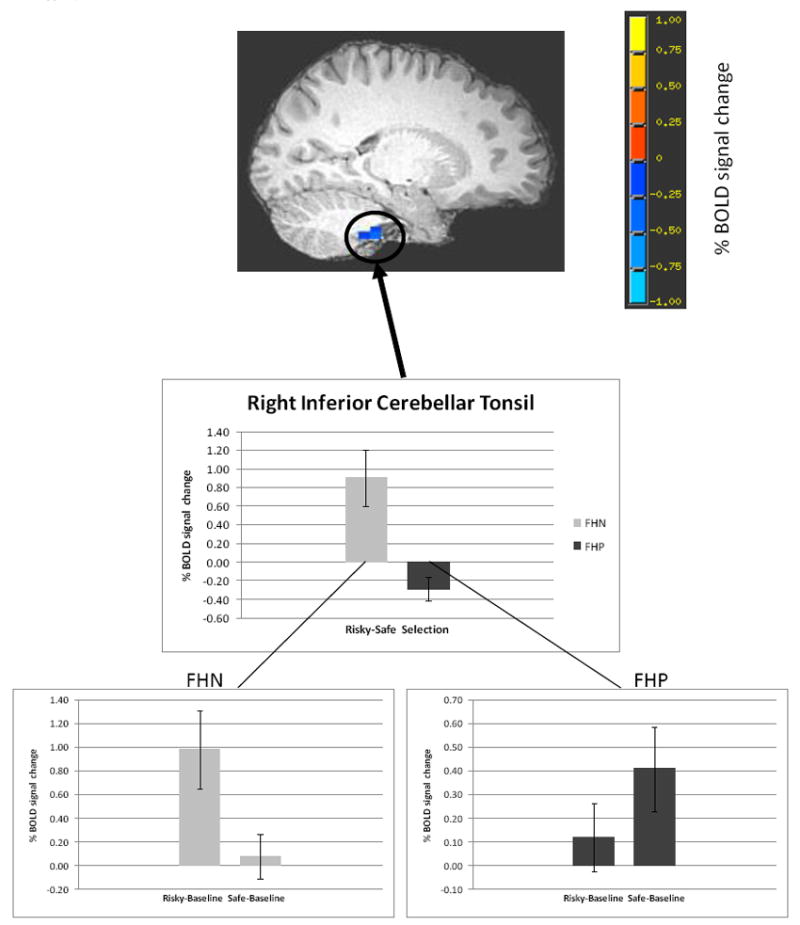
Less BOLD response in FHP youth than FHN youth in the risky vs. safe selection contrast (voxel/clusterwise threshold p < 0.05) in right inferior cerebellar tonsil (peak coordinates of cluster: x = 8 mm, y = -32 mm, z = -43 mm). Bar graphs represent percent signal change (mean +/- SEM) in the risky vs. safe contrast independently for each of the groups. The inset for each group illustrates brain activity during risky vs. baseline and safe vs. baseline conditions. Maps are rendered onto a representative subject’s T1-weighted anatomical image.
Acknowledgments
Dr. Monique Ernst is thanked for her advice on the fMRI task design and interpretation of the results. Nate Spofford and Emily Maxwell are thanked for their assistance with participant scheduling and data collection. This research was supported by the National Institute on Alcohol Abuse and Alcoholism (T32 AA007468, Cservenka; R01 AA017664, Nagel), pilot funds from the Portland Alcohol Research Center (P60 AA010760, Nagel), and the National Institute of Neurological Disorders and Stroke (K08 NS052147, Nagel).
References
- Acheson A, Robinson JL, Glahn DC, Lovallo WR, Fox PT. Differential activation of the anterior cingulate cortex and caudate nucleus during a gambling simulation in persons with a family history of alcoholism: studies from the Oklahoma Family Health Patterns Project. Drug Alcohol Depend. 2009;100(1-2):17–23. doi: 10.1016/j.drugalcdep.2008.08.019. [DOI] [PMC free article] [PubMed] [Google Scholar]
- Allen G, Buxton RB, Wong EC, Courchesne E. Attentional activation of the cerebellum independent of motor involvement. Science. 1997;275(5308):1940–3. doi: 10.1126/science.275.5308.1940. [DOI] [PubMed] [Google Scholar]
- Andreasen NC, Rice J, Endicott J, Reich T, Coryell W. The family history approach to diagnosis. How useful is it? Arch Gen Psychiatry. 1986;43(5):421–9. doi: 10.1001/archpsyc.1986.01800050019002. [DOI] [PubMed] [Google Scholar]
- Andrews MM, Meda SA, Thomas AD, Potenza MN, Krystal JH, Worhunsky P, Stevens MC, O’Malley S, Book GA, Reynolds B, Pearlson GD. Individuals family history positive for alcoholism show functional magnetic resonance imaging differences in reward sensitivity that are related to impulsivity factors. Biol Psychiatry. 2011;69(7):675–83. doi: 10.1016/j.biopsych.2010.09.049. [DOI] [PMC free article] [PubMed] [Google Scholar]
- Bechara A, Dolan S, Denburg N, Hindes A, Anderson SW, Nathan PE. Decision-making deficits, linked to a dysfunctional ventromedial prefrontal cortex, revealed in alcohol and stimulant abusers. Neuropsychologia. 2001;39(4):376–89. doi: 10.1016/s0028-3932(00)00136-6. [DOI] [PubMed] [Google Scholar]
- Bjork JM, Knutson B, Hommer DW. Incentive-elicited striatal activation in adolescent children of alcoholics. Addiction. 2008;103(8):1308–19. doi: 10.1111/j.1360-0443.2008.02250.x. [DOI] [PubMed] [Google Scholar]
- Blackwood N, Ffytche D, Simmons A, Bentall R, Murray R, Howard R. The cerebellum and decision making under uncertainty. Brain Res Cogn Brain Res. 2004;20(1):46–53. doi: 10.1016/j.cogbrainres.2003.12.009. [DOI] [PubMed] [Google Scholar]
- Brodal P. Principles of organization of the monkey corticopontine projection. Brain Res. 1978;148(1):214–8. doi: 10.1016/0006-8993(78)90392-x. [DOI] [PubMed] [Google Scholar]
- Brown SA, Myers MG, Lippke L, Tapert SF, Stewart DG, Vik PW. Psychometric evaluation of the Customary Drinking and Drug Use Record (CDDR): a measure of adolescent alcohol and drug involvement. Journal of Studies on Alcohol. 1998;59(4):427–38. doi: 10.15288/jsa.1998.59.427. [DOI] [PubMed] [Google Scholar]
- Brown SA, Myers MG, Mott MA, Vik PW. Correlates of success following treatment for adolescent substance abuse. Applied & Preventive Psychology. 1994;3:61–73. [Google Scholar]
- Chanraud S, Martelli C, Delain F, Kostogianni N, Douaud G, Aubin HJ, Reynaud M, Martinot JL. Brain morphometry and cognitive performance in detoxified alcohol-dependents with preserved psychosocial functioning. Neuropsychopharmacology. 2007;32(2):429–38. doi: 10.1038/sj.npp.1301219. [DOI] [PubMed] [Google Scholar]
- Chapman K, Tarter RE, Kirisci L, Cornelius MD. Childhood neurobehavior disinhibition amplifies the risk of substance use disorder: interaction of parental history and prenatal alcohol exposure. J Dev Behav Pediatr. 2007;28(3):219–24. doi: 10.1097/DBP.0b013e3180327907. [DOI] [PubMed] [Google Scholar]
- Chein J, Albert D, O’Brien L, Uckert K, Steinberg L. Peers increase adolescent risk taking by enhancing activity in the brain’s reward circuitry. Dev Sci. 2011;14(2):F1–F10. doi: 10.1111/j.1467-7687.2010.01035.x. [DOI] [PMC free article] [PubMed] [Google Scholar]
- Cohen MS. Parametric analysis of fMRI data using linear systems methods. Neuroimage. 1997;6(2):93–103. doi: 10.1006/nimg.1997.0278. [DOI] [PubMed] [Google Scholar]
- Cox RW. AFNI: software for analysis and visualization of functional magnetic resonance neuroimages. Comput Biomed Res. 1996;29(3):162–73. doi: 10.1006/cbmr.1996.0014. [DOI] [PubMed] [Google Scholar]
- Cox RW, Jesmanowicz A. Real-time 3D image registration for functional MRI. Magn Reson Med. 1999;42(6):1014–8. doi: 10.1002/(sici)1522-2594(199912)42:6<1014::aid-mrm4>3.0.co;2-f. [DOI] [PubMed] [Google Scholar]
- Curran PJ, Stice E, Chassin L. The relation between adolescent alcohol use and peer alcohol use: a longitudinal random coefficients model. J Consult Clin Psychol. 1997;65(1):130–40. doi: 10.1037//0022-006x.65.1.130. [DOI] [PubMed] [Google Scholar]
- Dawson DA, Harford TC, Grant BF. Family history as a predictor of alcohol dependence. Alcohol Clin Exp Res. 1992;16(3):572–5. doi: 10.1111/j.1530-0277.1992.tb01419.x. [DOI] [PubMed] [Google Scholar]
- Dehaene S, Piazza M, Pinel P, Cohen L. Three parietal circuits for number processing. Cogn Neuropsychol. 2003;20(3):487–506. doi: 10.1080/02643290244000239. [DOI] [PubMed] [Google Scholar]
- Desmond JE, Gabrieli JD, Wagner AD, Ginier BL, Glover GH. Lobular patterns of cerebellar activation in verbal working-memory and finger-tapping tasks as revealed by functional MRI. J Neurosci. 1997;17(24):9675–85. doi: 10.1523/JNEUROSCI.17-24-09675.1997. [DOI] [PMC free article] [PubMed] [Google Scholar]
- Ernst M, Nelson EE, McClure EB, Monk CS, Munson S, Eshel N, Zarahn E, Leibenluft E, Zametkin A, Towbin K, Blair J, Charney D, Pine DS. Choice selection and reward anticipation: an fMRI study. Neuropsychologia. 2004;42(12):1585–97. doi: 10.1016/j.neuropsychologia.2004.05.011. [DOI] [PubMed] [Google Scholar]
- Foley J, Garcia J, Shaw L, Golden C. IQ predicts neuropsychological performance in children. Int J Neurosci. 2009;119(10):1830–47. doi: 10.1080/00207450903192852. [DOI] [PubMed] [Google Scholar]
- Forman SD, Cohen JD, Fitzgerald M, Eddy WF, Mintun MA, Noll DC. Improved assessment of significant activation in functional magnetic resonance imaging (fMRI): use of a cluster-size threshold. Magn Reson Med. 1995;33(5):636–47. doi: 10.1002/mrm.1910330508. [DOI] [PubMed] [Google Scholar]
- Gardner M, Steinberg L. Peer influence on risk taking, risk preference, and risky decision making in adolescence and adulthood: an experimental study. Dev Psychol. 2005;41(4):625–35. doi: 10.1037/0012-1649.41.4.625. [DOI] [PubMed] [Google Scholar]
- Gogtay N, Giedd JN, Lusk L, Hayashi KM, Greenstein D, Vaituzis AC, Nugent TF, 3rd, Herman DH, Clasen LS, Toga AW, Rapoport JL, Thompson PM. Dynamic mapping of human cortical development during childhood through early adulthood. Proc Natl Acad Sci U S A. 2004;101(21):8174–9. doi: 10.1073/pnas.0402680101. [DOI] [PMC free article] [PubMed] [Google Scholar]
- Hanson KL, Medina KL, Nagel BJ, Spadoni AD, Gorlick A, Tapert SF. Hippocampal volumes in adolescents with and without a family history of alcoholism. Am J Drug Alcohol Abuse. 2010;36(3):161–7. doi: 10.3109/00952991003736397. [DOI] [PMC free article] [PubMed] [Google Scholar]
- Harden PW, Pihl RO. Cognitive function, cardiovascular reactivity, and behavior in boys at high risk for alcoholism. J Abnorm Psychol. 1995;104(1):94–103. doi: 10.1037//0021-843x.104.1.94. [DOI] [PubMed] [Google Scholar]
- Heitzeg MM, Nigg JT, Yau WY, Zucker RA, Zubieta JK. Striatal Dysfunction Marks Preexisting Risk and Medial Prefrontal Dysfunction Is Related to Problem Drinking in Children of Alcoholics. Biol Psychiatry. 2010 doi: 10.1016/j.biopsych.2010.02.020. [DOI] [PMC free article] [PubMed] [Google Scholar]
- Herting MM, Fair D, Nagel BJ. Altered fronto-cerebellar connectivity in alcohol-naive youth with a family history of alcoholism. Neuroimage. 2011;54(4):2582–9. doi: 10.1016/j.neuroimage.2010.10.030. [DOI] [PMC free article] [PubMed] [Google Scholar]
- Herting MM, Schwartz D, Mitchell SH, Nagel BJ. Delay Discounting Behavior and White Matter Microstructure Abnormalities in Youth With a Family History of Alcoholism. Alcohol Clin Exp Res. 2010 doi: 10.1111/j.1530-0277.2010.01244.x. [DOI] [PMC free article] [PubMed] [Google Scholar]
- Hill EM, Nord JL, Blow FC. Young-adult children of alcoholic parents: protective effects of positive family functioning. Br J Addict. 1992;87(12):1677–90. doi: 10.1111/j.1360-0443.1992.tb02681.x. [DOI] [PubMed] [Google Scholar]
- Hill SY, Muddasani S, Prasad K, Nutche J, Steinhauer SR, Scanlon J, McDermott M, Keshavan M. Cerebellar volume in offspring from multiplex alcohol dependence families. Biol Psychiatry. 2007;61(1):41–7. doi: 10.1016/j.biopsych.2006.01.007. [DOI] [PMC free article] [PubMed] [Google Scholar]
- Johnson CA, Xiao L, Palmer P, Sun P, Wang Q, Wei Y, Jia Y, Grenard JL, Stacy AW, Bechara A. Affective decision-making deficits, linked to a dysfunctional ventromedial prefrontal cortex, revealed in 10th grade Chinese adolescent binge drinkers. Neuropsychologia. 2008;46(2):714–26. doi: 10.1016/j.neuropsychologia.2007.09.012. [DOI] [PMC free article] [PubMed] [Google Scholar]
- King SM, Keyes M, Malone SM, Elkins I, Legrand LN, Iacono WG, McGue M. Parental alcohol dependence and the transmission of adolescent behavioral disinhibition: a study of adoptive and non-adoptive families. Addiction. 2009;104(4):578–86. doi: 10.1111/j.1360-0443.2008.02469.x. [DOI] [PMC free article] [PubMed] [Google Scholar]
- LaBrie JW, Kenney SR, Lac A, Migliuri SF. Differential drinking patterns of family history positive and family history negative first semester college females. Addict Behav. 2009;34(2):190–6. doi: 10.1016/j.addbeh.2008.10.012. [DOI] [PMC free article] [PubMed] [Google Scholar]
- Lie CH, Specht K, Marshall JC, Fink GR. Using fMRI to decompose the neural processes underlying the Wisconsin Card Sorting Test. Neuroimage. 2006;30(3):1038–49. doi: 10.1016/j.neuroimage.2005.10.031. [DOI] [PubMed] [Google Scholar]
- Loukas A, Krull JL, Chassin L, Carle AC. The relation of personality to alcohol abuse/dependence in a high-risk sample. J Pers. 2000;68(6):1153–75. doi: 10.1111/1467-6494.00130. [DOI] [PubMed] [Google Scholar]
- Lucas CP, Zhang H, Fisher PW, Shaffer D, Regier DA, Narrow WE, Bourdon K, Dulcan MK, Canino G, Rubio-Stipec M, Lahey BB, Friman P. The DISC Predictive Scales (DPS): efficiently screening for diagnoses. J Am Acad Child Adolesc Psychiatry. 2001;40(4):443–9. doi: 10.1097/00004583-200104000-00013. [DOI] [PubMed] [Google Scholar]
- Maner JK, Richey JA, Cromer K, Mallott M, Lejuez CW, Joiner TE, Schmidt NB. Dispositional anxiety and risk-avoidant decision-making. Pers Indiv Differ. 2007;42:665–675. [Google Scholar]
- Manes F, Sahakian B, Clark L, Rogers R, Antoun N, Aitken M, Robbins T. Decision-making processes following damage to the prefrontal cortex. Brain. 2002;125(Pt 3):624–39. doi: 10.1093/brain/awf049. [DOI] [PubMed] [Google Scholar]
- McLeod JG, Van der Meulen JP. Cerebellar control of alpha motoneurone function. Proc Aust Assoc Neurol. 1968;5(1):19–24. [PubMed] [Google Scholar]
- Oldfield RC. The assessment and analysis of handedness: the Edinburgh inventory. Neuropsychologia. 1971;9(1):97–113. doi: 10.1016/0028-3932(71)90067-4. [DOI] [PubMed] [Google Scholar]
- Rice JP, Reich T, Bucholz KK, Neuman RJ, Fishman R, Rochberg N, Hesselbrock VM, Nurnberger JI, Jr, Schuckit MA, Begleiter H. Comparison of direct interview and family history diagnoses of alcohol dependence. Alcoholism Clin Exp Res. 1995;19(4):1018–23. doi: 10.1111/j.1530-0277.1995.tb00983.x. [DOI] [PubMed] [Google Scholar]
- Roman E, Meyerson BJ, Hyytia P, Nylander I. The multivariate concentric square field test reveals different behavioural profiles in male AA and ANA rats with regard to risk taking and environmental reactivity. Behav Brain Res. 2007;183(2):195–205. doi: 10.1016/j.bbr.2007.06.009. [DOI] [PubMed] [Google Scholar]
- Schweinsburg AD, Paulus MP, Barlett VC, Killeen LA, Caldwell LC, Pulido C, Brown SA, Tapert SF. An FMRI study of response inhibition in youths with a family history of alcoholism. Ann N Y Acad Sci. 2004;1021:391–4. doi: 10.1196/annals.1308.050. [DOI] [PubMed] [Google Scholar]
- Silveri MM, Rogowska J, McCaffrey A, Yurgelun-Todd DA. Adolescents at risk for alcohol abuse demonstrate altered frontal lobe activation during stroop performance. Alcohol Clin Exp Res. 2011;35(2):218–28. doi: 10.1111/j.1530-0277.2010.01337.x. [DOI] [PMC free article] [PubMed] [Google Scholar]
- Silveri MM, Tzilos GK, Yurgelun-Todd DA. Relationship between white matter volume and cognitive performance during adolescence: effects of age, sex and risk for drug use. Addiction. 2008;103(9):1509–20. doi: 10.1111/j.1360-0443.2008.02272.x. [DOI] [PMC free article] [PubMed] [Google Scholar]
- Spadoni AD, Norman AL, Schweinsburg AD, Tapert SF. Effects of family history of alcohol use disorders on spatial working memory BOLD response in adolescents. Alcohol Clin Exp Res. 2008;32(7):1135–45. doi: 10.1111/j.1530-0277.2008.00694.x. [DOI] [PMC free article] [PubMed] [Google Scholar]
- Stoltenberg SF, Mudd SA, Blow FC, Hill EM. Evaluating measures of family history of alcoholism: density versus dichotomy. Addiction. 1998;93(10):1511–20. doi: 10.1046/j.1360-0443.1998.931015117.x. [DOI] [PubMed] [Google Scholar]
- Sullivan EV, Harding AJ, Pentney R, Dlugos C, Martin PR, Parks MH, Desmond JE, Chen SH, Pryor MR, De Rosa E, Pfefferbaum A. Disruption of frontocerebellar circuitry and function in alcoholism. Alcohol Clin Exp Res. 2003;27(2):301–9. doi: 10.1097/01.ALC.0000052584.05305.98. [DOI] [PubMed] [Google Scholar]
- Talairach J, Tournoux P. Coplanar Stereotaxic Atlas of the Human Brain. Three-Dimensional Proportional System: An Approach to Cerebral Imaging. Thieme; New York: 1988. [Google Scholar]
- Tamm L, Menon V, Reiss AL. Maturation of brain function associated with response inhibition. J Am Acad Child Adolesc Psychiatry. 2002;41(10):1231–8. doi: 10.1097/00004583-200210000-00013. [DOI] [PubMed] [Google Scholar]
- Thomas KM, King SW, Franzen PL, Welsh TF, Berkowitz AL, Noll DC, Birmaher V, Casey BJ. A developmental functional MRI study of spatial working memory. Neuroimage. 1999;10(3 Pt 1):327–38. doi: 10.1006/nimg.1999.0466. [DOI] [PubMed] [Google Scholar]
- Van Leijenhorst L, Moor BG, Op de Macks ZA, Rombouts SA, Westenberg PM, Crone EA. Adolescent risky decision-making: neurocognitive development of reward and control regions. Neuroimage. 2010;51(1):345–55. doi: 10.1016/j.neuroimage.2010.02.038. [DOI] [PubMed] [Google Scholar]
- Vanderhasselt MA, De Raedt R, Baeken C. Dorsolateral prefrontal cortex and Stroop performance: tackling the lateralization. Psychon Bull Rev. 2009;16(3):609–12. doi: 10.3758/PBR.16.3.609. [DOI] [PubMed] [Google Scholar]